| Param | Original file | Final file |
|---|---|---|
| Filename | modeM0/AS1A05_064T01_9000002450_16617cztM0_level2.evt | modeM0/AS1A05_064T01_9000002450_16617cztM0_level2_quad_clean.evt |
| Size (bytes) | 474,485,760 | 128,865,600 |
| Size | 452.5 MB | 122.9 MB |
| Events in quadrant A | 2,991,782 | 875,517 |
| Events in quadrant B | 3,564,839 | 888,029 |
| Events in quadrant C | 4,040,158 | 865,344 |
| Events in quadrant D | 3,361,178 | 850,532 |
| Mode M0 | |||
|---|---|---|---|
| Quadrant | BADHDUFLAG | Total packets | Discarded packets |
| A | 0 | 12845 | 3 |
| B | 0 | 14672 | 2 |
| C | 0 | 16182 | 2 |
| D | 0 | 13890 | 2 |
| Mode SS | |||
|---|---|---|---|
| Quadrant | BADHDUFLAG | Total packets | Discarded packets |
| A | 0 | 124 | 0 |
| B | 0 | 124 | 0 |
| C | 0 | 124 | 0 |
| D | 0 | 124 | 0 |
| Mode M9 | |||
|---|---|---|---|
| Quadrant | BADHDUFLAG | Total packets | Discarded packets |
| A | 0 | 20 | 0 |
| B | 0 | 20 | 0 |
| C | 0 | 20 | 0 |
| D | 0 | 21 | 0 |
| Quadrant | Total seconds | Saturated seconds | Saturation percentage |
|---|---|---|---|
| A | 6067 | 49 | 0.807648% |
| B | 6067 | 98 | 1.615296% |
| C | 6067 | 240 | 3.955827% |
| D | 6067 | 52 | 0.857096% |
Noise dominated data is calculated using 1-second bins in cleaned event files. If a bin has >2000 counts, and if more than 50% of those come from <1% of pixels, then it is considered to be noise-dominated and hence unusable.
| Quadrant | # 1 sec bins | Bins with >0 counts | Bins with >2000 counts | High rate bins dominated by noise | Noise dominated (total time) | Noise dominated (detector-on time) | Marked lightcurve |
|---|---|---|---|---|---|---|---|
| A | 7433 | 6069 | 3 | 3 | 0.04% | 0.05% | 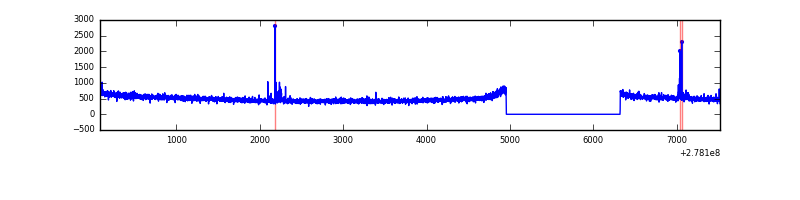 |
| B | 7433 | 6069 | 6 | 6 | 0.08% | 0.10% | 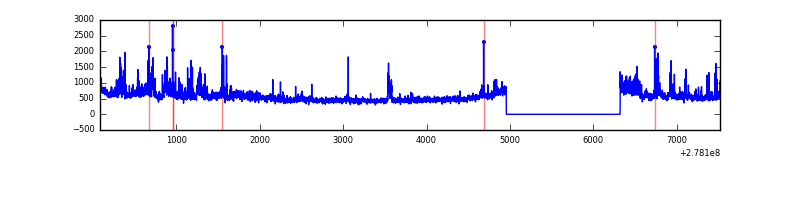 |
| C | 7433 | 6069 | 44 | 44 | 0.59% | 0.72% | 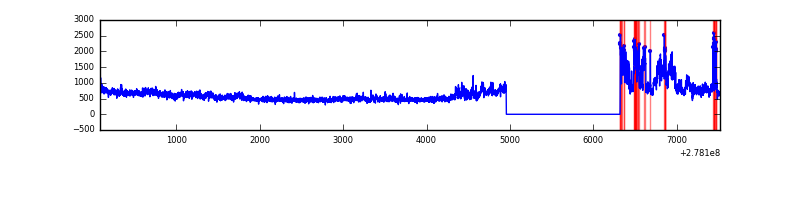 |
| D | 7433 | 6069 | 13 | 13 | 0.17% | 0.21% | 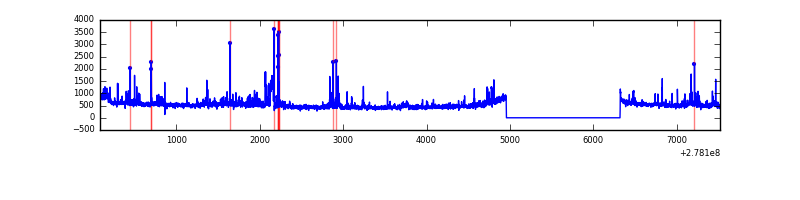 |
Top three noisy pixels from each quadrant. If the there are fewer than three noisy pixels in the level2.evt file, extra rows are filled as -1
| Pixel properties | Quadrant properties | ||||||
|---|---|---|---|---|---|---|---|
| Quadrant | DetID | PixID | Counts | Sigma | Mean | Median | Sigma |
| A | 13 | 248 | 18556 | 116.65 | 768 | 752 | 152.6 |
| A | 15 | 174 | 18254 | 114.67 | 768 | 752 | 152.6 |
| A | 0 | 226 | 6831 | 39.83 | 768 | 752 | 152.6 |
| B | 15 | 35 | 180643 | 1269.66 | 771 | 751 | 141.7 |
| B | 0 | 189 | 125188 | 878.26 | 771 | 751 | 141.7 |
| B | 3 | 209 | 90456 | 633.13 | 771 | 751 | 141.7 |
| C | 3 | 233 | 913971 | 5298.56 | 751 | 758 | 172.4 |
| C | 14 | 238 | 117273 | 676.03 | 751 | 758 | 172.4 |
| C | 7 | 247 | 49159 | 280.83 | 751 | 758 | 172.4 |
| D | 1 | 52 | 366442 | 2015.78 | 761 | 740 | 181.4 |
| D | 10 | 70 | 51675 | 280.76 | 761 | 740 | 181.4 |
| D | 2 | 234 | 25759 | 137.91 | 761 | 740 | 181.4 |
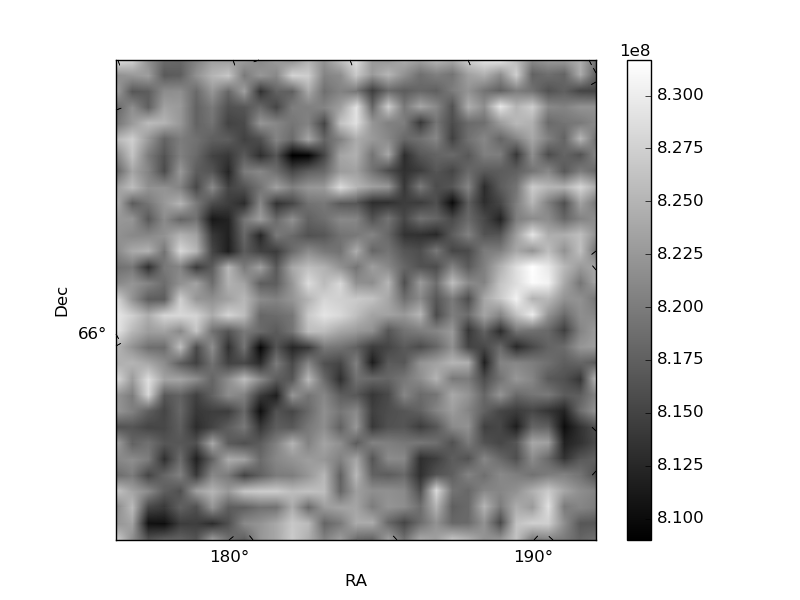
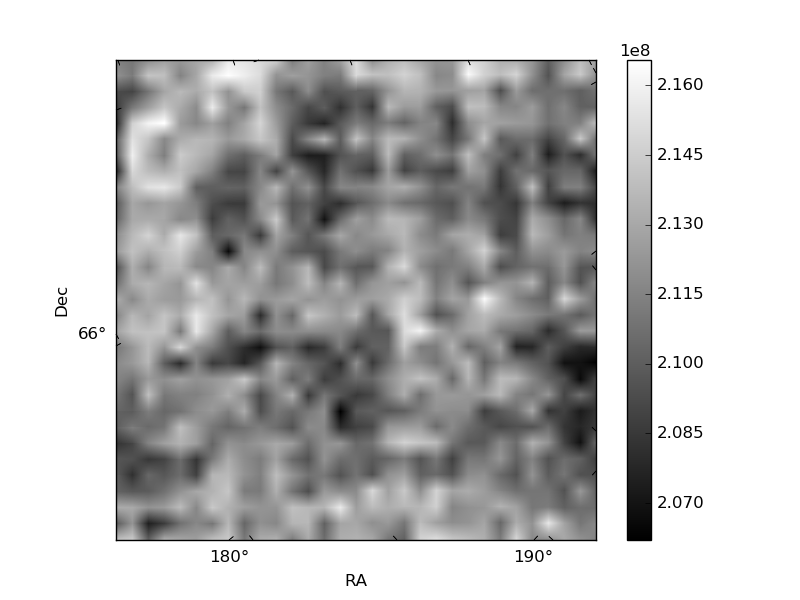
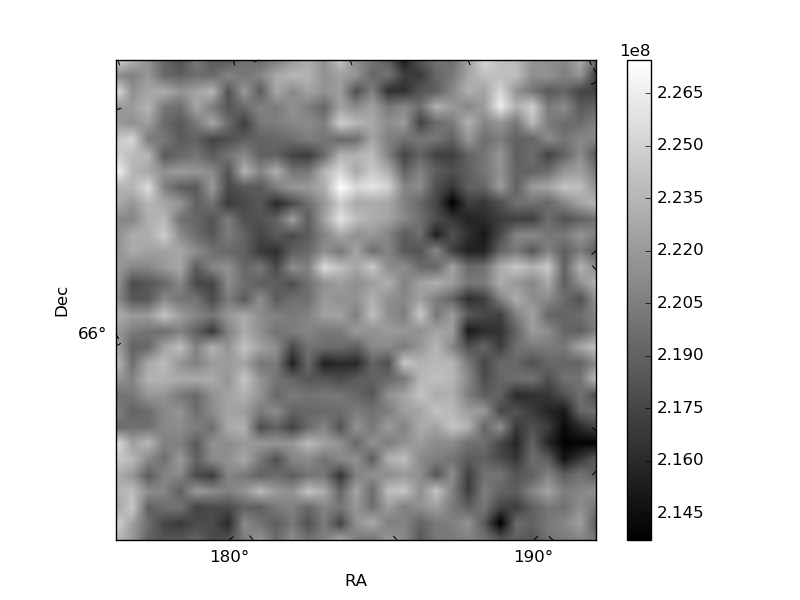
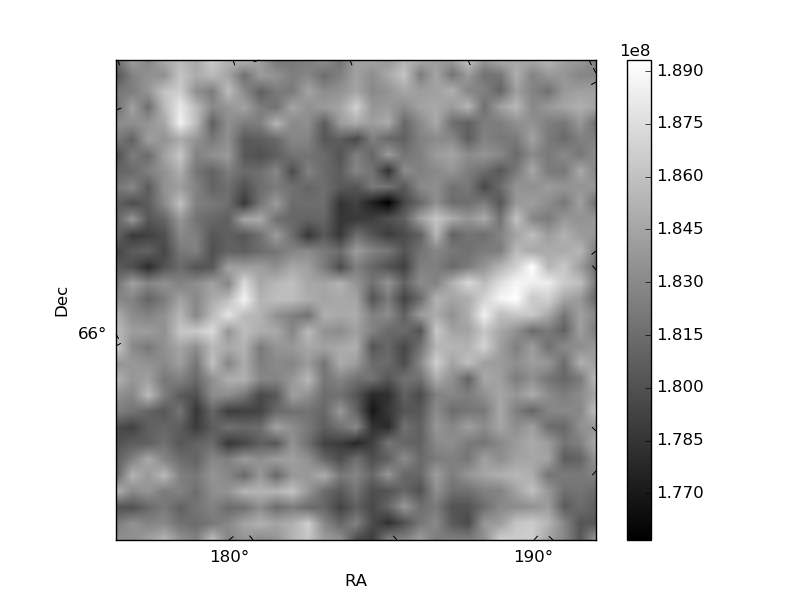
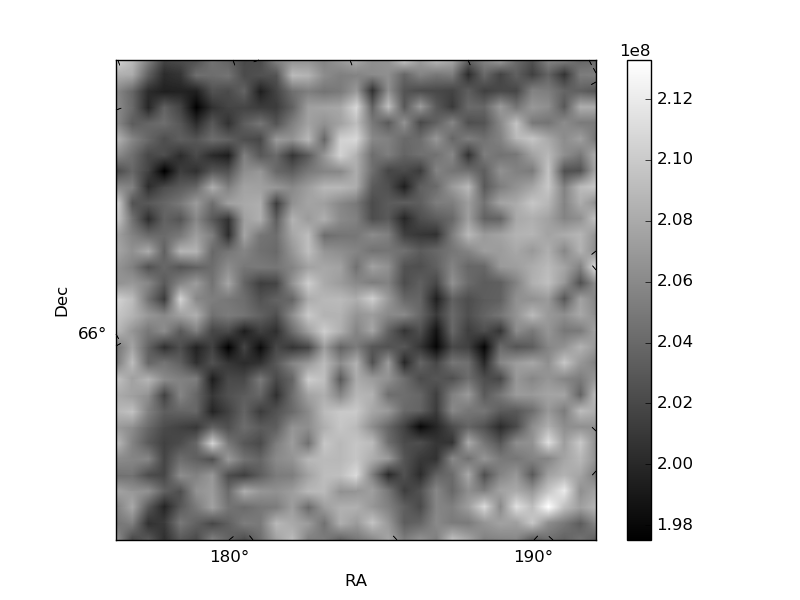
Histogram calculated using DETX and DETY for each event in the final _common_clean file
| Quadrant A | 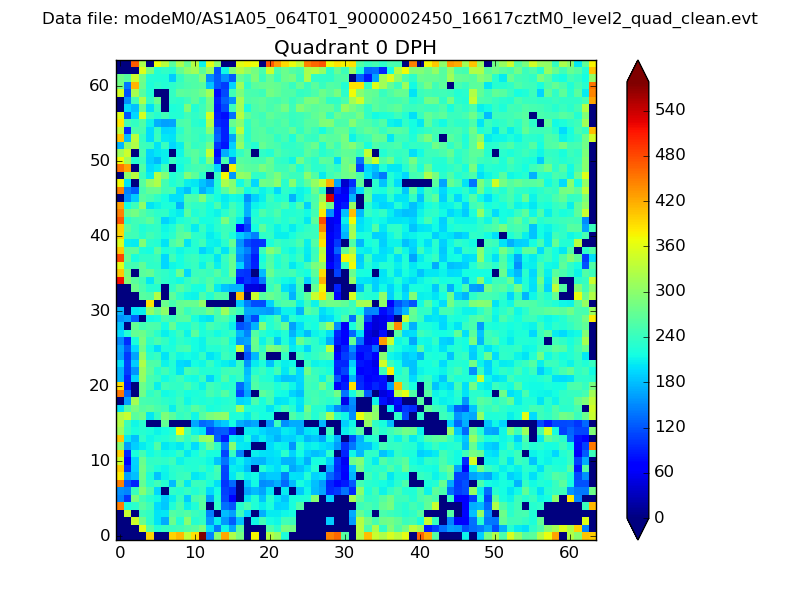 |
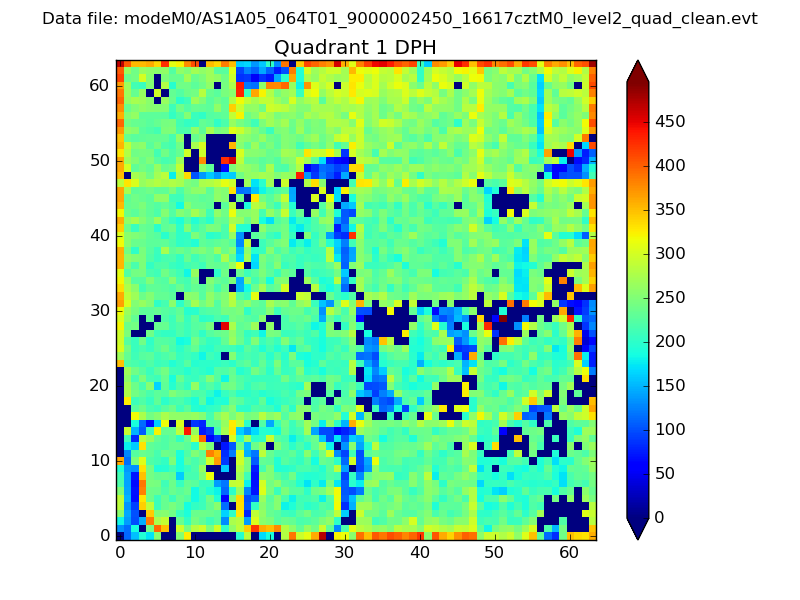 |
Quadrant B |
|---|---|---|---|
| Quadrant D |  |
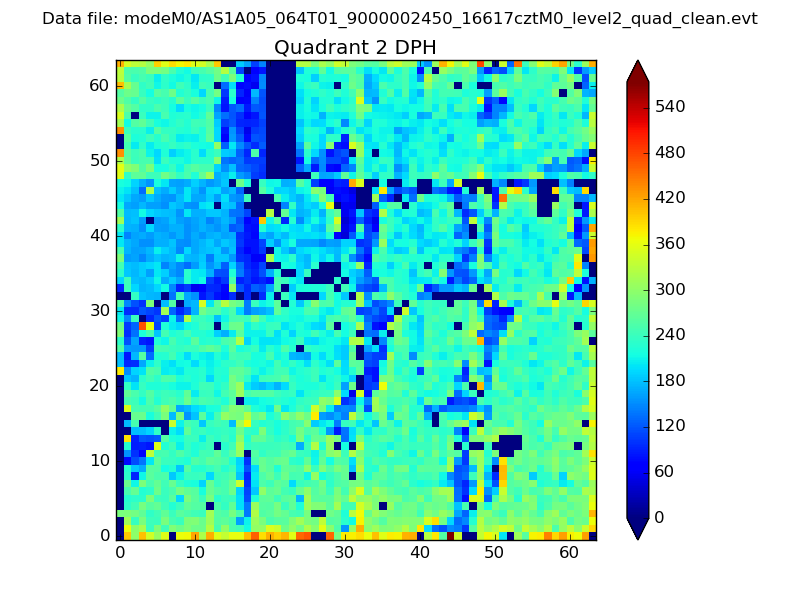 |
Quadrant C |
| Plot type | Count rate plots | Images |
|---|---|---|
| Comparison with Poisson distribution Blue bars denote a histogram of data divided into 1 sec bins. Red curve is a Poisson curve with rate = median count rate of data. |
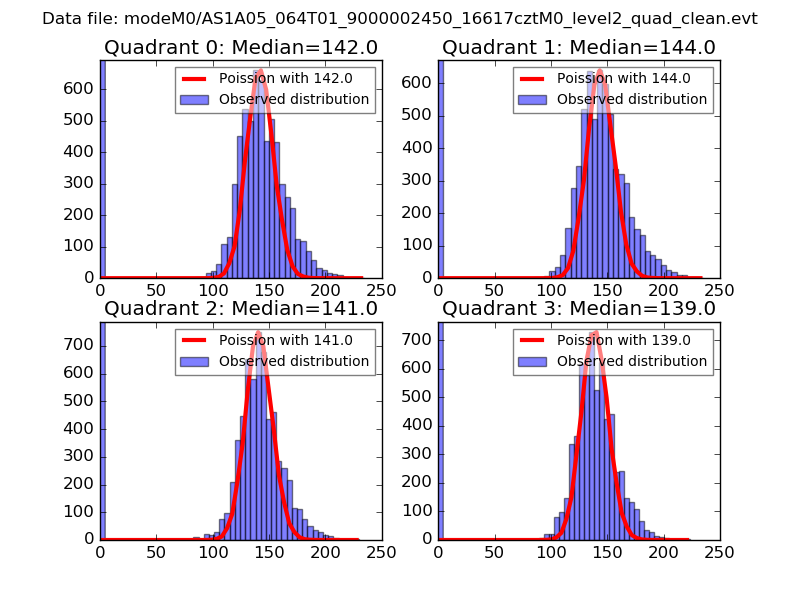 |
 |
| Quadrant-wise count rates Data is divided into 100 sec bins |
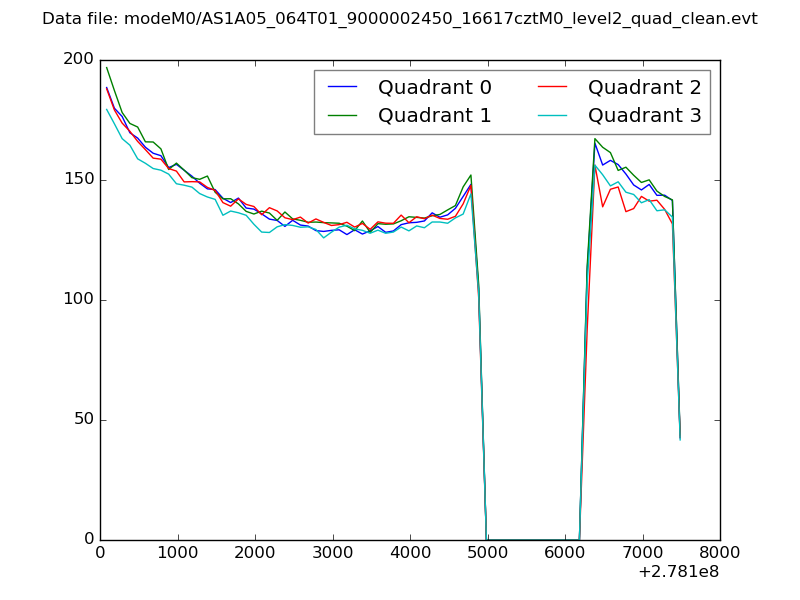 |
|
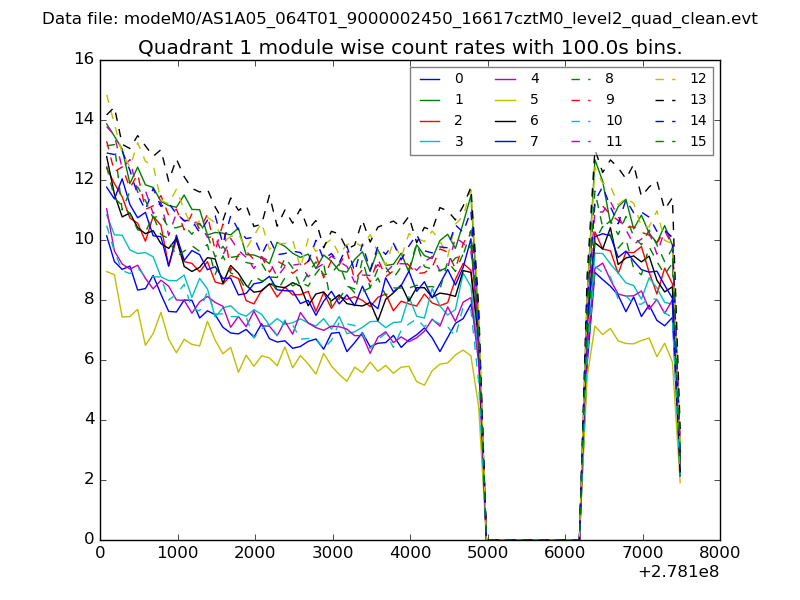
| Module-wise count rates for Quadrant A Data is divided into 100 sec bins |
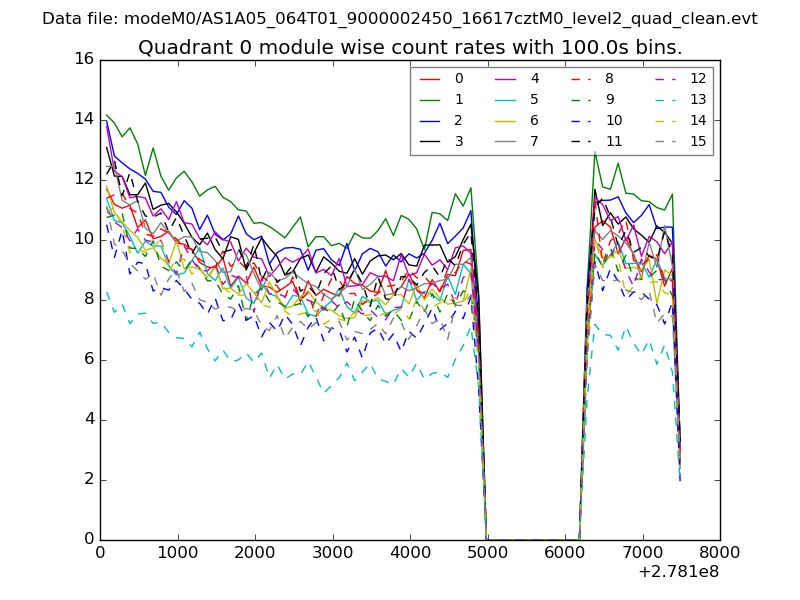 |
 |
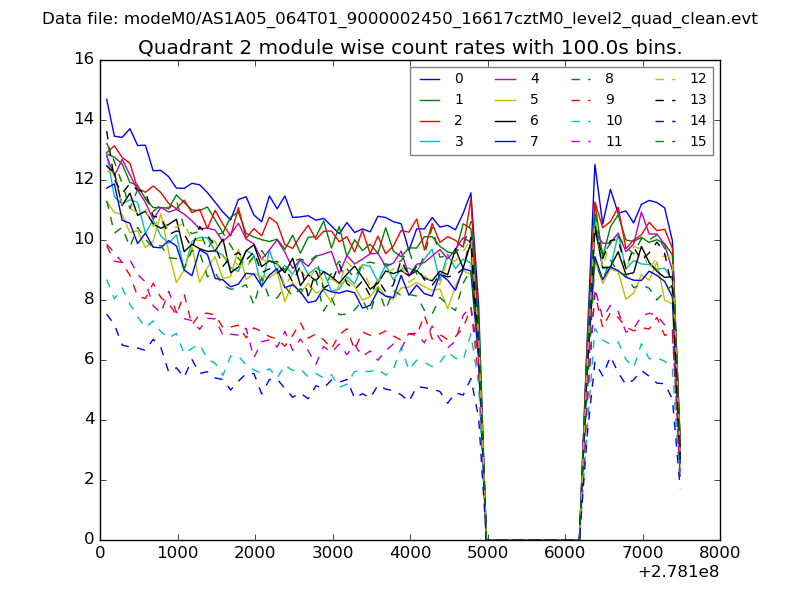
| Module-wise count rates for Quadrant B Data is divided into 100 sec bins |
 |
 |
| Module-wise count rates for Quadrant C Data is divided into 100 sec bins |
 |
 |
| Module-wise count rates for Quadrant D Data is divided into 100 sec bins |
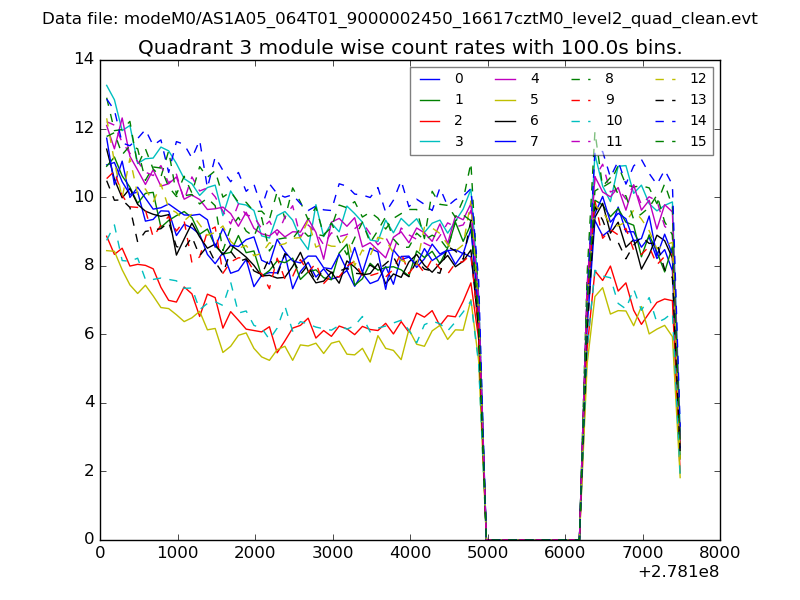 |
 |
| Parameter | Plot |
|---|---|
| CZT HV Monitor | 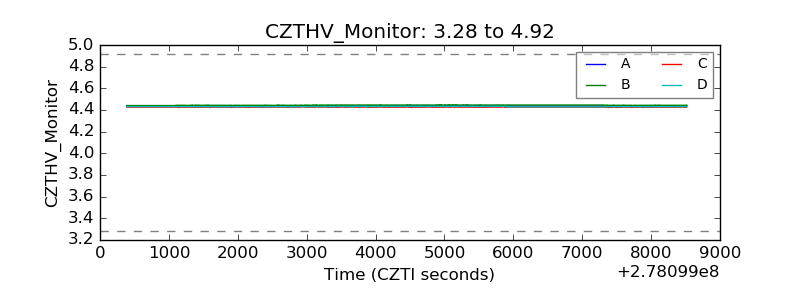 |
| D_VDD | 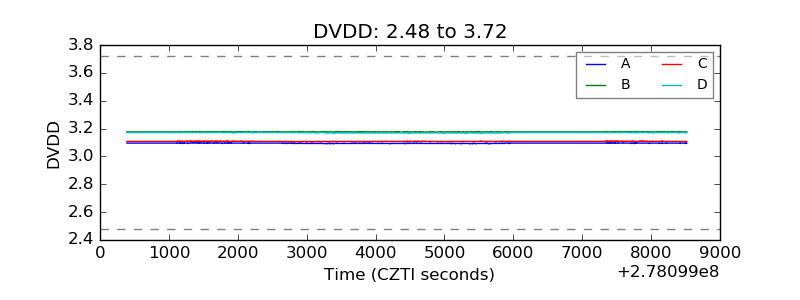 |
| Temperature 1 | 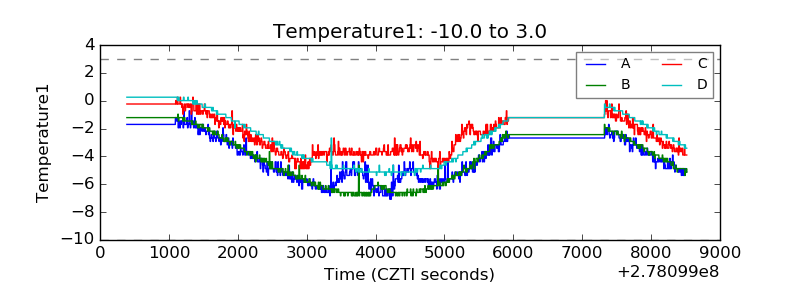 |
| Veto HV Monitor | 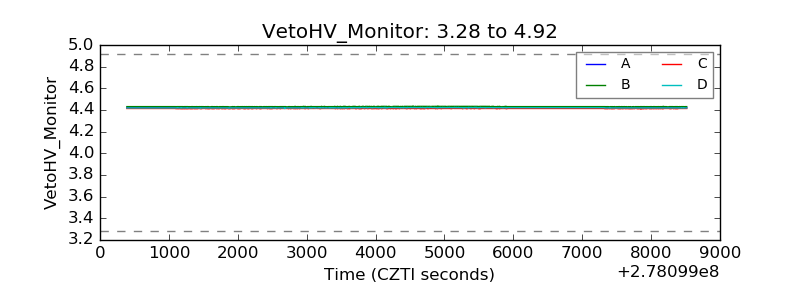 |
| Veto LLD |  |
| Alpha Counter | 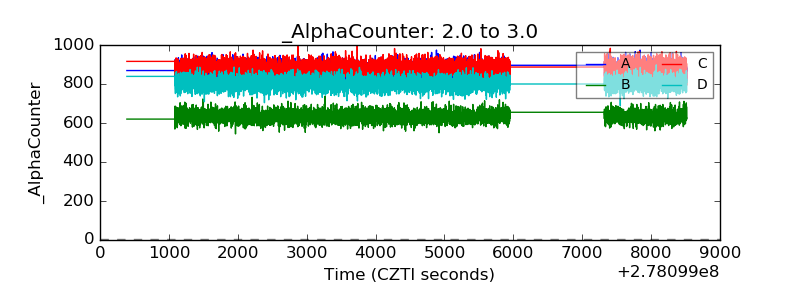 |
| _CPM_Rate | 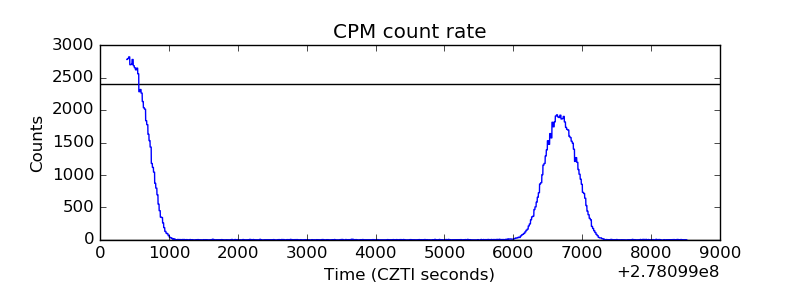 |
| CZT Counter | 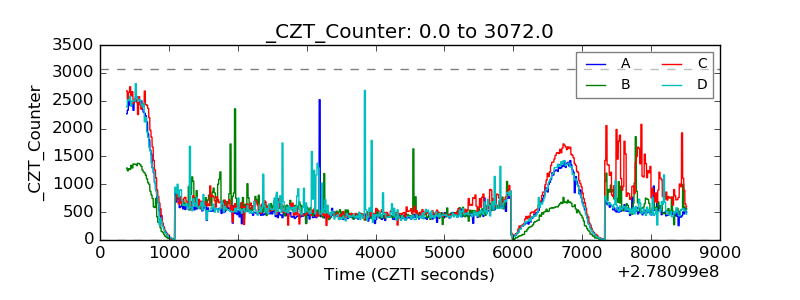 |
| +2.5 Volts monitor |  |
| +5 Volts monitor |  |
| _ROLL_ROT | 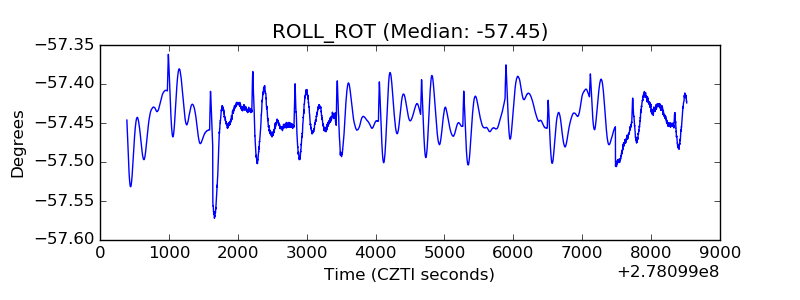 |
| _Roll_DEC | 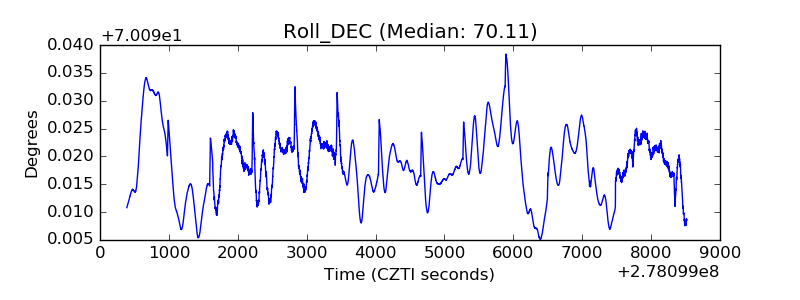 |
| _Roll_RA | 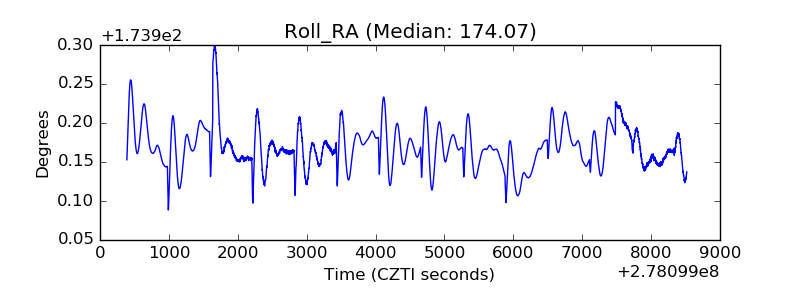 |
| Veto Counter |  |