| Param | Original file | Final file |
|---|---|---|
| Filename | modeM0/AS1A05_064T01_9000002450_16618cztM0_level2.evt | modeM0/AS1A05_064T01_9000002450_16618cztM0_level2_quad_clean.evt |
| Size (bytes) | 497,471,040 | 126,040,320 |
| Size | 474.4 MB | 120.2 MB |
| Events in quadrant A | 3,149,138 | 853,758 |
| Events in quadrant B | 3,477,858 | 866,404 |
| Events in quadrant C | 4,134,474 | 836,501 |
| Events in quadrant D | 3,876,897 | 821,100 |
| Mode M0 | |||
|---|---|---|---|
| Quadrant | BADHDUFLAG | Total packets | Discarded packets |
| A | 0 | 13622 | 3 |
| B | 0 | 14572 | 2 |
| C | 0 | 16489 | 2 |
| D | 0 | 15624 | 2 |
| Mode SS | |||
|---|---|---|---|
| Quadrant | BADHDUFLAG | Total packets | Discarded packets |
| A | 0 | 128 | 0 |
| B | 0 | 128 | 0 |
| C | 0 | 128 | 0 |
| D | 0 | 128 | 0 |
| Mode M9 | |||
|---|---|---|---|
| Quadrant | BADHDUFLAG | Total packets | Discarded packets |
| A | 0 | 20 | 0 |
| B | 0 | 20 | 0 |
| C | 0 | 20 | 0 |
| D | 0 | 21 | 0 |
| Quadrant | Total seconds | Saturated seconds | Saturation percentage |
|---|---|---|---|
| A | 6301 | 88 | 1.396604% |
| B | 6301 | 108 | 1.714014% |
| C | 6301 | 286 | 4.538962% |
| D | 6301 | 150 | 2.380575% |
Noise dominated data is calculated using 1-second bins in cleaned event files. If a bin has >2000 counts, and if more than 50% of those come from <1% of pixels, then it is considered to be noise-dominated and hence unusable.
| Quadrant | # 1 sec bins | Bins with >0 counts | Bins with >2000 counts | High rate bins dominated by noise | Noise dominated (total time) | Noise dominated (detector-on time) | Marked lightcurve |
|---|---|---|---|---|---|---|---|
| A | 7502 | 6303 | 38 | 38 | 0.51% | 0.60% | 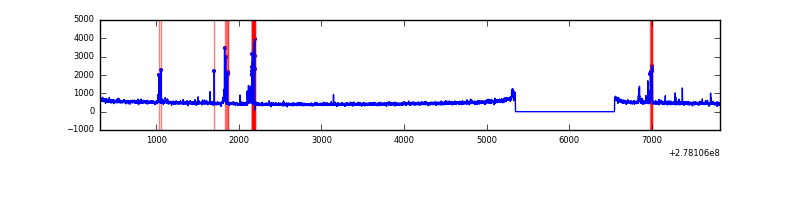 |
| B | 7502 | 6303 | 27 | 27 | 0.36% | 0.43% | 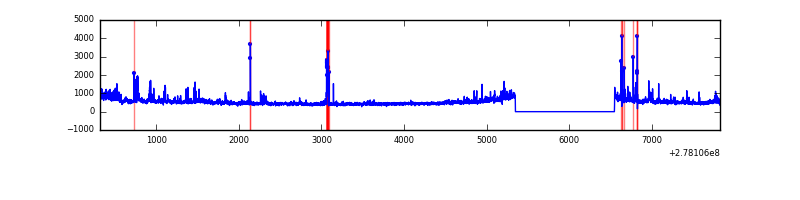 |
| C | 7502 | 6303 | 53 | 53 | 0.71% | 0.84% | 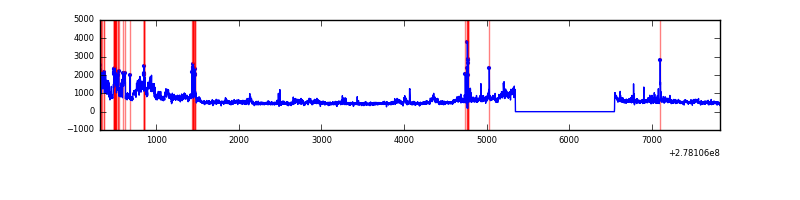 |
| D | 7502 | 6303 | 73 | 73 | 0.97% | 1.16% | 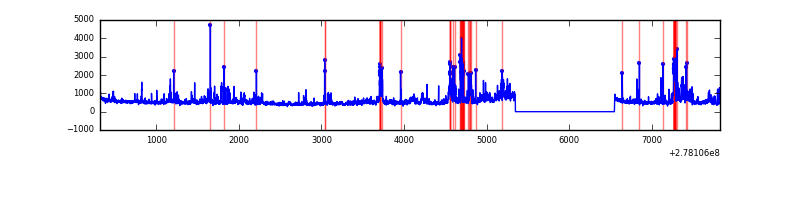 |
Top three noisy pixels from each quadrant. If the there are fewer than three noisy pixels in the level2.evt file, extra rows are filled as -1
| Pixel properties | Quadrant properties | ||||||
|---|---|---|---|---|---|---|---|
| Quadrant | DetID | PixID | Counts | Sigma | Mean | Median | Sigma |
| A | 15 | 174 | 192888 | 1254.86 | 763 | 749 | 153.1 |
| A | 13 | 248 | 18943 | 118.83 | 763 | 749 | 153.1 |
| A | 0 | 226 | 6752 | 39.21 | 763 | 749 | 153.1 |
| B | 15 | 35 | 122605 | 855.25 | 768 | 748 | 142.5 |
| B | 0 | 189 | 98514 | 686.17 | 768 | 748 | 142.5 |
| B | 0 | 197 | 61790 | 428.42 | 768 | 748 | 142.5 |
| C | 3 | 233 | 935368 | 5460.07 | 744 | 747 | 171.2 |
| C | 14 | 238 | 116040 | 673.54 | 744 | 747 | 171.2 |
| C | 0 | 207 | 94717 | 548.97 | 744 | 747 | 171.2 |
| D | 1 | 52 | 685048 | 3774.46 | 752 | 731 | 181.3 |
| D | 10 | 70 | 192779 | 1059.27 | 752 | 731 | 181.3 |
| D | 7 | 38 | 68947 | 376.26 | 752 | 731 | 181.3 |
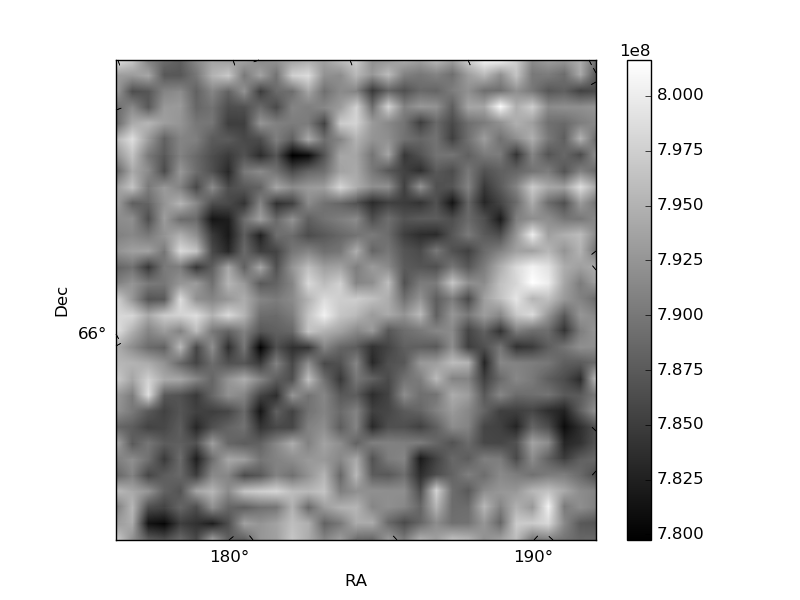
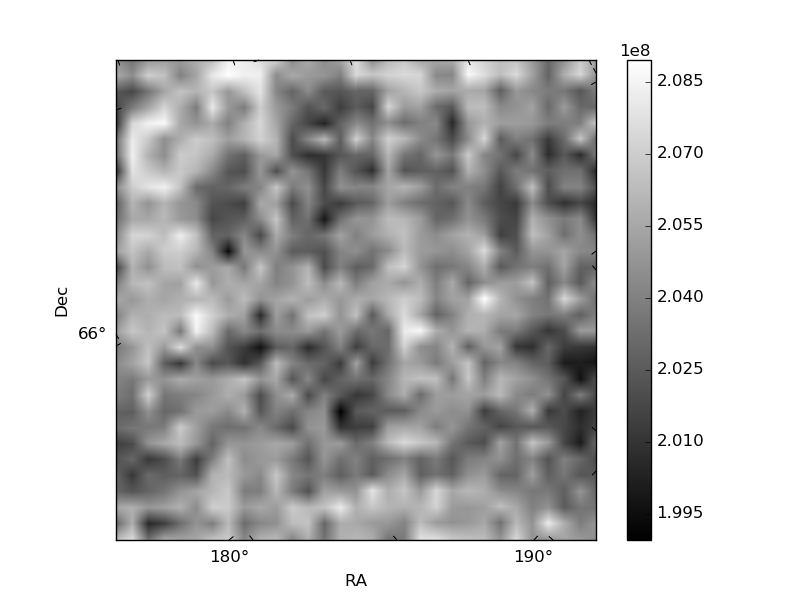
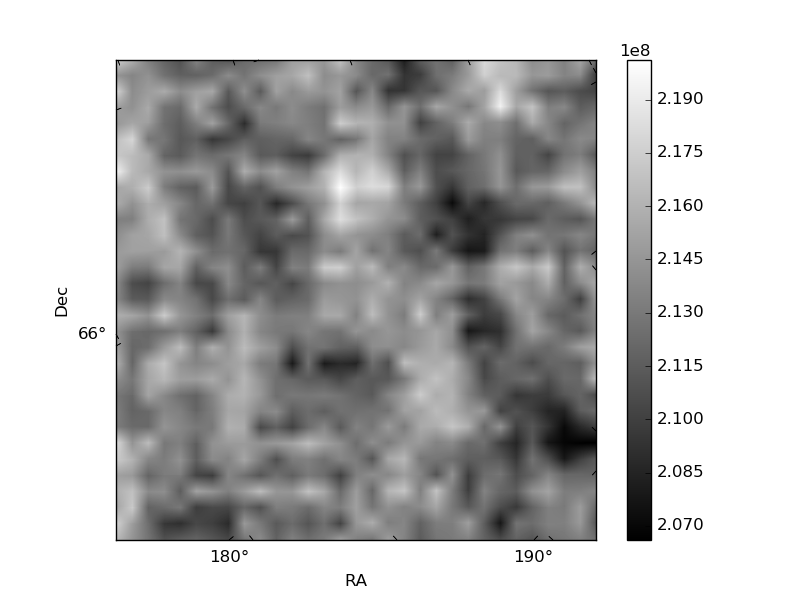
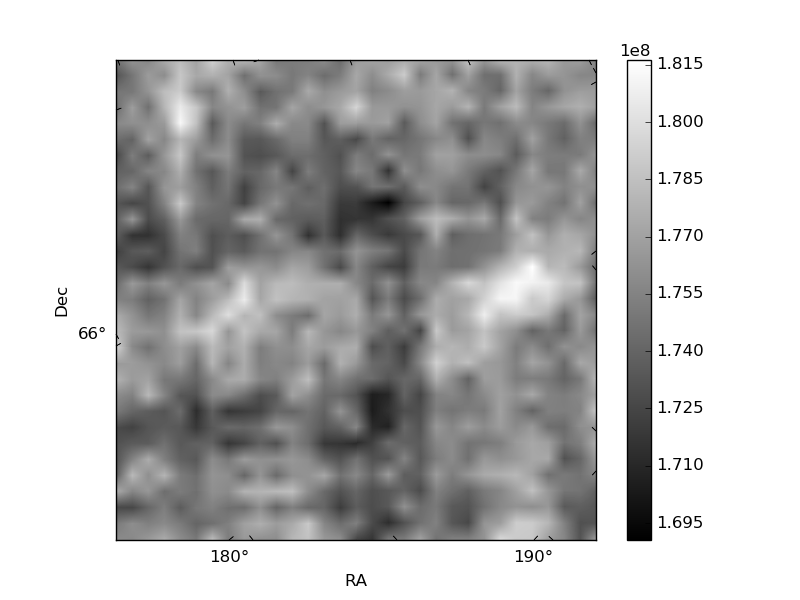
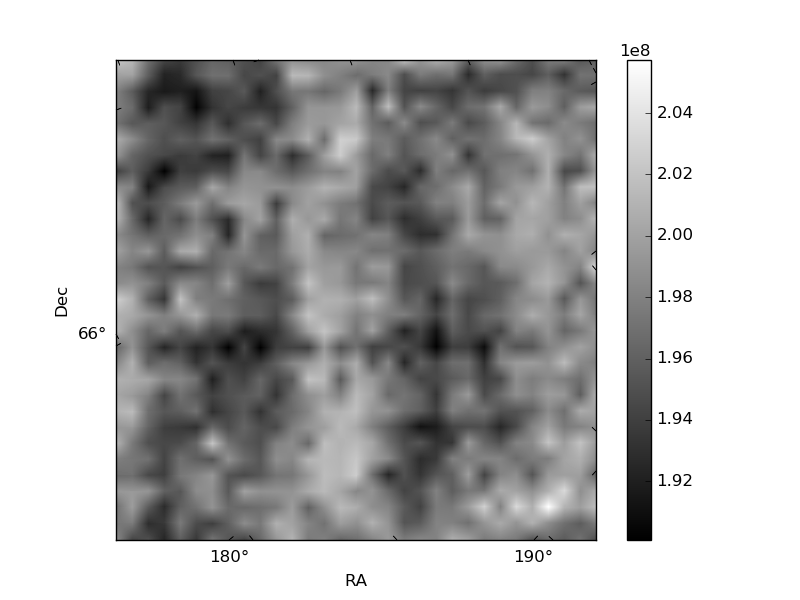
Histogram calculated using DETX and DETY for each event in the final _common_clean file
| Quadrant A | 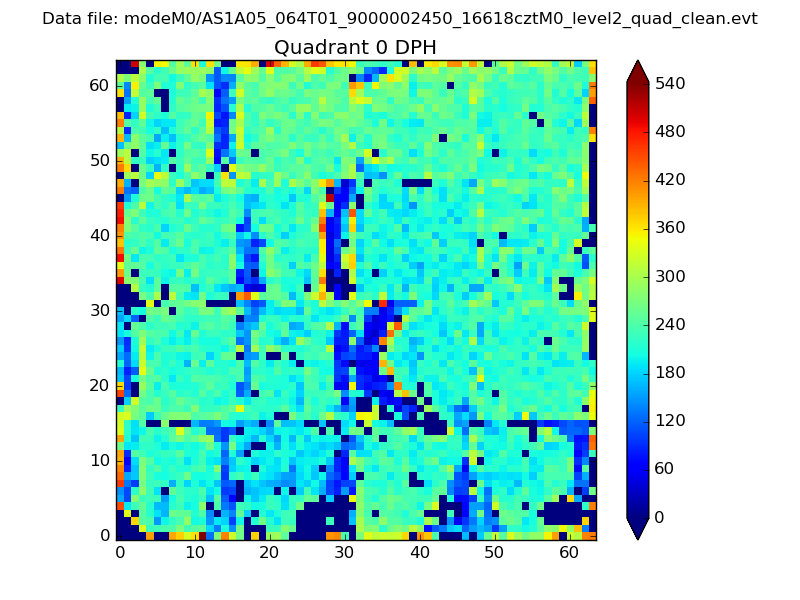 |
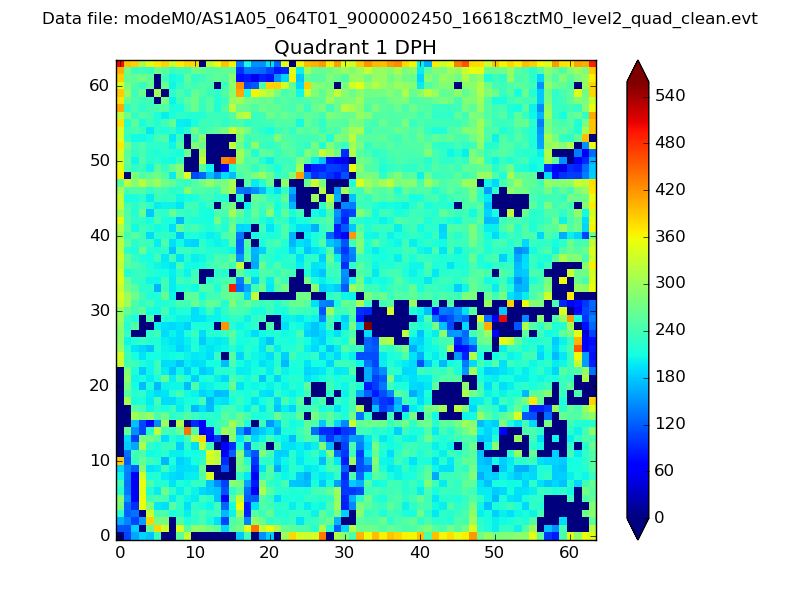 |
Quadrant B |
|---|---|---|---|
| Quadrant D | 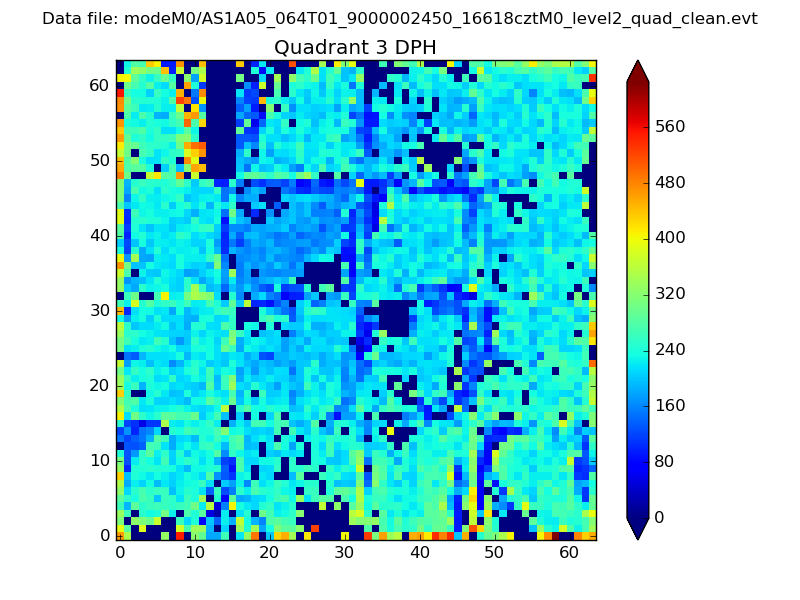 |
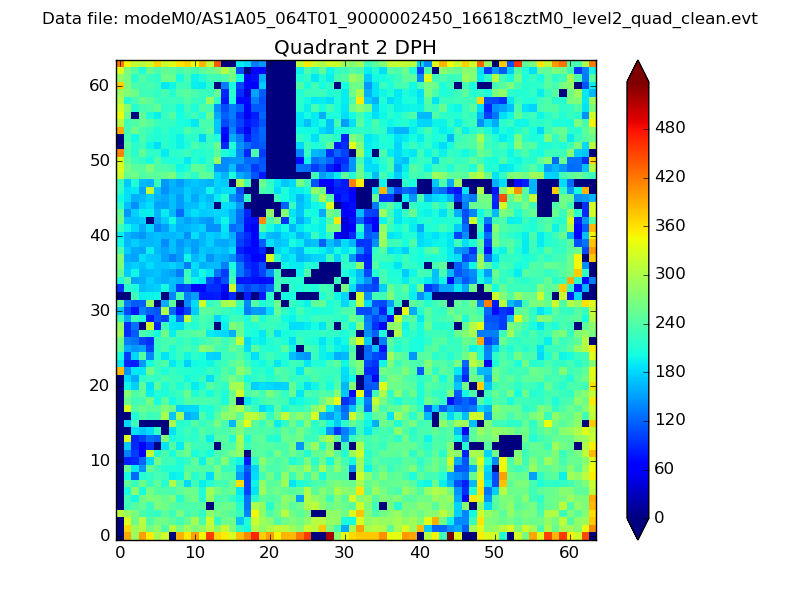 |
Quadrant C |
| Plot type | Count rate plots | Images |
|---|---|---|
| Comparison with Poisson distribution Blue bars denote a histogram of data divided into 1 sec bins. Red curve is a Poisson curve with rate = median count rate of data. |
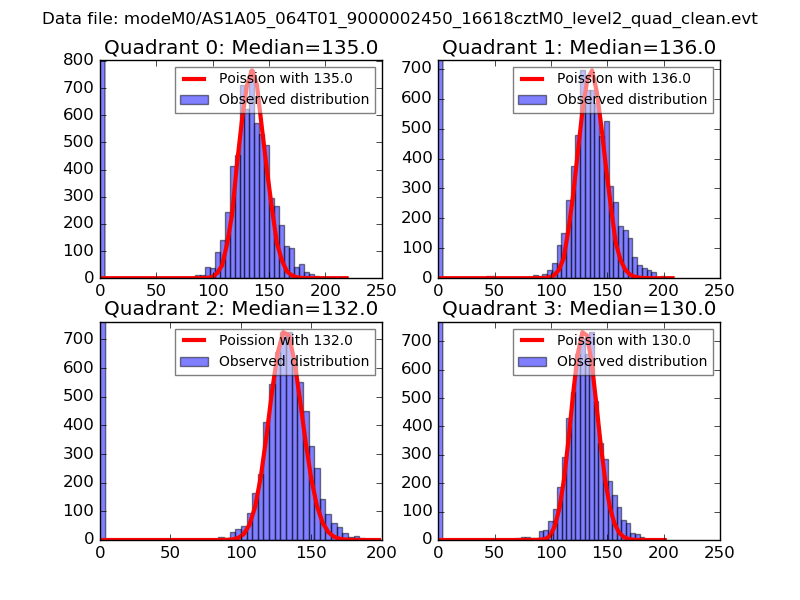 |
 |
| Quadrant-wise count rates Data is divided into 100 sec bins |
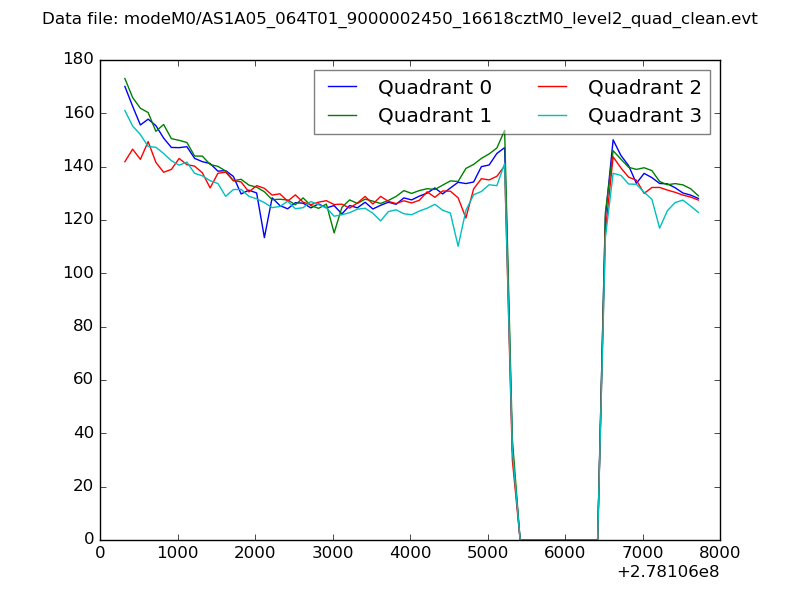 |
|
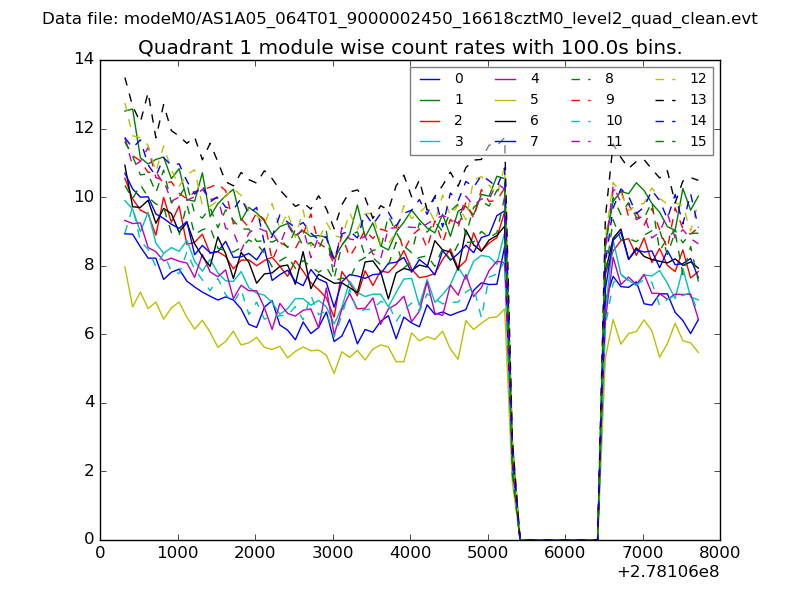
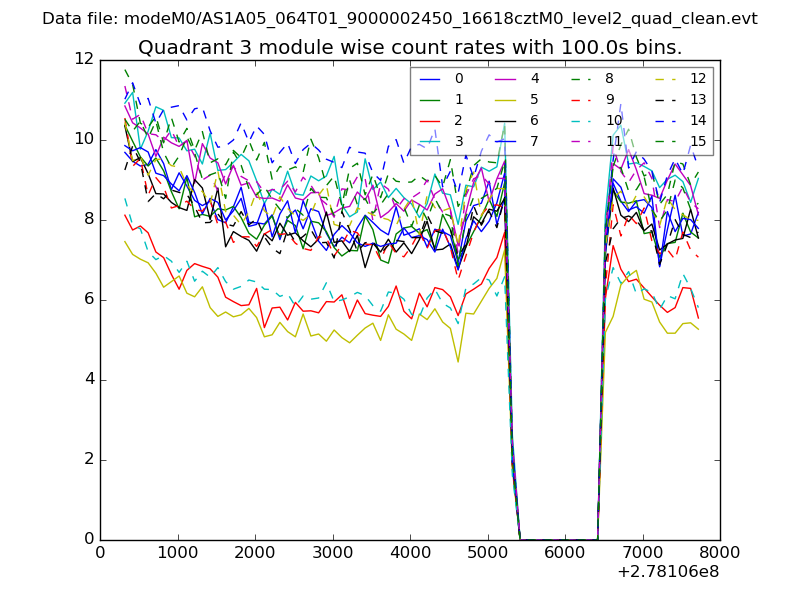
| Module-wise count rates for Quadrant A Data is divided into 100 sec bins |
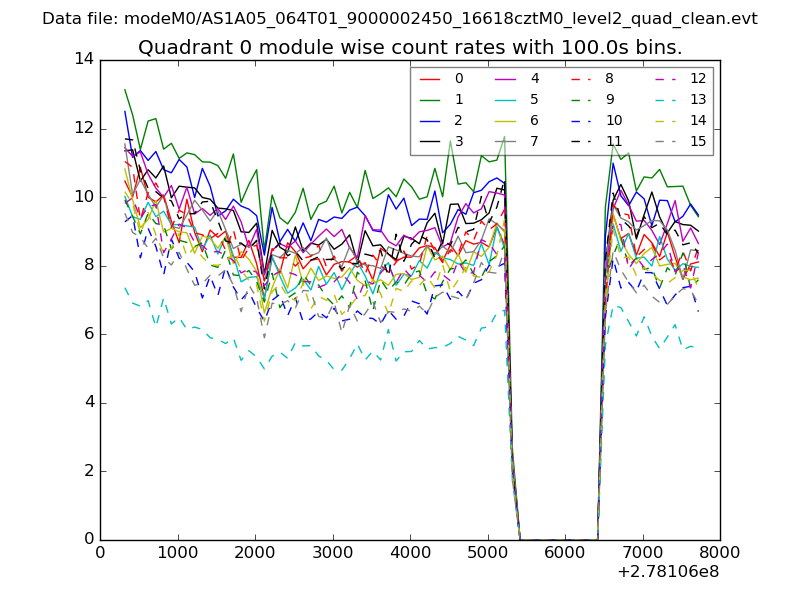 |
 |
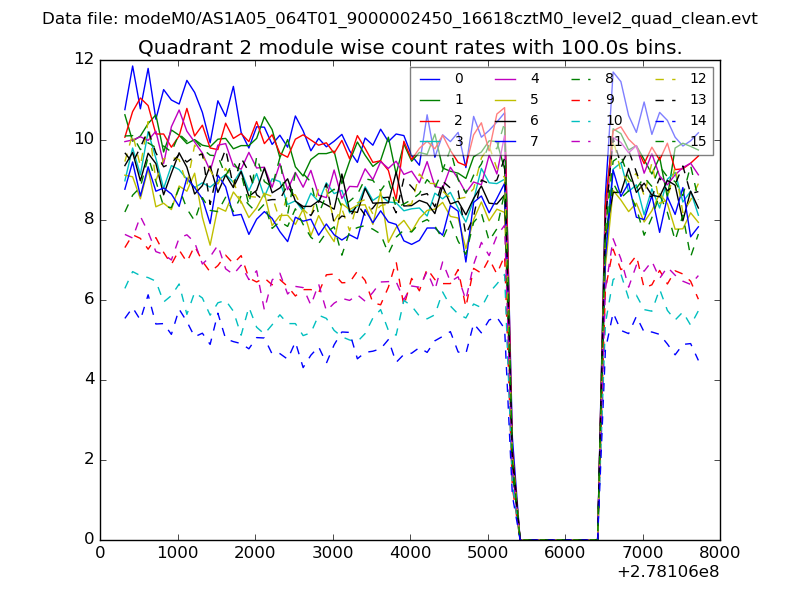
| Module-wise count rates for Quadrant B Data is divided into 100 sec bins |
 |
 |
| Module-wise count rates for Quadrant C Data is divided into 100 sec bins |
 |
 |
| Module-wise count rates for Quadrant D Data is divided into 100 sec bins |
 |
 |
| Parameter | Plot |
|---|---|
| CZT HV Monitor | 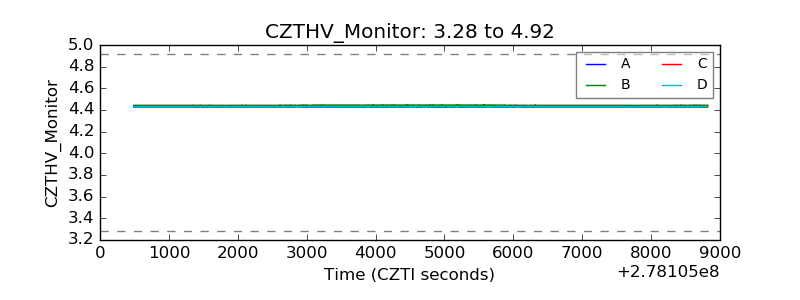 |
| D_VDD | 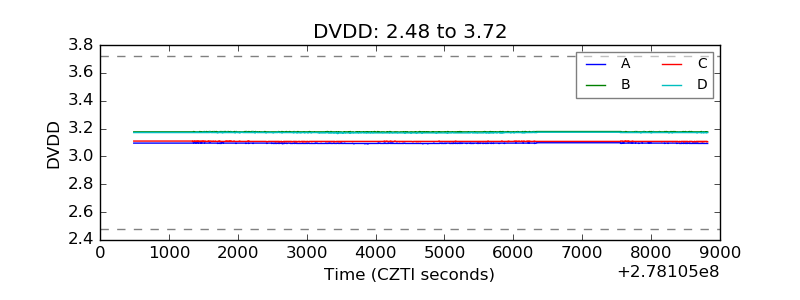 |
| Temperature 1 | 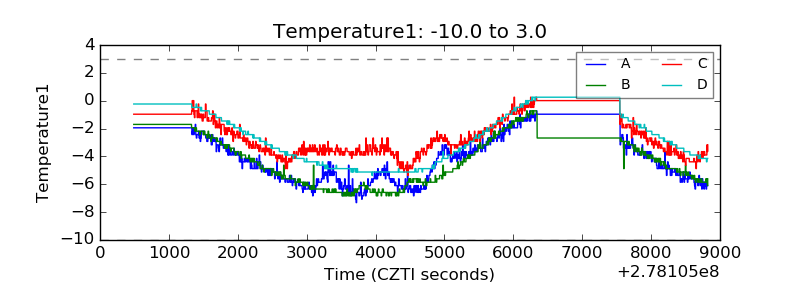 |
| Veto HV Monitor | 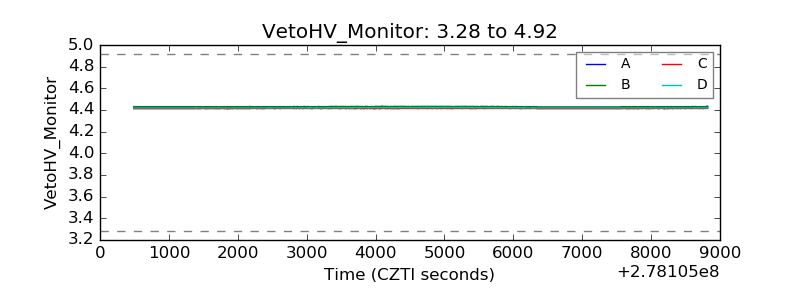 |
| Veto LLD | 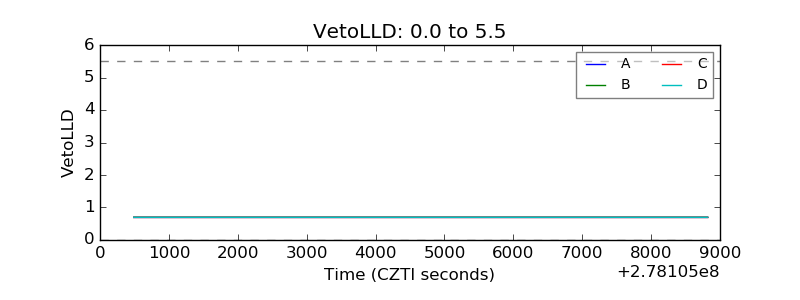 |
| Alpha Counter | 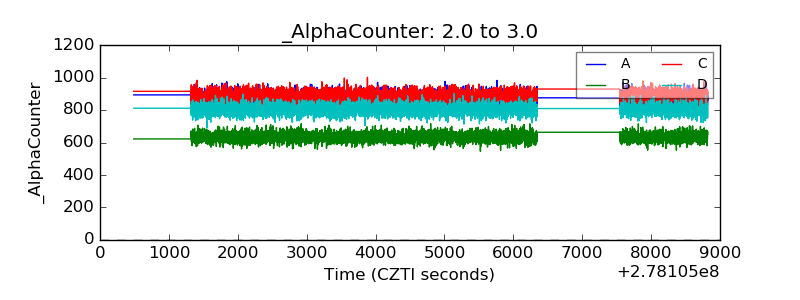 |
| _CPM_Rate | 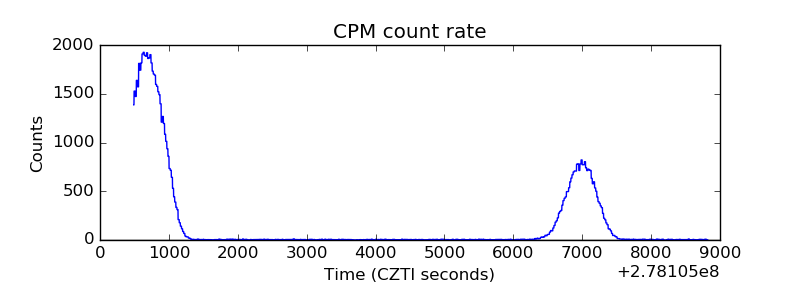 |
| CZT Counter | 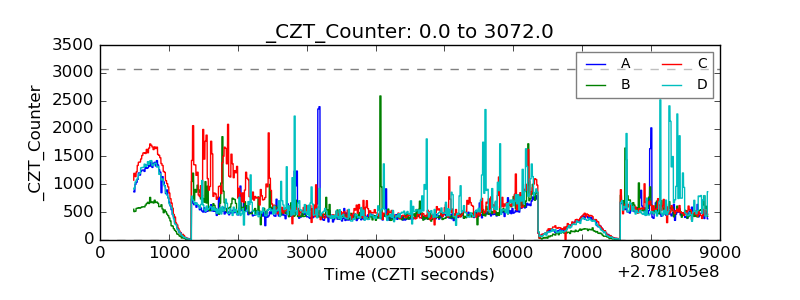 |
| +2.5 Volts monitor | 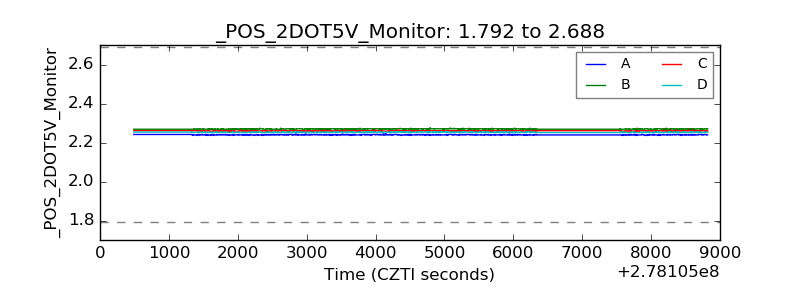 |
| +5 Volts monitor |  |
| _ROLL_ROT |  |
| _Roll_DEC |  |
| _Roll_RA | 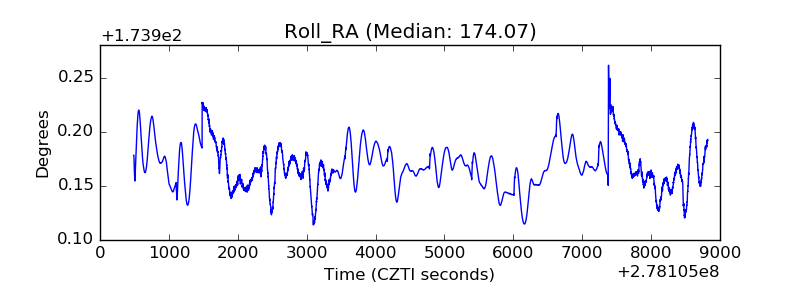 |
| Veto Counter | 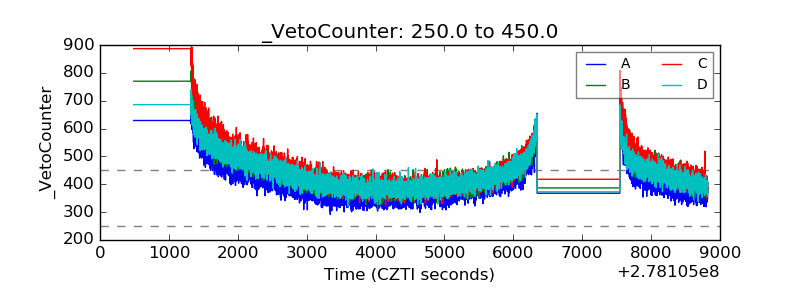 |