| Param | Original file | Final file |
|---|---|---|
| Filename | modeM0/AS1A05_064T01_9000002450_16620cztM0_level2.evt | modeM0/AS1A05_064T01_9000002450_16620cztM0_level2_quad_clean.evt |
| Size (bytes) | 551,076,480 | 138,337,920 |
| Size | 525.5 MB | 131.9 MB |
| Events in quadrant A | 3,952,589 | 919,779 |
| Events in quadrant B | 3,816,646 | 938,009 |
| Events in quadrant C | 4,352,573 | 912,030 |
| Events in quadrant D | 4,057,423 | 896,975 |
| Mode M0 | |||
|---|---|---|---|
| Quadrant | BADHDUFLAG | Total packets | Discarded packets |
| A | 0 | 17182 | 3 |
| B | 0 | 16562 | 2 |
| C | 0 | 17867 | 2 |
| D | 0 | 16934 | 2 |
| Mode SS | |||
|---|---|---|---|
| Quadrant | BADHDUFLAG | Total packets | Discarded packets |
| A | 0 | 152 | 0 |
| B | 0 | 152 | 0 |
| C | 0 | 152 | 0 |
| D | 0 | 152 | 0 |
| Mode M9 | |||
|---|---|---|---|
| Quadrant | BADHDUFLAG | Total packets | Discarded packets |
| A | 0 | 5 | 0 |
| B | 0 | 5 | 0 |
| C | 0 | 5 | 0 |
| D | 0 | 6 | 0 |
| Quadrant | Total seconds | Saturated seconds | Saturation percentage |
|---|---|---|---|
| A | 7520 | 194 | 2.579787% |
| B | 7520 | 92 | 1.223404% |
| C | 7520 | 152 | 2.021277% |
| D | 7520 | 63 | 0.837766% |
Noise dominated data is calculated using 1-second bins in cleaned event files. If a bin has >2000 counts, and if more than 50% of those come from <1% of pixels, then it is considered to be noise-dominated and hence unusable.
| Quadrant | # 1 sec bins | Bins with >0 counts | Bins with >2000 counts | High rate bins dominated by noise | Noise dominated (total time) | Noise dominated (detector-on time) | Marked lightcurve |
|---|---|---|---|---|---|---|---|
| A | 7916 | 7522 | 86 | 86 | 1.09% | 1.14% | 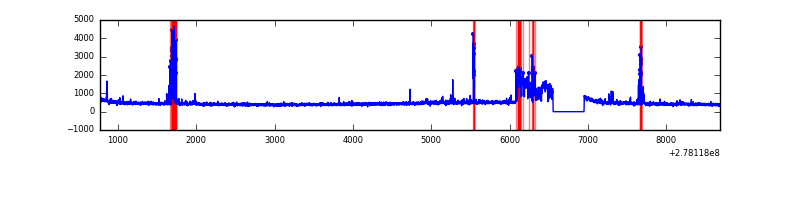 |
| B | 7916 | 7522 | 10 | 10 | 0.13% | 0.13% | 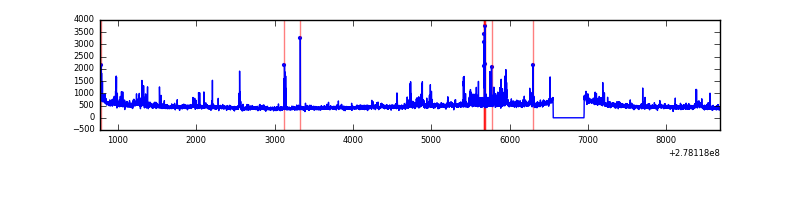 |
| C | 7916 | 7522 | 0 | 0 | 0.00% | 0.00% | 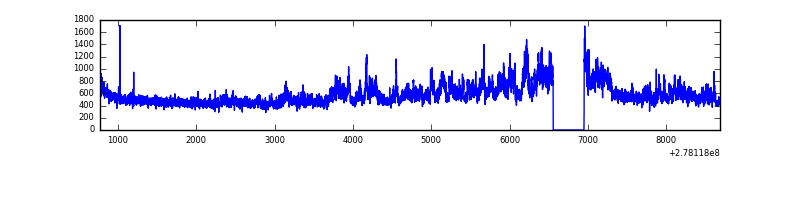 |
| D | 7916 | 7522 | 36 | 36 | 0.45% | 0.48% | 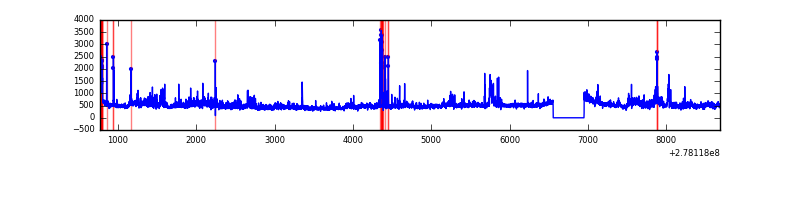 |
Top three noisy pixels from each quadrant. If the there are fewer than three noisy pixels in the level2.evt file, extra rows are filled as -1
| Pixel properties | Quadrant properties | ||||||
|---|---|---|---|---|---|---|---|
| Quadrant | DetID | PixID | Counts | Sigma | Mean | Median | Sigma |
| A | 15 | 174 | 585945 | 3344.9 | 862 | 841 | 174.9 |
| A | 4 | 2 | 24930 | 137.71 | 862 | 841 | 174.9 |
| A | 3 | 1 | 13929 | 74.82 | 862 | 841 | 174.9 |
| B | 7 | 220 | 81750 | 487.95 | 870 | 846 | 165.8 |
| B | 0 | 197 | 53786 | 319.29 | 870 | 846 | 165.8 |
| B | 0 | 189 | 53353 | 316.68 | 870 | 846 | 165.8 |
| C | 3 | 233 | 917952 | 4726.41 | 839 | 842 | 194.0 |
| C | 14 | 238 | 130081 | 666.04 | 839 | 842 | 194.0 |
| C | 7 | 247 | 32603 | 163.68 | 839 | 842 | 194.0 |
| D | 1 | 52 | 633089 | 3098.56 | 845 | 821 | 204.1 |
| D | 10 | 70 | 85749 | 416.21 | 845 | 821 | 204.1 |
| D | 7 | 38 | 51927 | 250.46 | 845 | 821 | 204.1 |
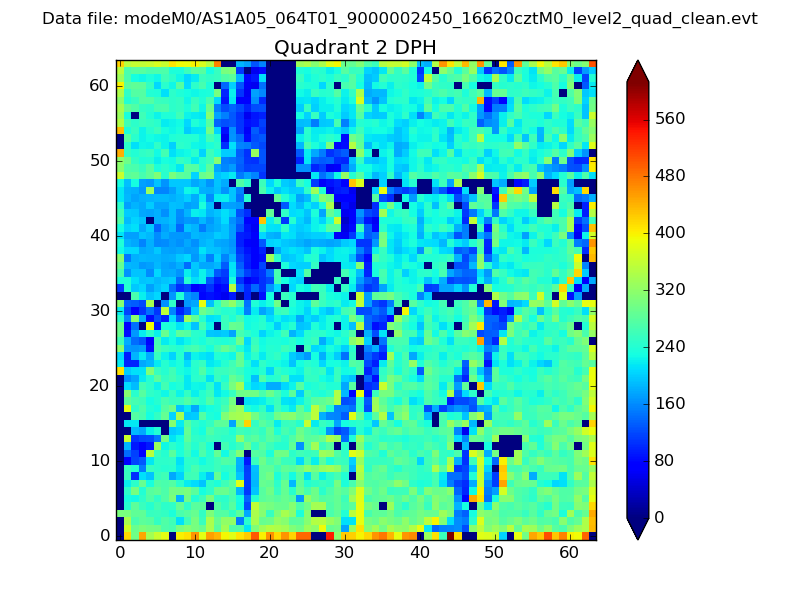
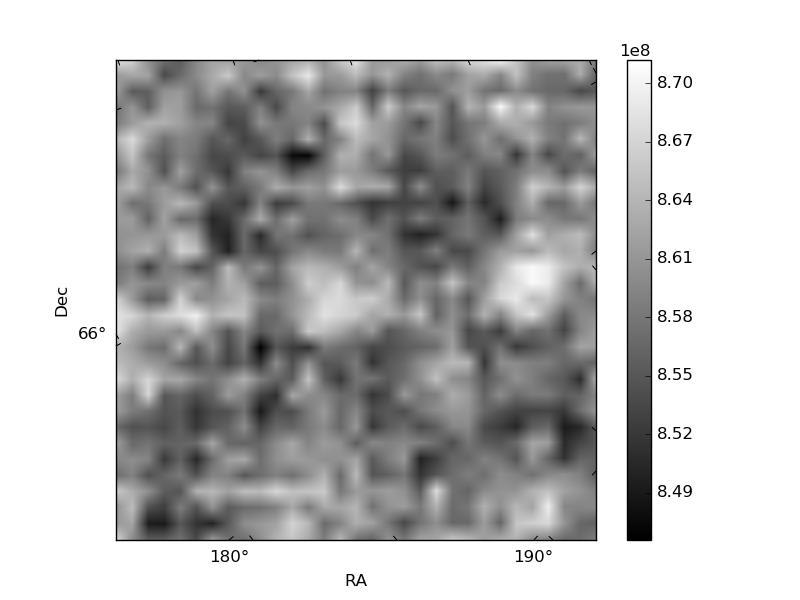
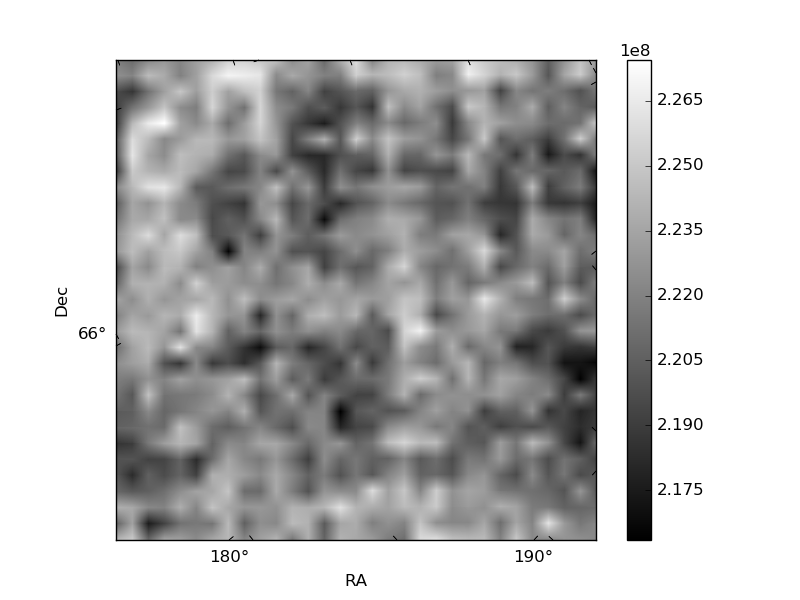
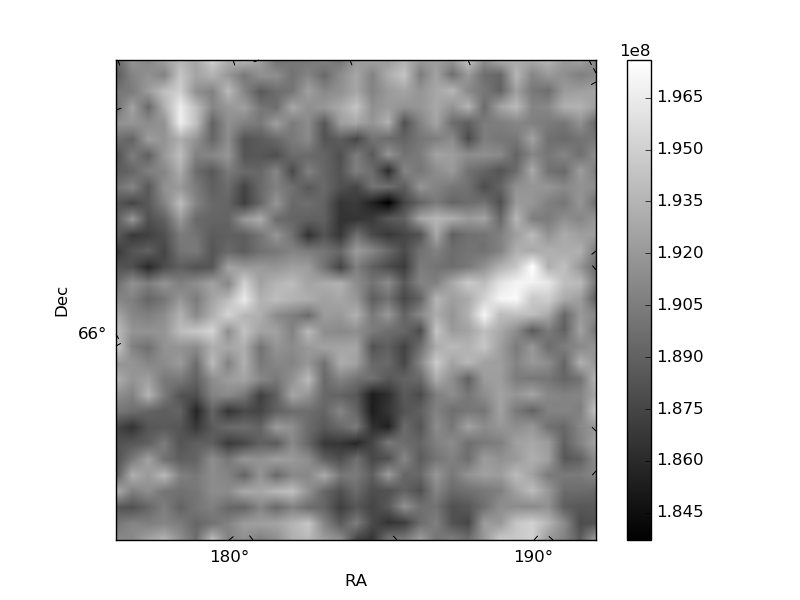
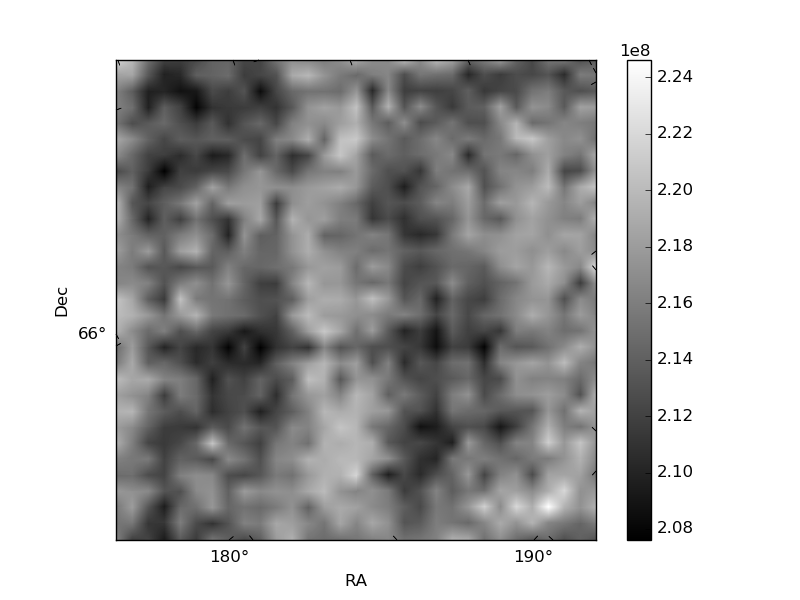
Histogram calculated using DETX and DETY for each event in the final _common_clean file
| Quadrant A | 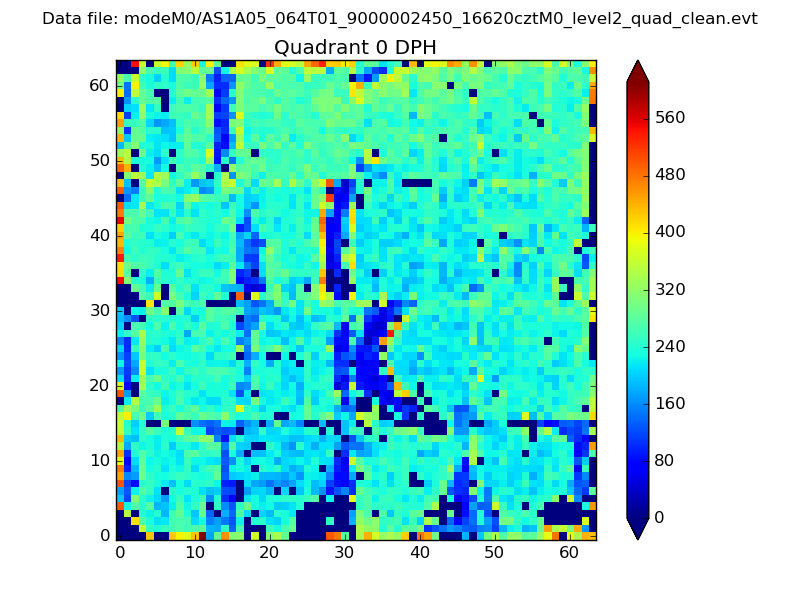 |
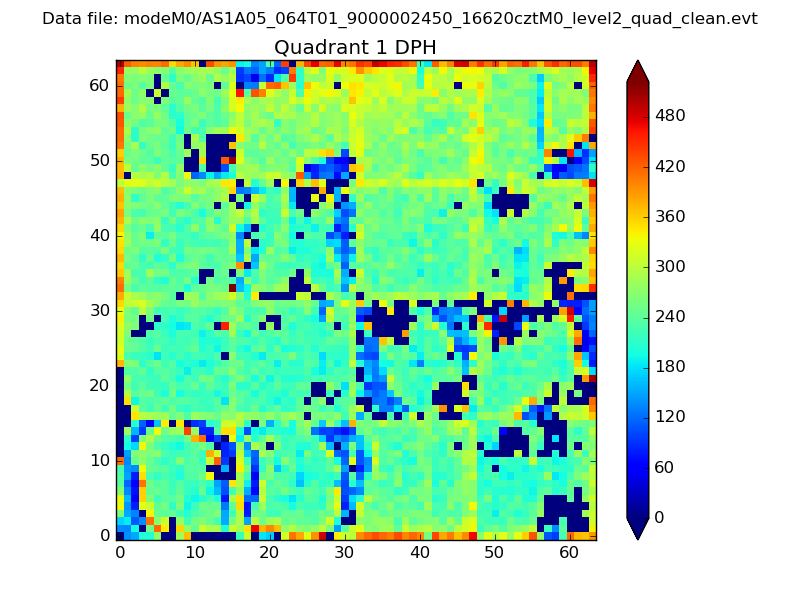 |
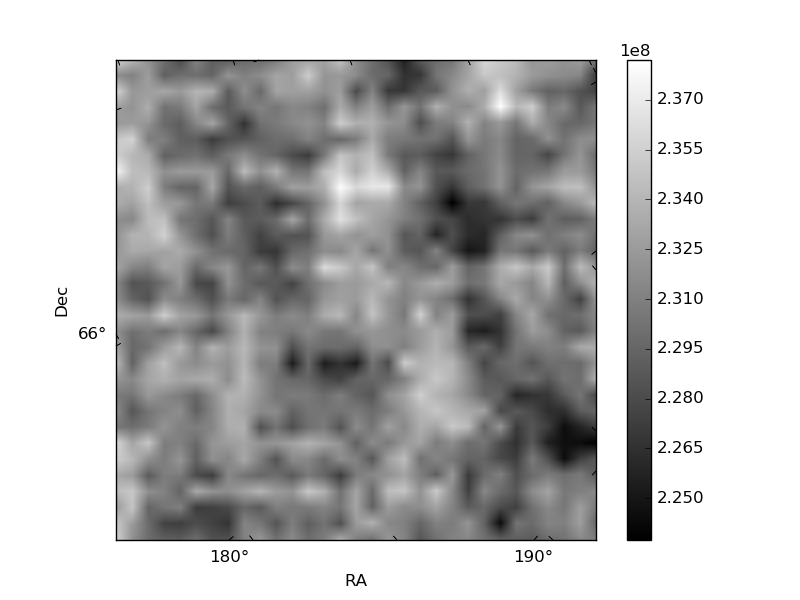
Quadrant B |
|---|---|---|---|
| Quadrant D | 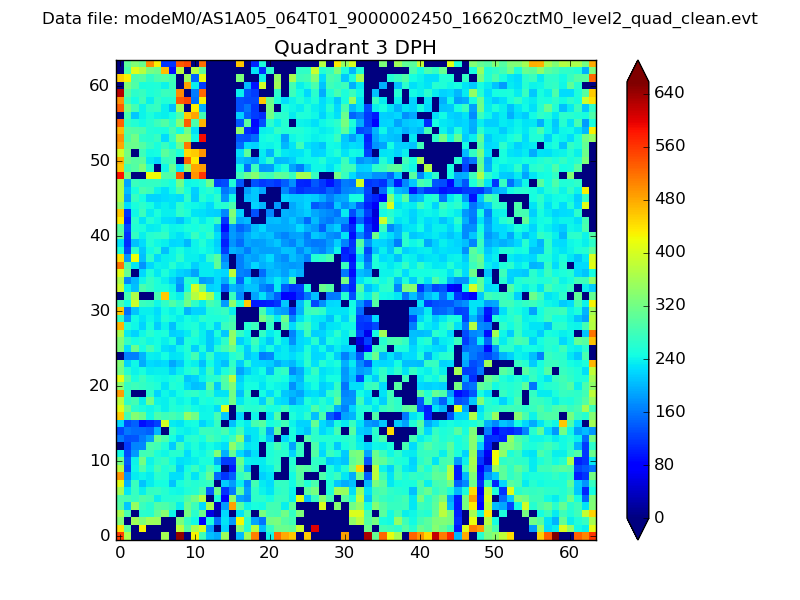 |
 |
Quadrant C |
| Plot type | Count rate plots | Images |
|---|---|---|
| Comparison with Poisson distribution Blue bars denote a histogram of data divided into 1 sec bins. Red curve is a Poisson curve with rate = median count rate of data. |
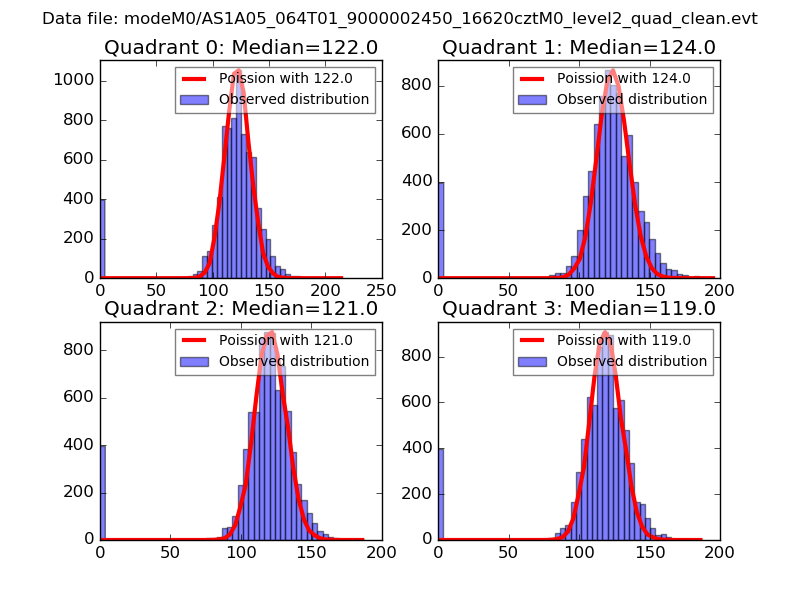 |
 |
| Quadrant-wise count rates Data is divided into 100 sec bins |
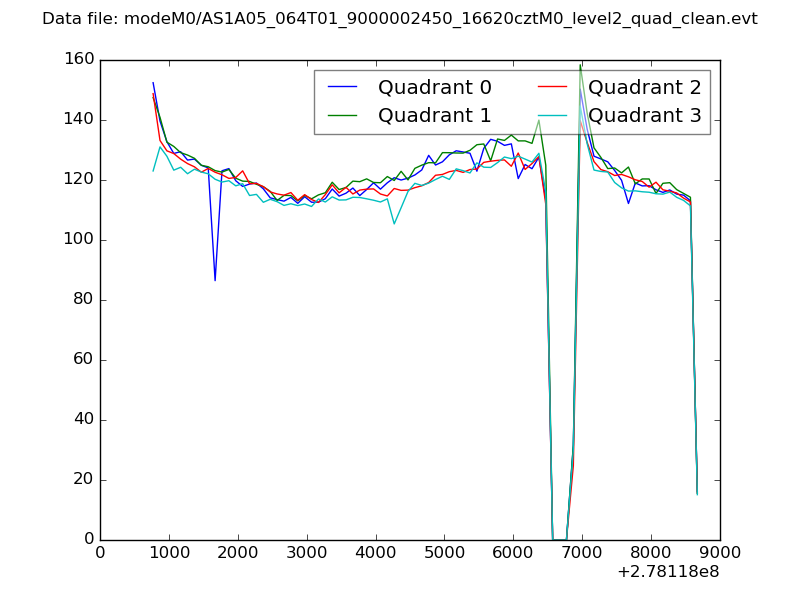 |
|
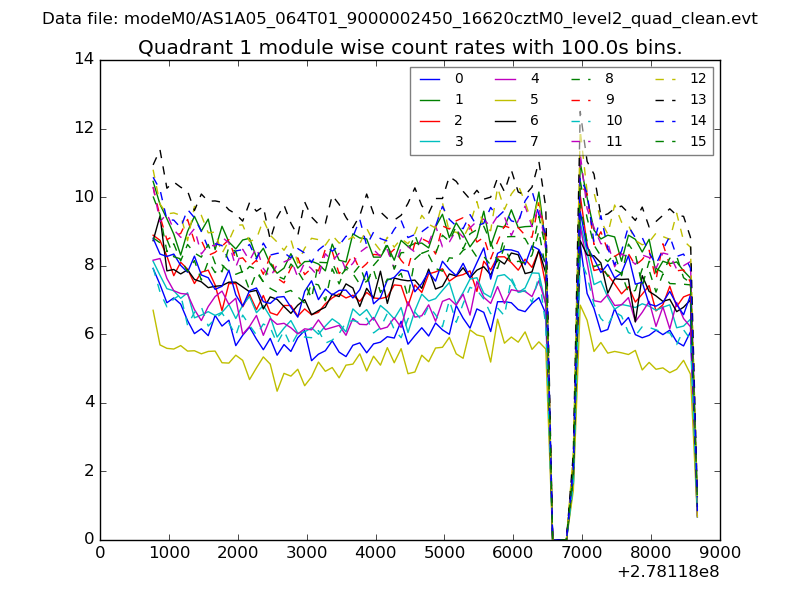
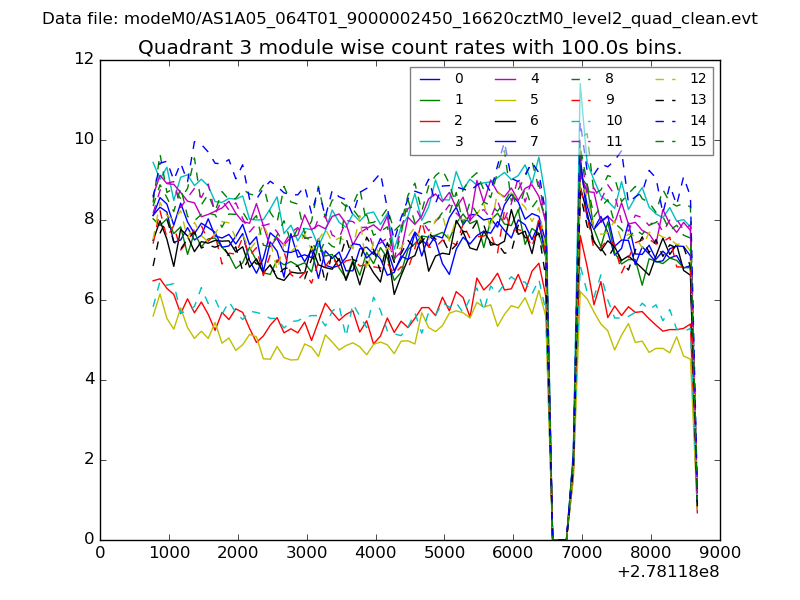
| Module-wise count rates for Quadrant A Data is divided into 100 sec bins |
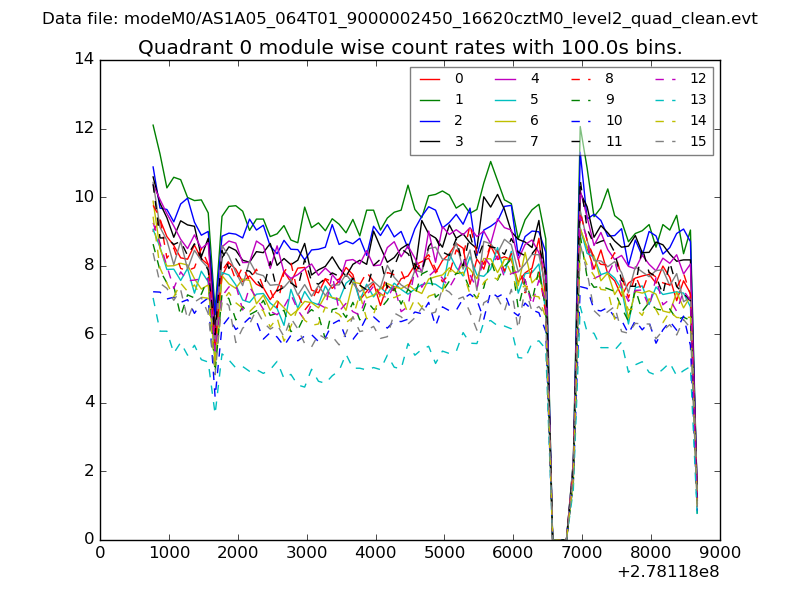 |
 |
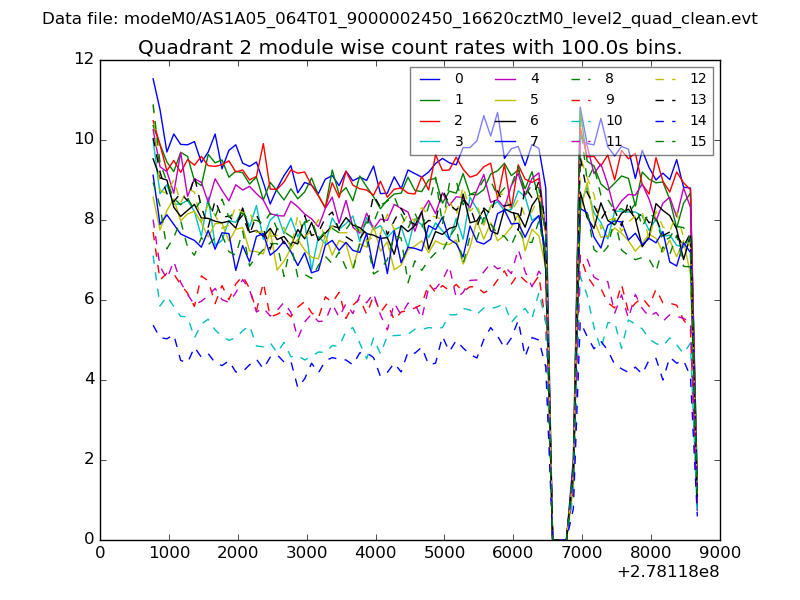
| Module-wise count rates for Quadrant B Data is divided into 100 sec bins |
 |
 |
| Module-wise count rates for Quadrant C Data is divided into 100 sec bins |
 |
 |
| Module-wise count rates for Quadrant D Data is divided into 100 sec bins |
 |
 |
| Parameter | Plot |
|---|---|
| CZT HV Monitor | 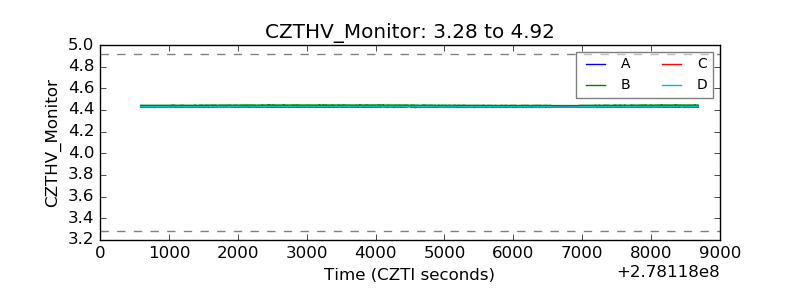 |
| D_VDD | 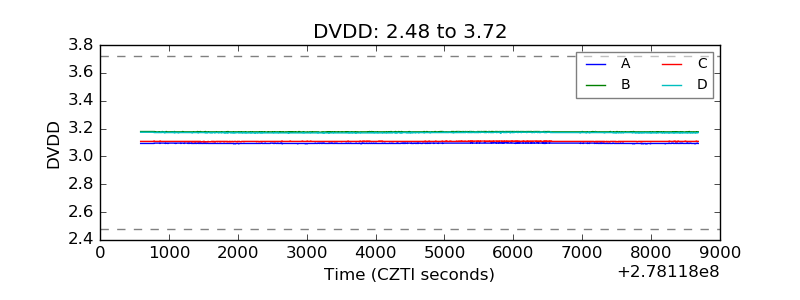 |
| Temperature 1 | 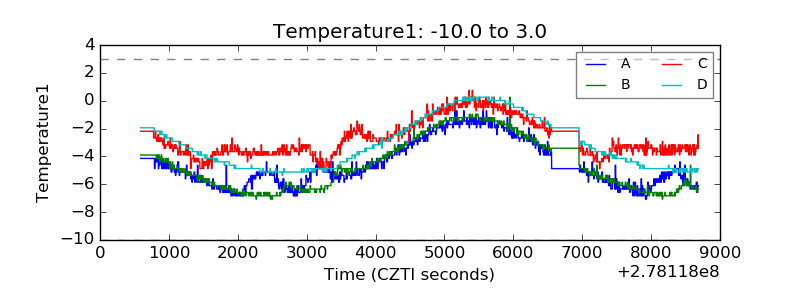 |
| Veto HV Monitor | 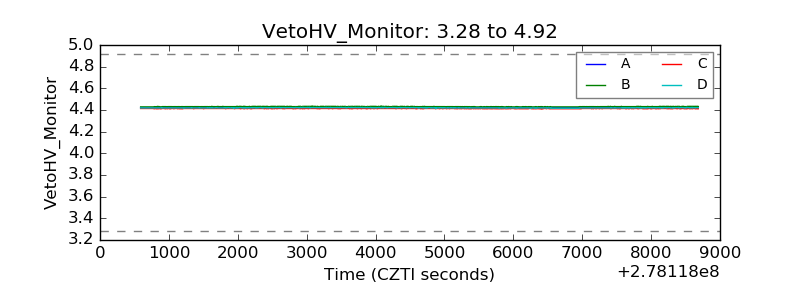 |
| Veto LLD |  |
| Alpha Counter | 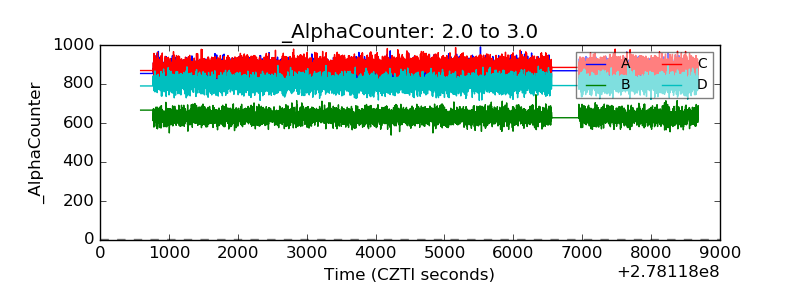 |
| _CPM_Rate | 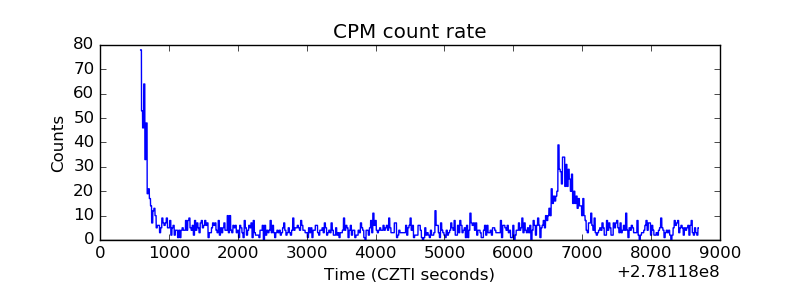 |
| CZT Counter | 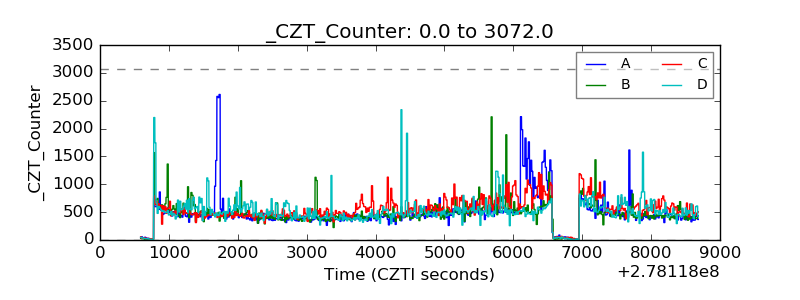 |
| +2.5 Volts monitor |  |
| +5 Volts monitor |  |
| _ROLL_ROT | 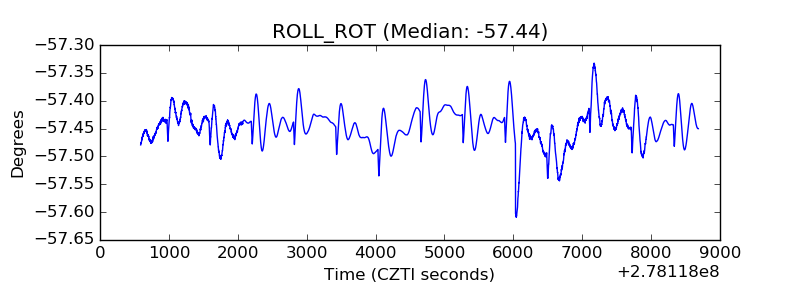 |
| _Roll_DEC | 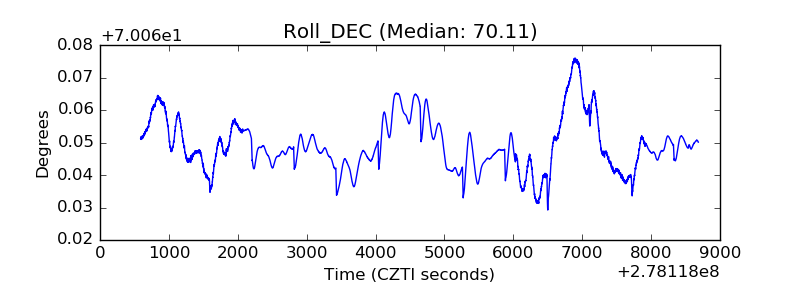 |
| _Roll_RA | 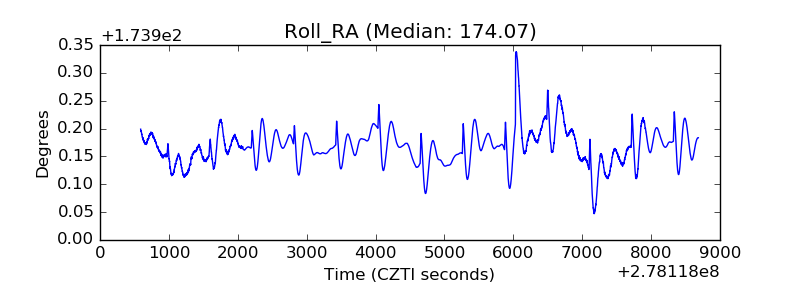 |
| Veto Counter | 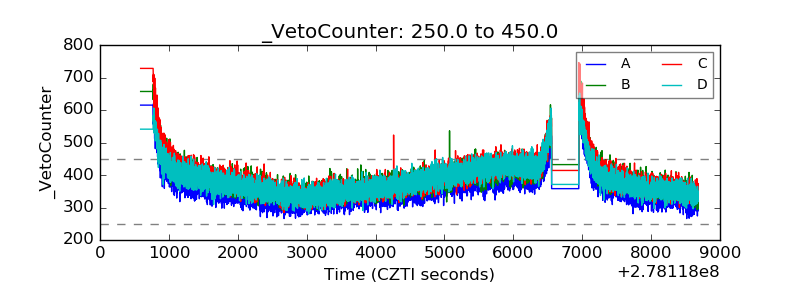 |