| Param | Original file | Final file |
|---|---|---|
| Filename | modeM0/AS1A05_064T01_9000002450_16621cztM0_level2.evt | modeM0/AS1A05_064T01_9000002450_16621cztM0_level2_quad_clean.evt |
| Size (bytes) | 604,627,200 | 145,051,200 |
| Size | 576.6 MB | 138.3 MB |
| Events in quadrant A | 4,710,795 | 951,587 |
| Events in quadrant B | 4,027,750 | 991,159 |
| Events in quadrant C | 4,457,049 | 956,352 |
| Events in quadrant D | 4,575,766 | 940,596 |
| Mode M0 | |||
|---|---|---|---|
| Quadrant | BADHDUFLAG | Total packets | Discarded packets |
| A | 0 | 19891 | 3 |
| B | 0 | 17428 | 2 |
| C | 0 | 18615 | 2 |
| D | 0 | 19150 | 2 |
| Mode SS | |||
|---|---|---|---|
| Quadrant | BADHDUFLAG | Total packets | Discarded packets |
| A | 0 | 164 | 0 |
| B | 0 | 164 | 0 |
| C | 0 | 164 | 0 |
| D | 0 | 164 | 0 |
| Mode M9 | |||
|---|---|---|---|
| Quadrant | BADHDUFLAG | Total packets | Discarded packets |
| A | 0 | 5 | 0 |
| B | 0 | 5 | 0 |
| C | 0 | 5 | 0 |
| D | 0 | 5 | 0 |
| Quadrant | Total seconds | Saturated seconds | Saturation percentage |
|---|---|---|---|
| A | 7960 | 434 | 5.452261% |
| B | 7960 | 189 | 2.374372% |
| C | 7960 | 242 | 3.040201% |
| D | 7960 | 77 | 0.967337% |
Noise dominated data is calculated using 1-second bins in cleaned event files. If a bin has >2000 counts, and if more than 50% of those come from <1% of pixels, then it is considered to be noise-dominated and hence unusable.
| Quadrant | # 1 sec bins | Bins with >0 counts | Bins with >2000 counts | High rate bins dominated by noise | Noise dominated (total time) | Noise dominated (detector-on time) | Marked lightcurve |
|---|---|---|---|---|---|---|---|
| A | 8431 | 7963 | 235 | 235 | 2.79% | 2.95% | 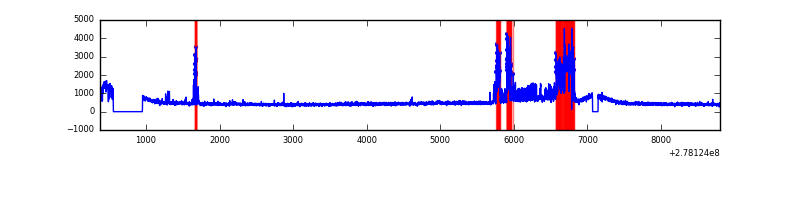 |
| B | 8431 | 7963 | 5 | 5 | 0.06% | 0.06% | 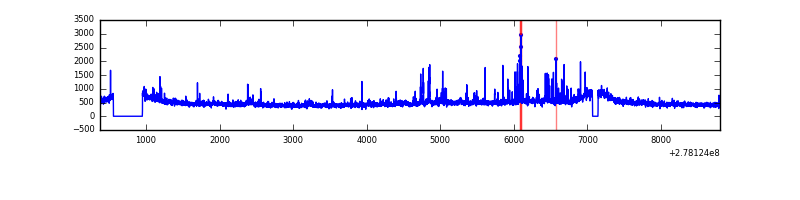 |
| C | 8431 | 7963 | 0 | 0 | 0.00% | 0.00% | 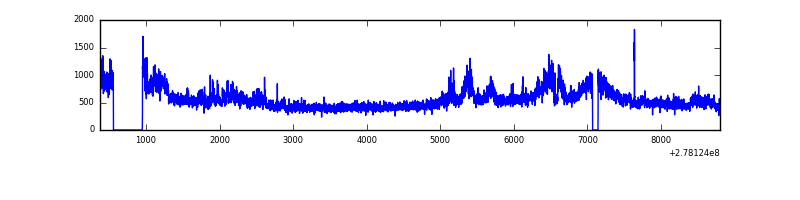 |
| D | 8431 | 7963 | 21 | 21 | 0.25% | 0.26% | 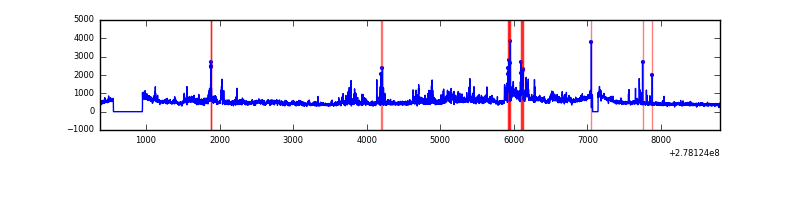 |
Top three noisy pixels from each quadrant. If the there are fewer than three noisy pixels in the level2.evt file, extra rows are filled as -1
| Pixel properties | Quadrant properties | ||||||
|---|---|---|---|---|---|---|---|
| Quadrant | DetID | PixID | Counts | Sigma | Mean | Median | Sigma |
| A | 15 | 174 | 1089761 | 5825.12 | 921 | 898 | 186.9 |
| A | 13 | 248 | 62114 | 327.49 | 921 | 898 | 186.9 |
| A | 3 | 1 | 11089 | 54.52 | 921 | 898 | 186.9 |
| B | 7 | 220 | 61724 | 334.87 | 948 | 922 | 181.6 |
| B | 15 | 35 | 57439 | 311.27 | 948 | 922 | 181.6 |
| B | 0 | 189 | 42288 | 227.83 | 948 | 922 | 181.6 |
| C | 3 | 233 | 664452 | 3129.97 | 907 | 914 | 212.0 |
| C | 14 | 238 | 138611 | 649.53 | 907 | 914 | 212.0 |
| C | 7 | 247 | 102457 | 478.99 | 907 | 914 | 212.0 |
| D | 1 | 52 | 817946 | 3638.24 | 918 | 888 | 224.6 |
| D | 7 | 38 | 160479 | 710.63 | 918 | 888 | 224.6 |
| D | 10 | 70 | 71822 | 315.86 | 918 | 888 | 224.6 |
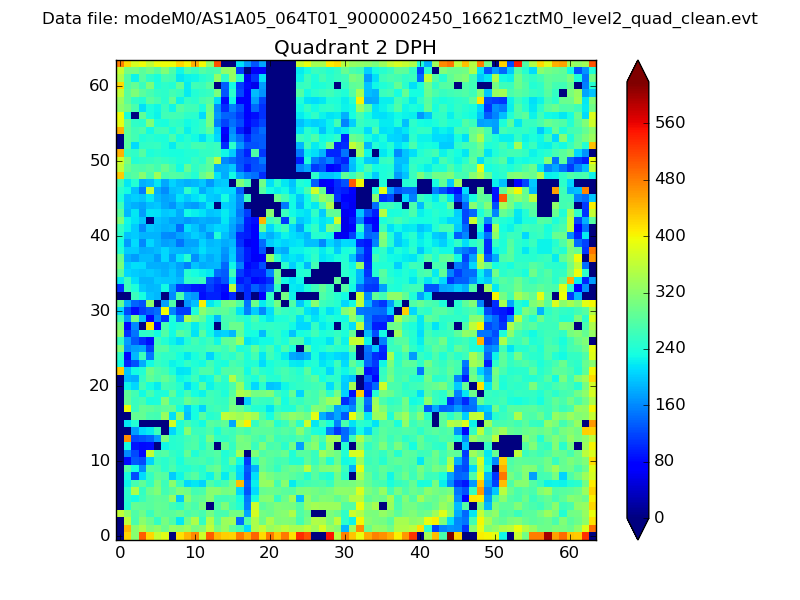
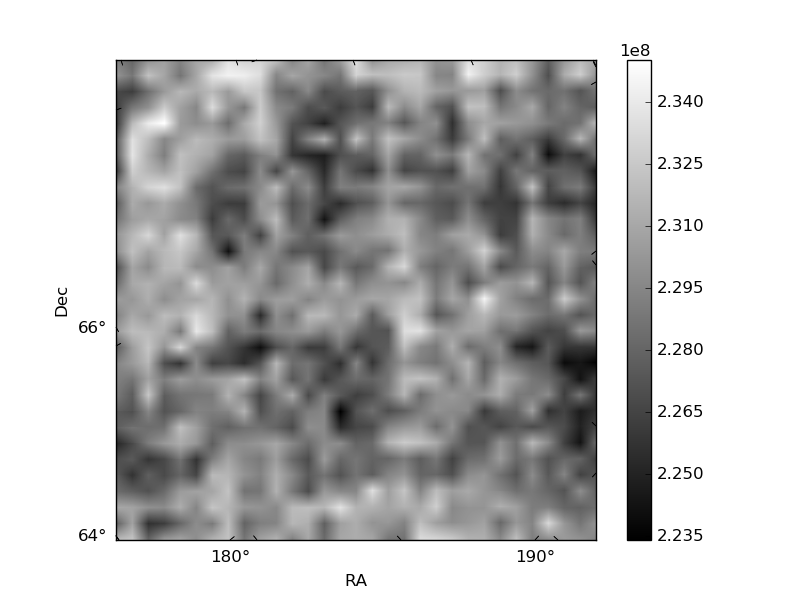
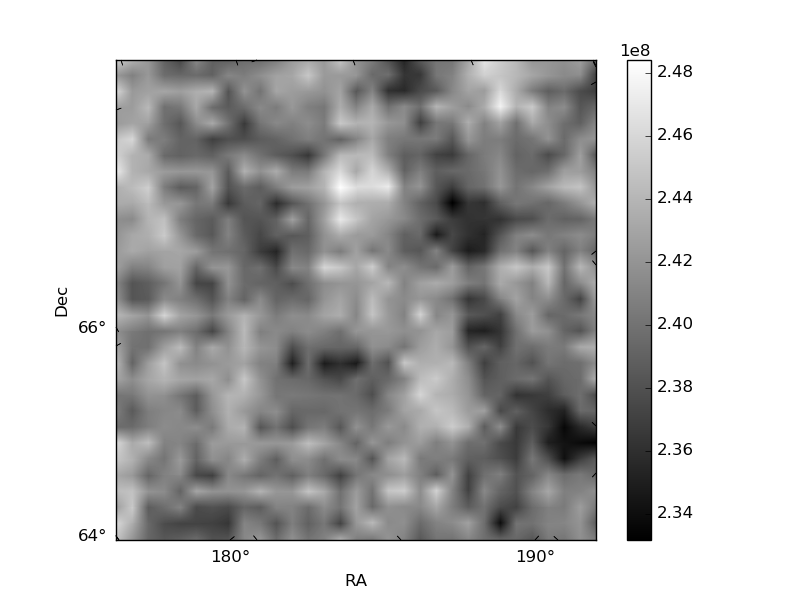
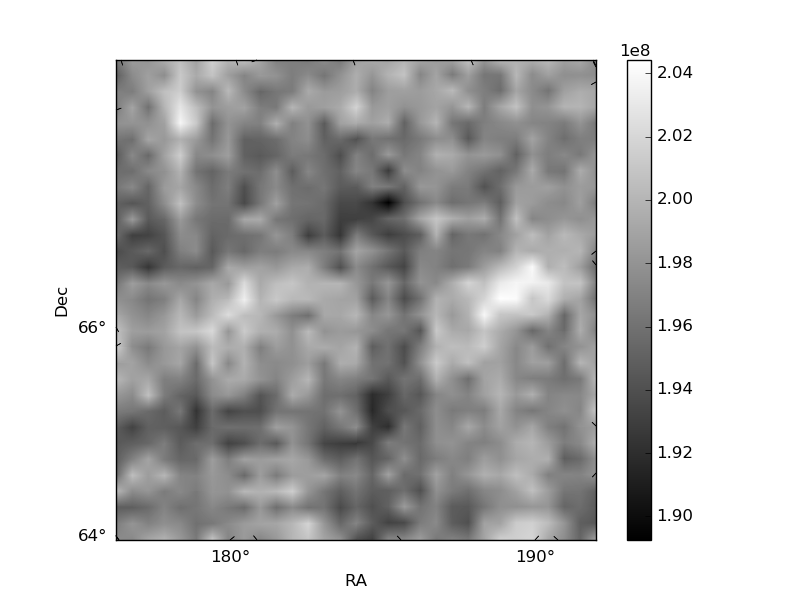
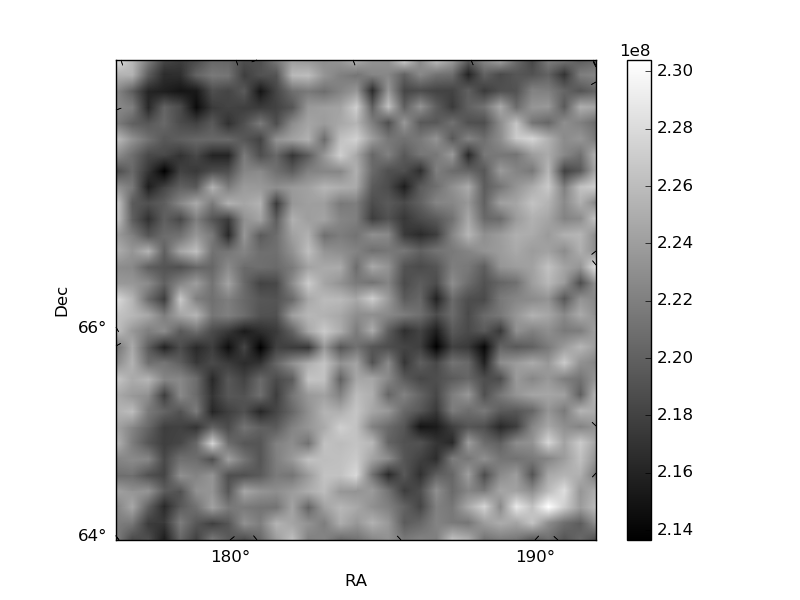
Histogram calculated using DETX and DETY for each event in the final _common_clean file
| Quadrant A | 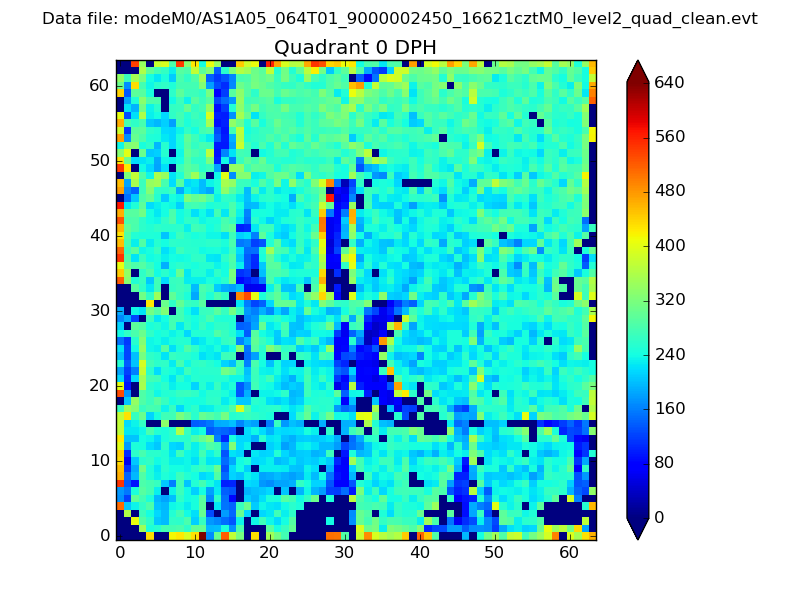 |
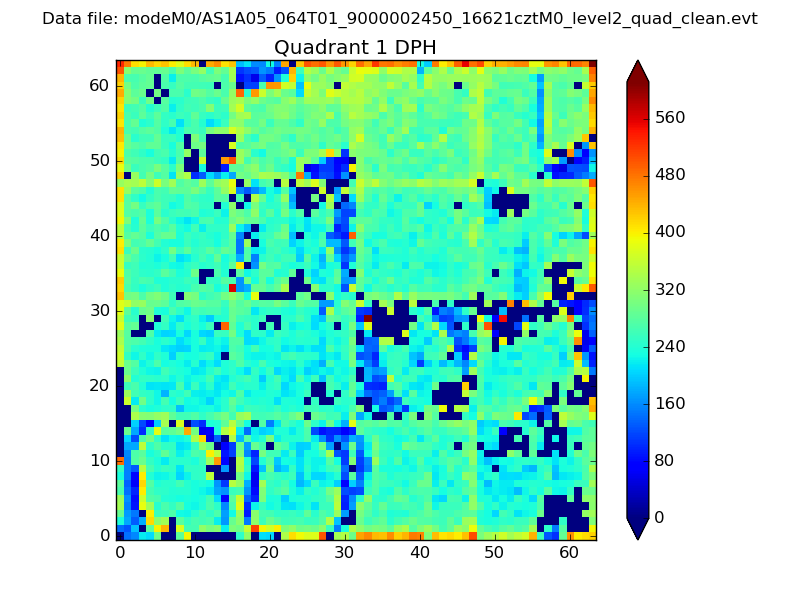 |
Quadrant B |
|---|---|---|---|
| Quadrant D | 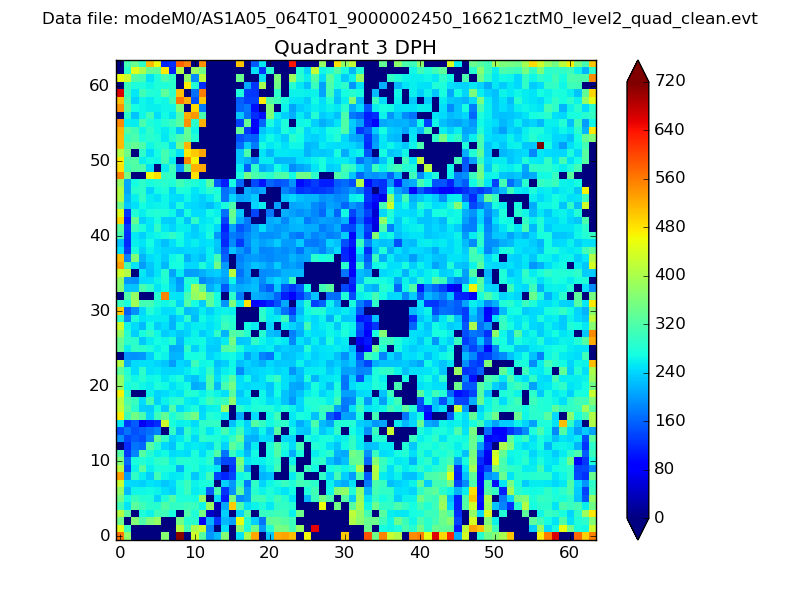 |
 |
Quadrant C |
| Plot type | Count rate plots | Images |
|---|---|---|
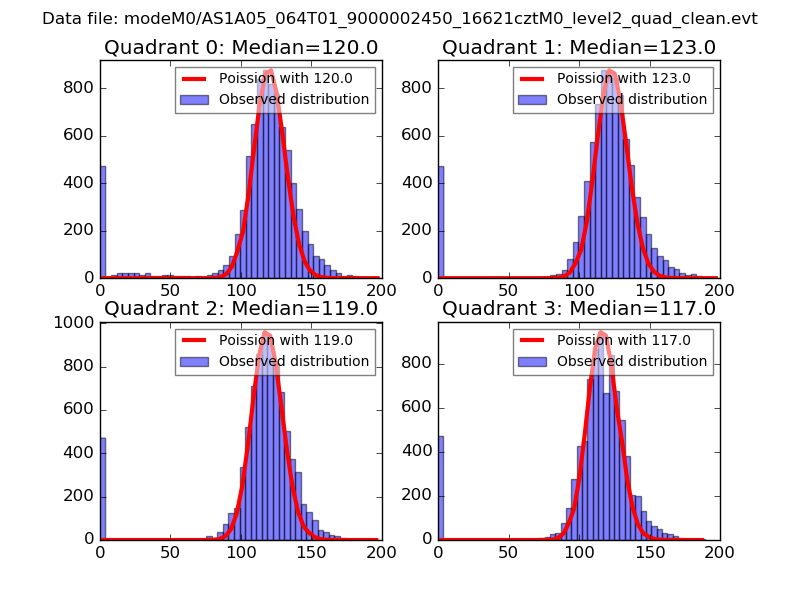
| Comparison with Poisson distribution Blue bars denote a histogram of data divided into 1 sec bins. Red curve is a Poisson curve with rate = median count rate of data. |
 |
 |
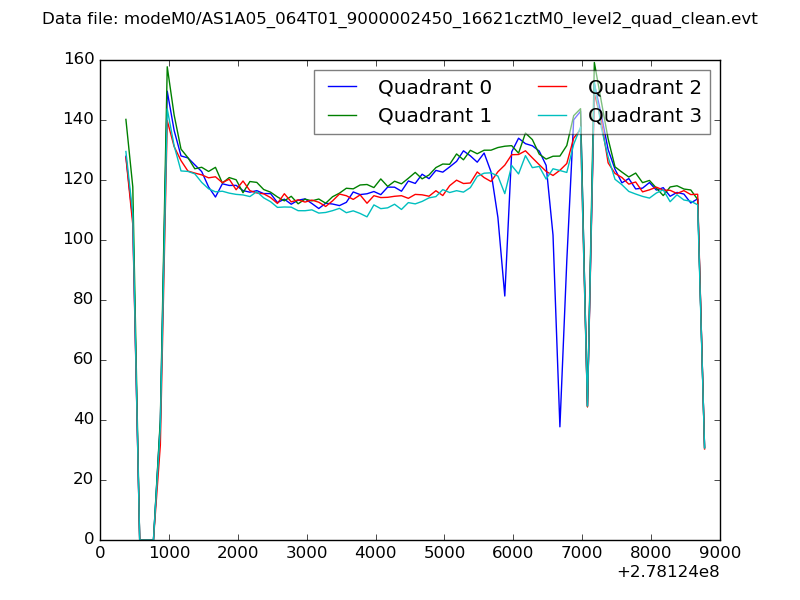
| Quadrant-wise count rates Data is divided into 100 sec bins |
 |
|
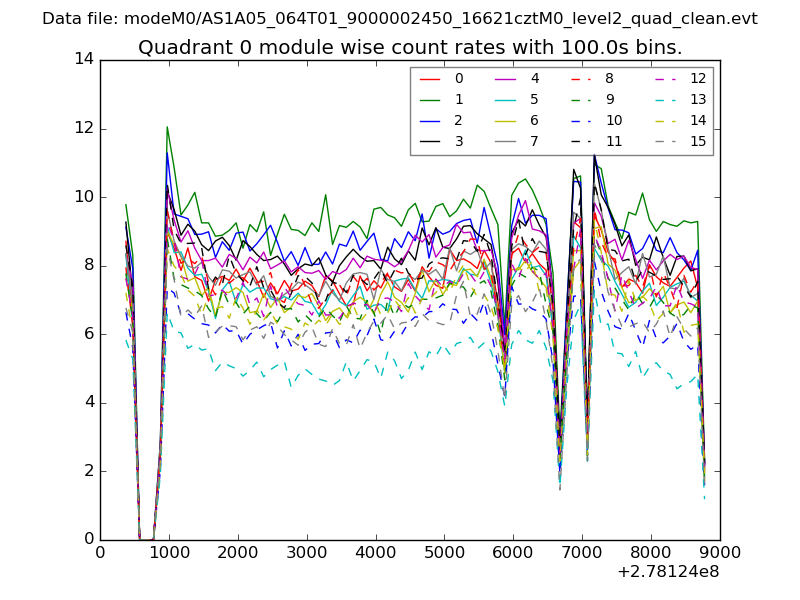
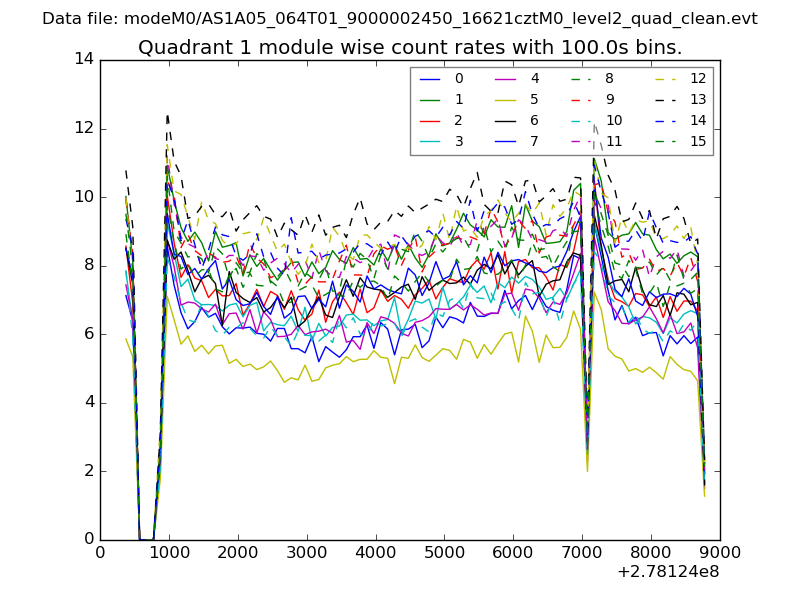
| Module-wise count rates for Quadrant A Data is divided into 100 sec bins |
 |
 |
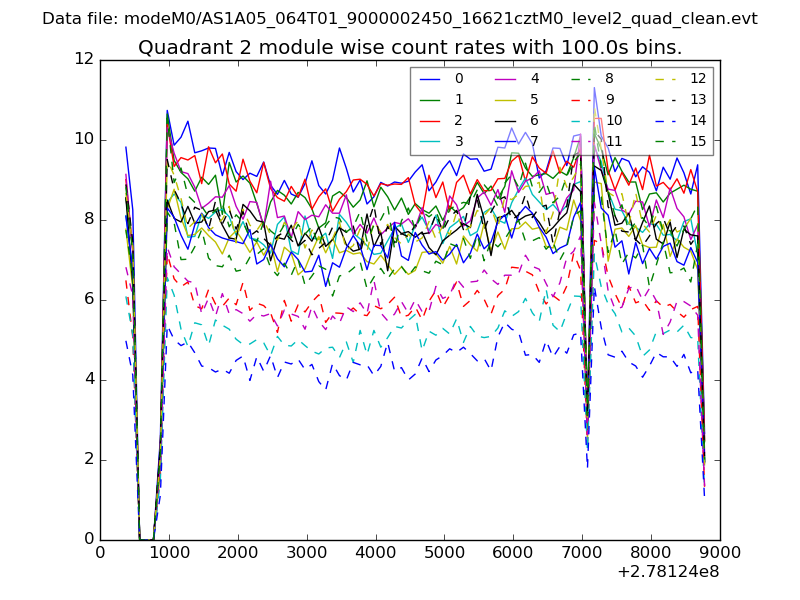
| Module-wise count rates for Quadrant B Data is divided into 100 sec bins |
 |
 |
| Module-wise count rates for Quadrant C Data is divided into 100 sec bins |
 |
 |
| Module-wise count rates for Quadrant D Data is divided into 100 sec bins |
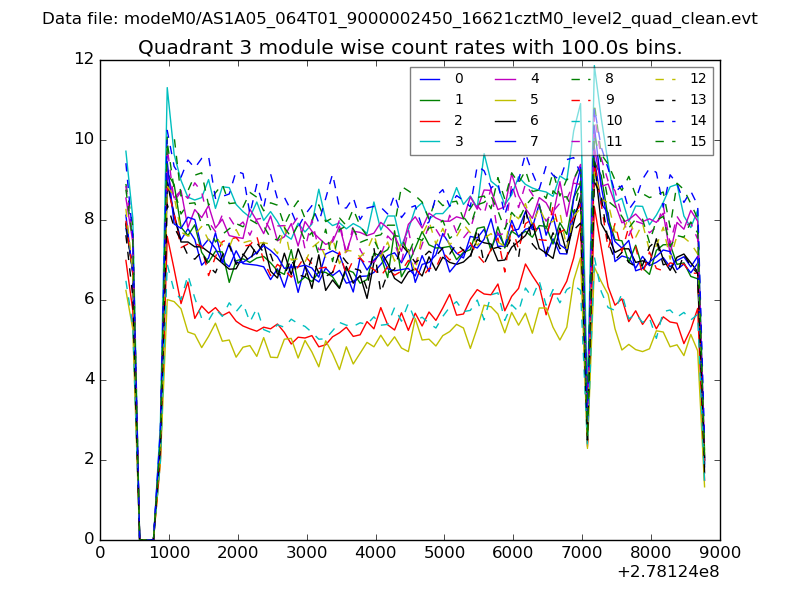 |
 |
| Parameter | Plot |
|---|---|
| CZT HV Monitor | 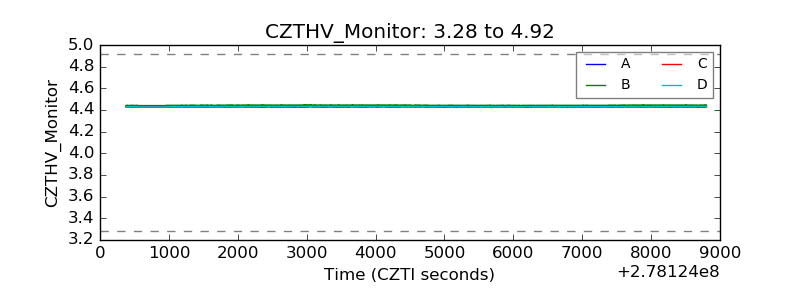 |
| D_VDD | 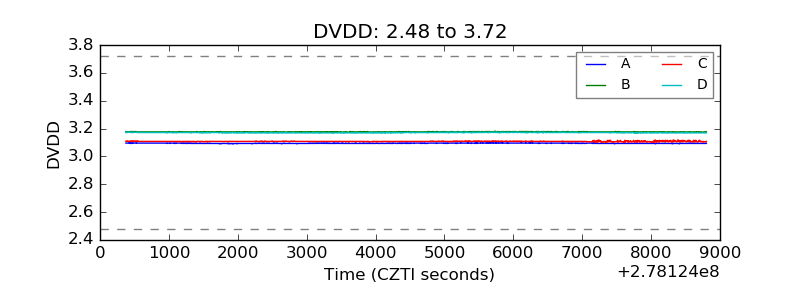 |
| Temperature 1 | 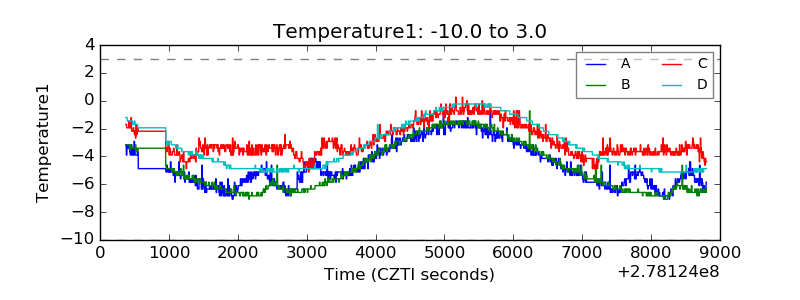 |
| Veto HV Monitor | 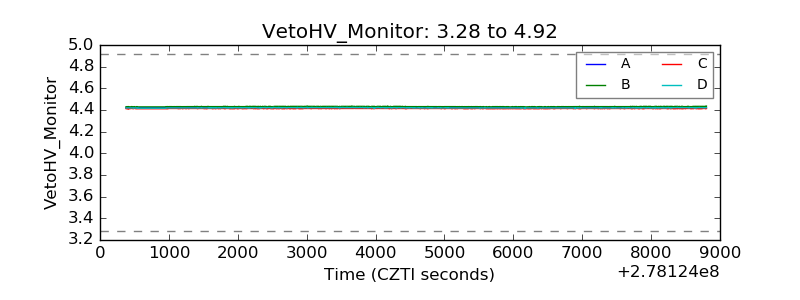 |
| Veto LLD | 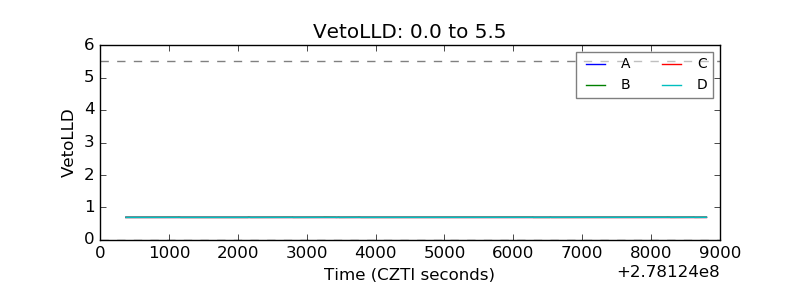 |
| Alpha Counter | 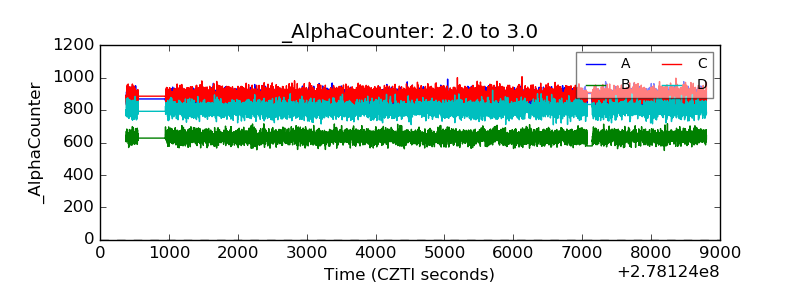 |
| _CPM_Rate | 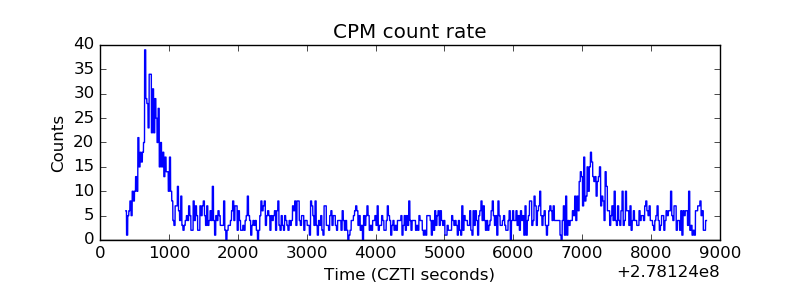 |
| CZT Counter | 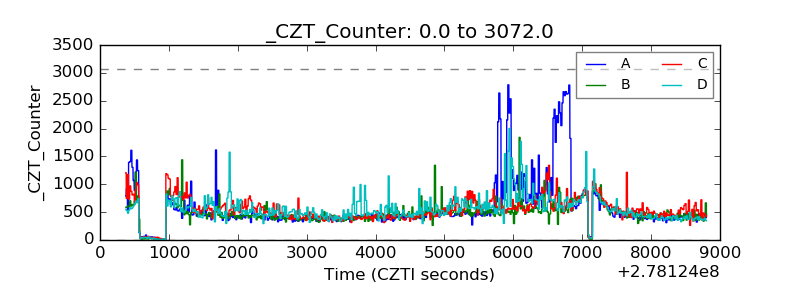 |
| +2.5 Volts monitor | 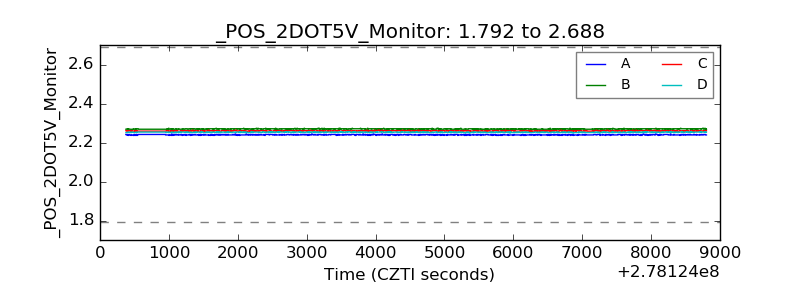 |
| +5 Volts monitor |  |
| _ROLL_ROT | 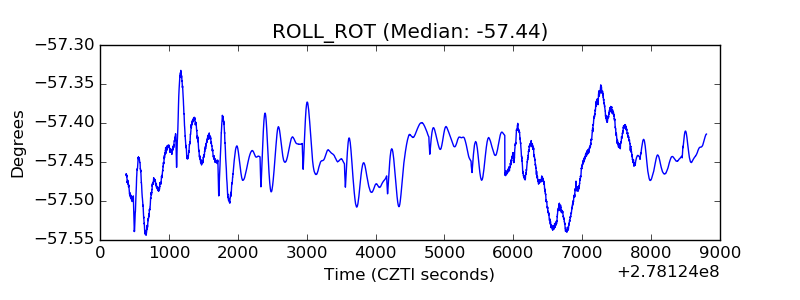 |
| _Roll_DEC | 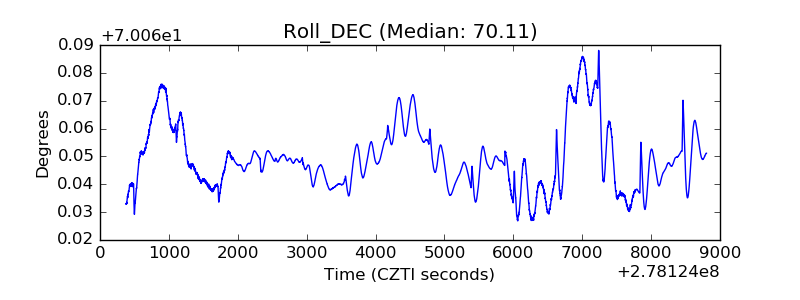 |
| _Roll_RA | 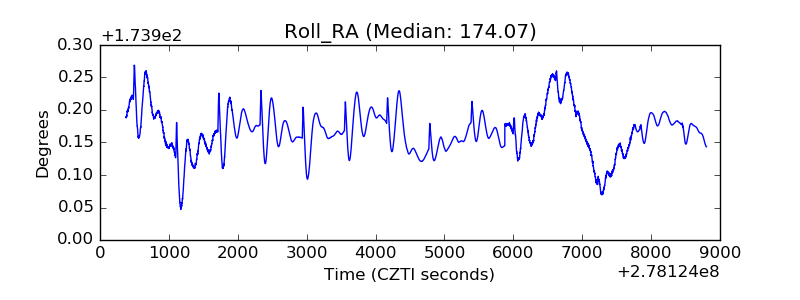 |
| Veto Counter | 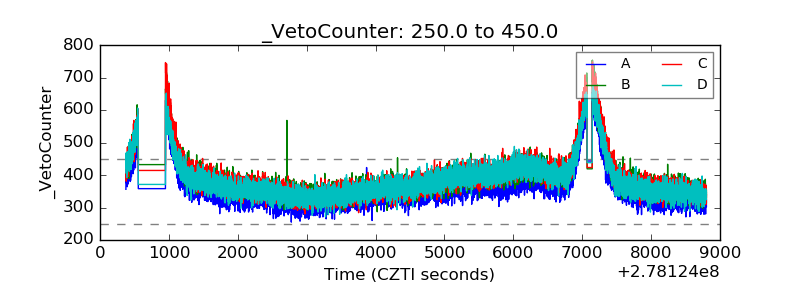 |