| Param | Original file | Final file |
|---|---|---|
| Filename | modeM0/AS1A05_064T01_9000002450_16622cztM0_level2.evt | modeM0/AS1A05_064T01_9000002450_16622cztM0_level2_quad_clean.evt |
| Size (bytes) | 535,541,760 | 124,513,920 |
| Size | 510.7 MB | 118.7 MB |
| Events in quadrant A | 3,140,609 | 840,970 |
| Events in quadrant B | 3,315,346 | 849,413 |
| Events in quadrant C | 3,915,474 | 820,552 |
| Events in quadrant D | 5,372,411 | 772,393 |
| Mode M0 | |||
|---|---|---|---|
| Quadrant | BADHDUFLAG | Total packets | Discarded packets |
| A | 0 | 14409 | 2 |
| B | 0 | 14651 | 1 |
| C | 0 | 16168 | 1 |
| D | 0 | 21098 | 1 |
| Mode SS | |||
|---|---|---|---|
| Quadrant | BADHDUFLAG | Total packets | Discarded packets |
| A | 0 | 142 | 0 |
| B | 0 | 142 | 0 |
| C | 0 | 142 | 0 |
| D | 0 | 142 | 0 |
| Mode M9 | |||
|---|---|---|---|
| Quadrant | BADHDUFLAG | Total packets | Discarded packets |
| A | 0 | 3 | 0 |
| B | 0 | 3 | 0 |
| C | 0 | 3 | 0 |
| D | 0 | 3 | 0 |
| Quadrant | Total seconds | Saturated seconds | Saturation percentage |
|---|---|---|---|
| A | 7001 | 61 | 0.871304% |
| B | 7001 | 76 | 1.085559% |
| C | 7001 | 122 | 1.742608% |
| D | 7001 | 648 | 9.255821% |
Noise dominated data is calculated using 1-second bins in cleaned event files. If a bin has >2000 counts, and if more than 50% of those come from <1% of pixels, then it is considered to be noise-dominated and hence unusable.
| Quadrant | # 1 sec bins | Bins with >0 counts | Bins with >2000 counts | High rate bins dominated by noise | Noise dominated (total time) | Noise dominated (detector-on time) | Marked lightcurve |
|---|---|---|---|---|---|---|---|
| A | 7337 | 7004 | 11 | 11 | 0.15% | 0.16% | 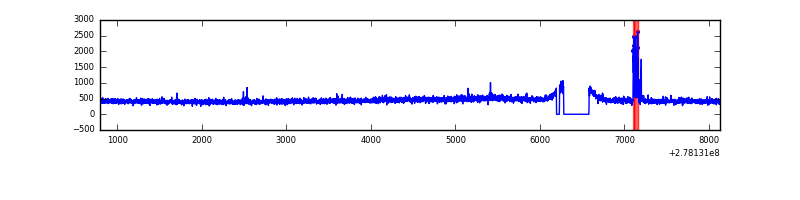 |
| B | 7337 | 7004 | 2 | 2 | 0.03% | 0.03% | 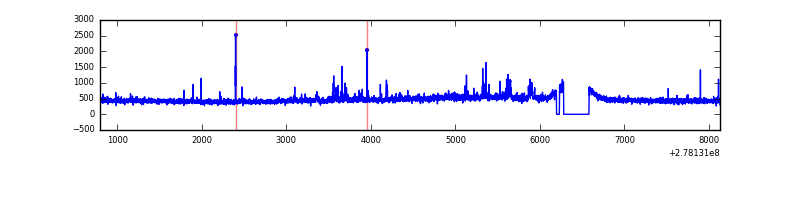 |
| C | 7337 | 7004 | 3 | 3 | 0.04% | 0.04% | 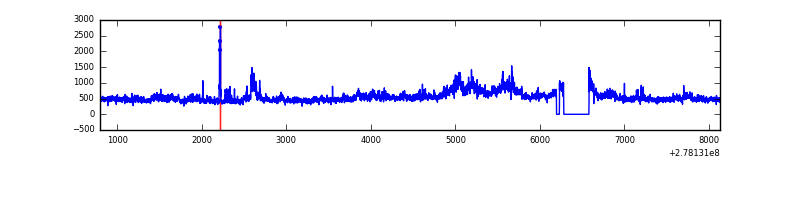 |
| D | 7337 | 7004 | 557 | 557 | 7.59% | 7.95% | 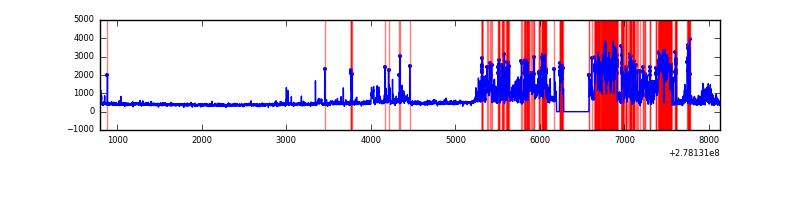 |
Top three noisy pixels from each quadrant. If the there are fewer than three noisy pixels in the level2.evt file, extra rows are filled as -1
| Pixel properties | Quadrant properties | ||||||
|---|---|---|---|---|---|---|---|
| Quadrant | DetID | PixID | Counts | Sigma | Mean | Median | Sigma |
| A | 9 | 143 | 73621 | 452.07 | 795 | 778 | 161.1 |
| A | 0 | 226 | 6964 | 38.39 | 795 | 778 | 161.1 |
| A | 12 | 194 | 5937 | 32.02 | 795 | 778 | 161.1 |
| B | 15 | 35 | 56778 | 364.51 | 799 | 778 | 153.6 |
| B | 3 | 209 | 33882 | 215.48 | 799 | 778 | 153.6 |
| B | 0 | 198 | 23798 | 149.84 | 799 | 778 | 153.6 |
| C | 3 | 233 | 631908 | 3526.69 | 765 | 768 | 179.0 |
| C | 7 | 247 | 160361 | 891.78 | 765 | 768 | 179.0 |
| C | 14 | 238 | 117671 | 653.23 | 765 | 768 | 179.0 |
| D | 1 | 52 | 2390532 | 13209.68 | 744 | 723 | 180.9 |
| D | 10 | 70 | 114467 | 628.72 | 744 | 723 | 180.9 |
| D | 2 | 234 | 27653 | 148.86 | 744 | 723 | 180.9 |
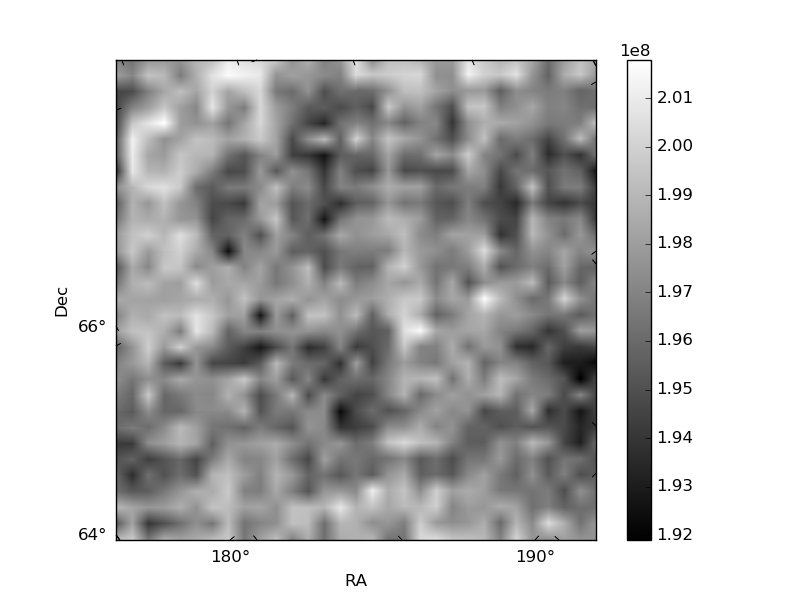
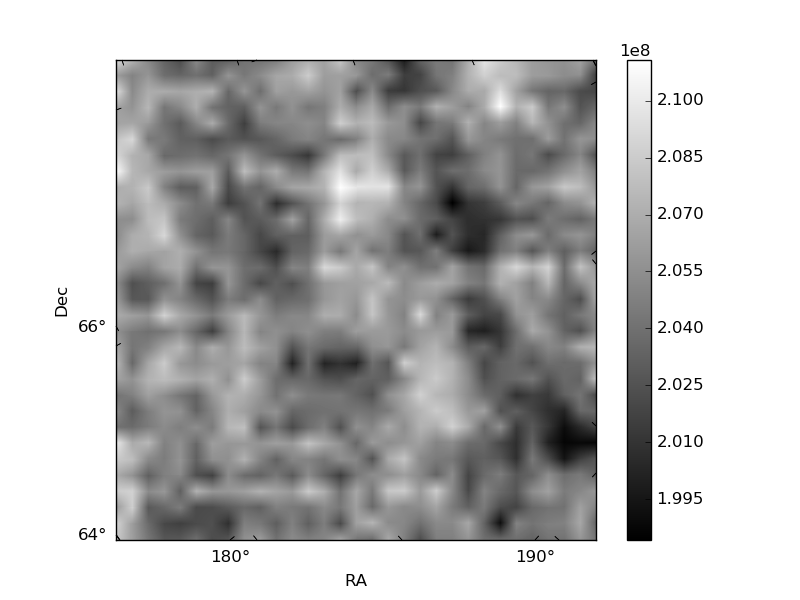
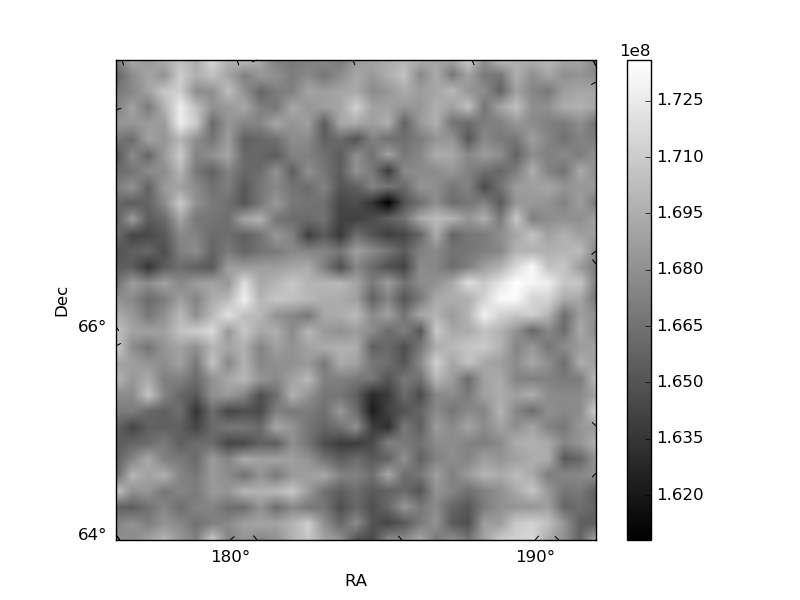
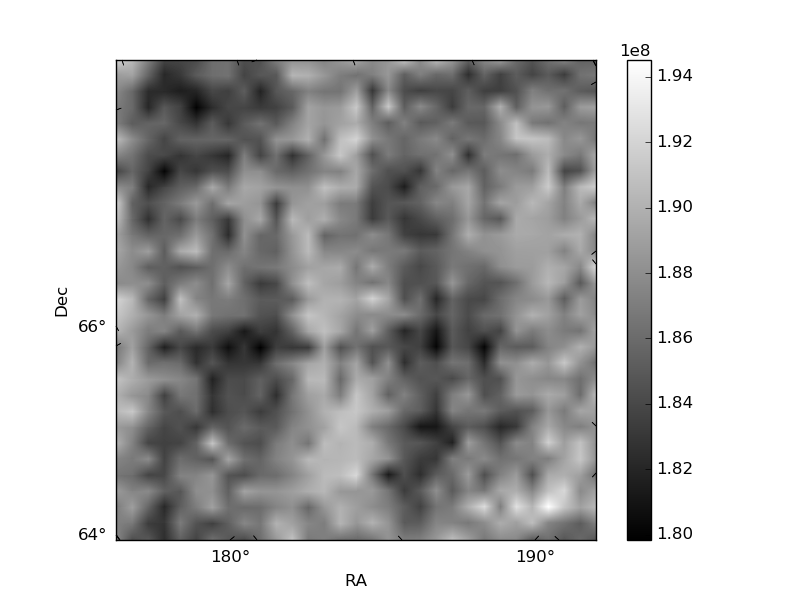
Histogram calculated using DETX and DETY for each event in the final _common_clean file
| Quadrant A | 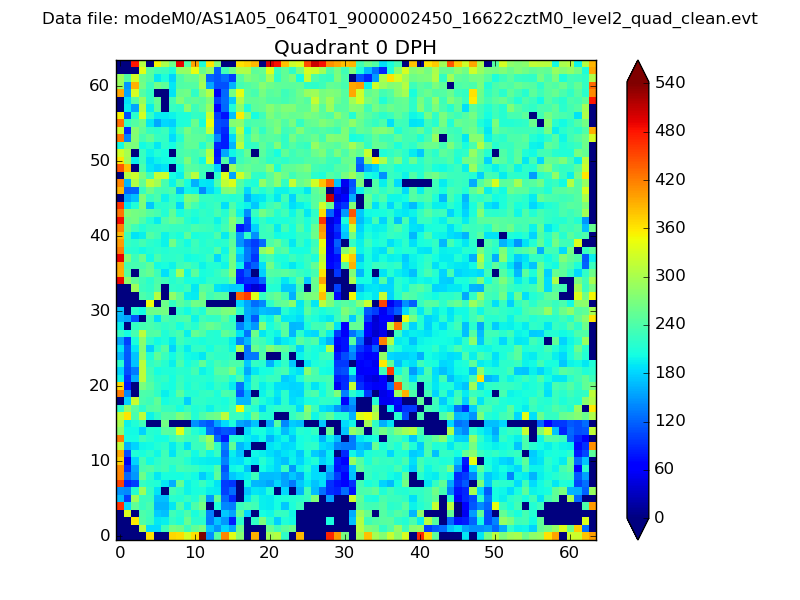 |
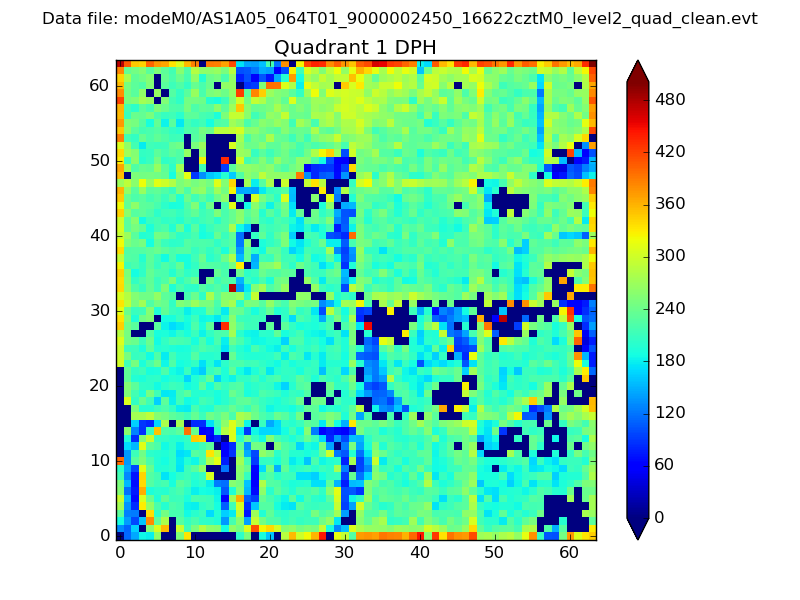 |
Quadrant B |
|---|---|---|---|
| Quadrant D | 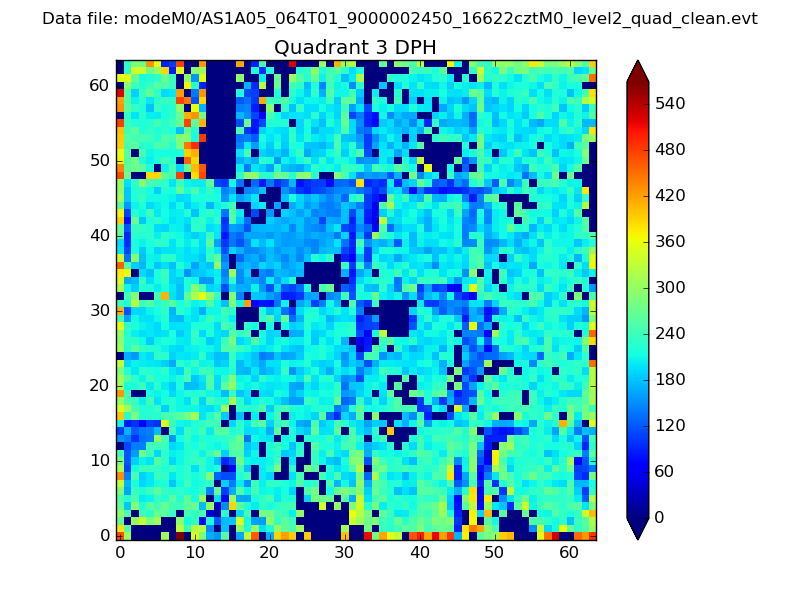 |
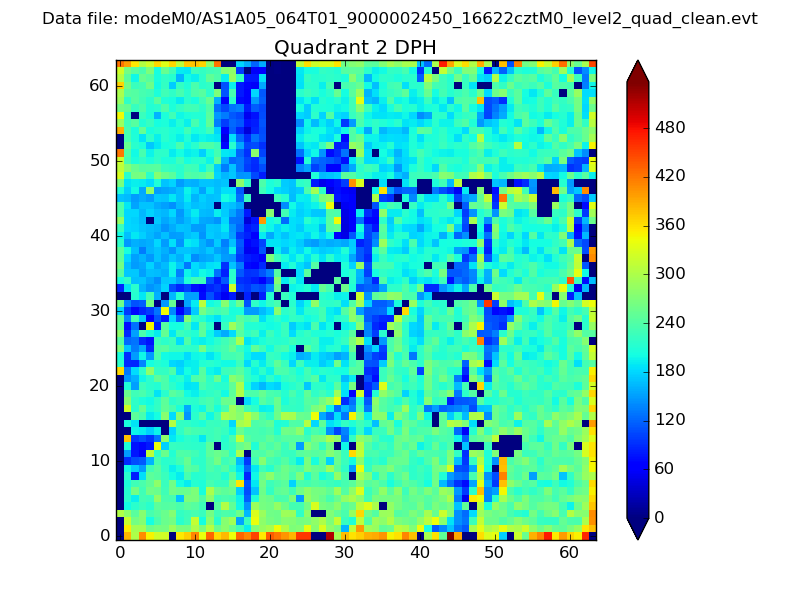 |
Quadrant C |
| Plot type | Count rate plots | Images |
|---|---|---|
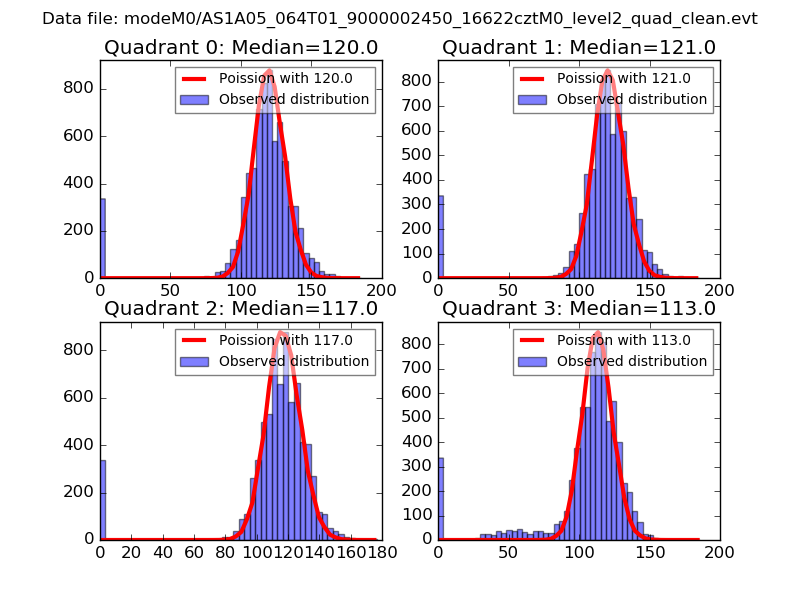
| Comparison with Poisson distribution Blue bars denote a histogram of data divided into 1 sec bins. Red curve is a Poisson curve with rate = median count rate of data. |
 |
 |
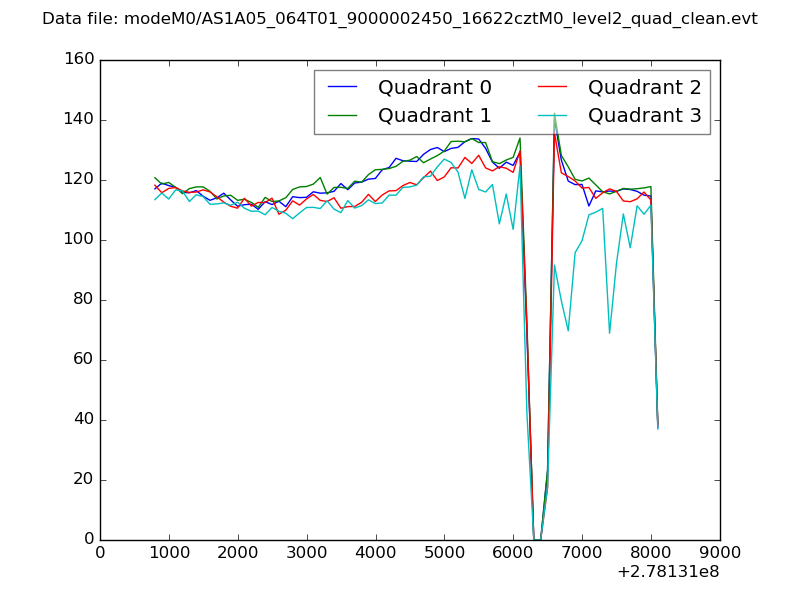
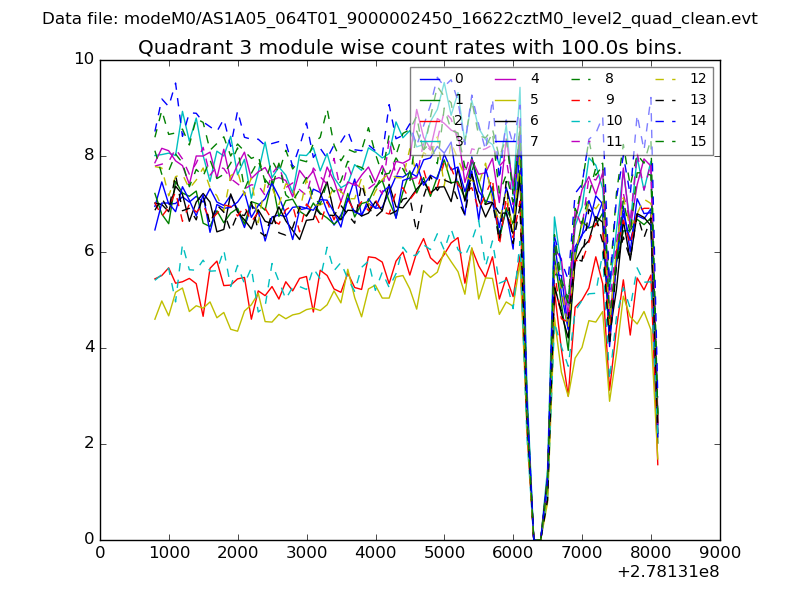
| Quadrant-wise count rates Data is divided into 100 sec bins |
 |
|
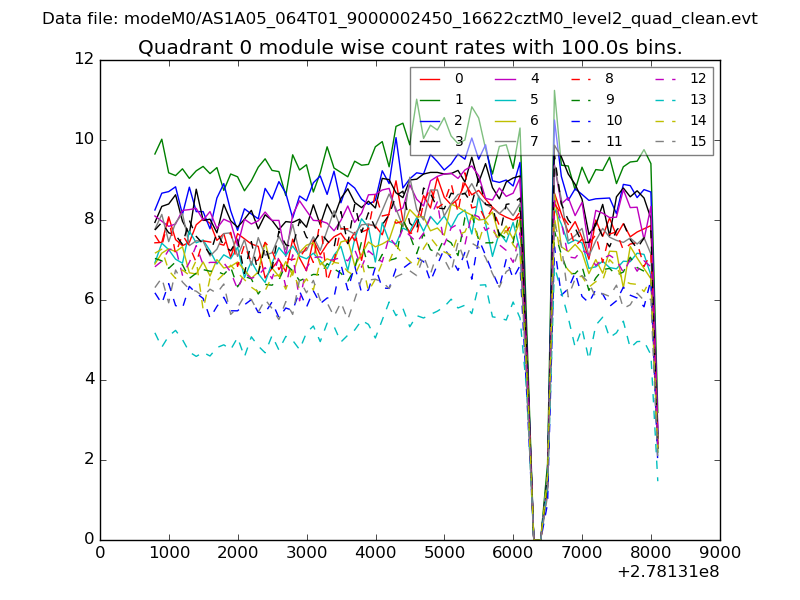
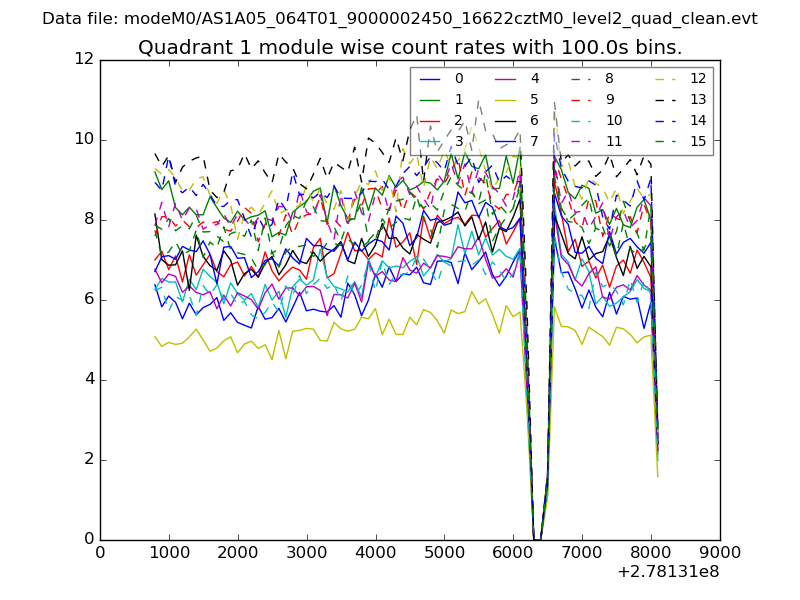
| Module-wise count rates for Quadrant A Data is divided into 100 sec bins |
 |
 |
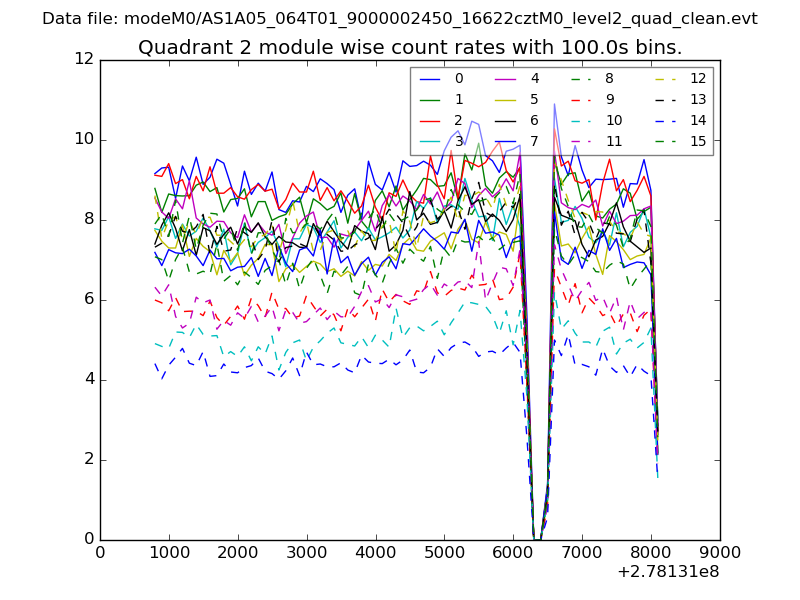
| Module-wise count rates for Quadrant B Data is divided into 100 sec bins |
 |
 |
| Module-wise count rates for Quadrant C Data is divided into 100 sec bins |
 |
 |
| Module-wise count rates for Quadrant D Data is divided into 100 sec bins |
 |
 |
| Parameter | Plot |
|---|---|
| CZT HV Monitor |  |
| D_VDD | 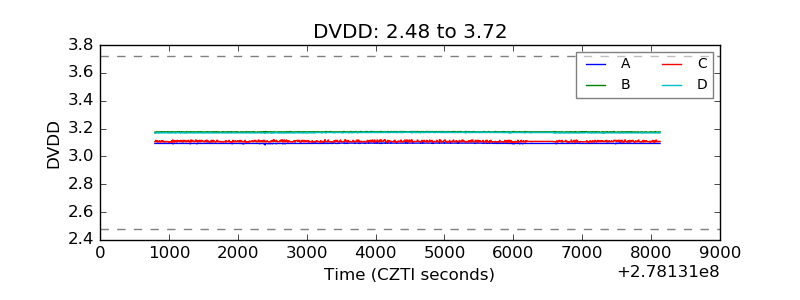 |
| Temperature 1 | 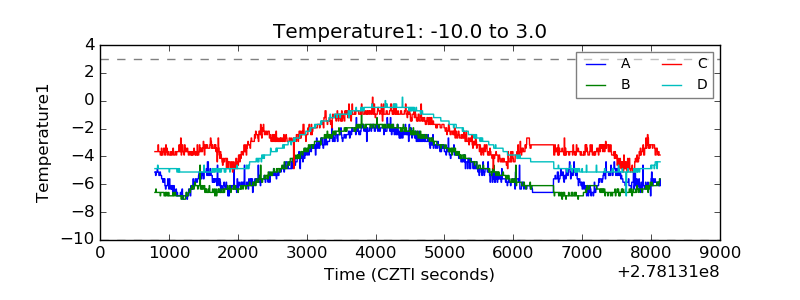 |
| Veto HV Monitor | 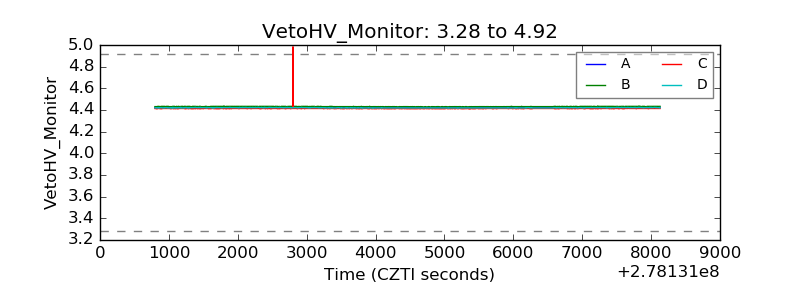 |
| Veto LLD |  |
| Alpha Counter | 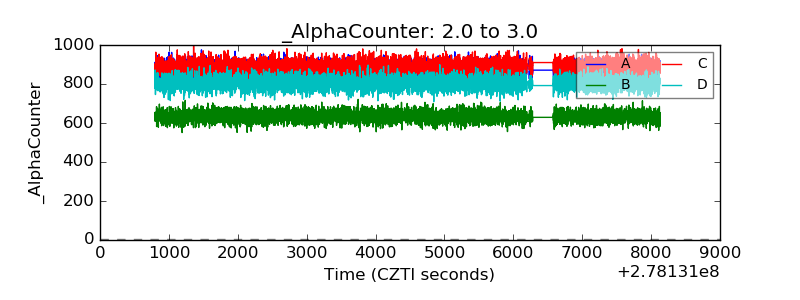 |
| _CPM_Rate | 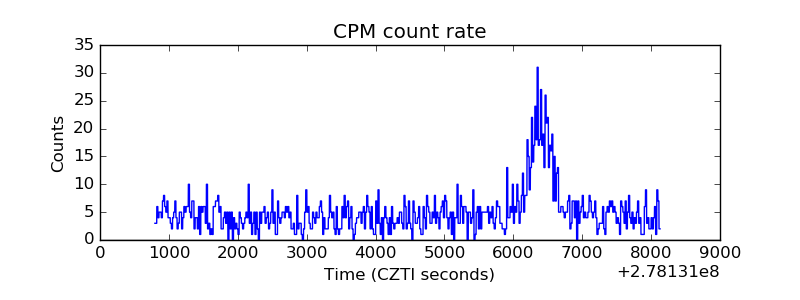 |
| CZT Counter | 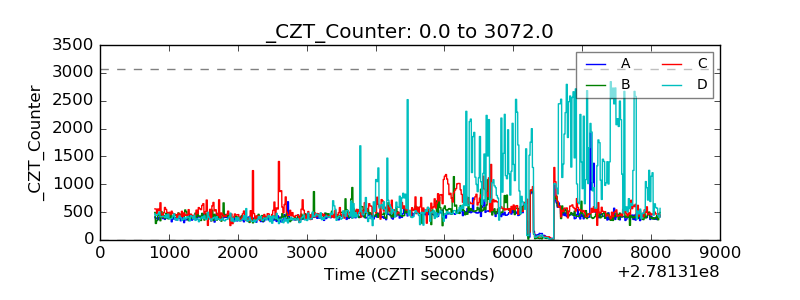 |
| +2.5 Volts monitor |  |
| +5 Volts monitor |  |
| _ROLL_ROT | 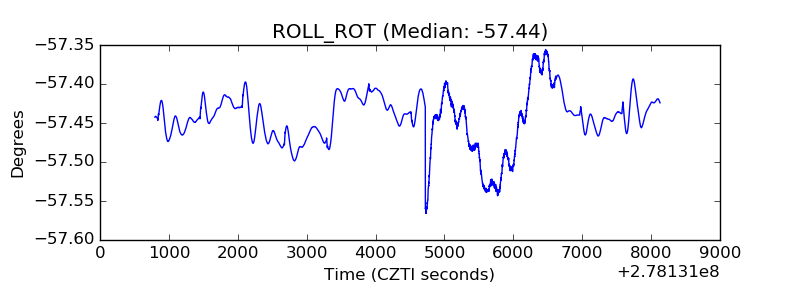 |
| _Roll_DEC | 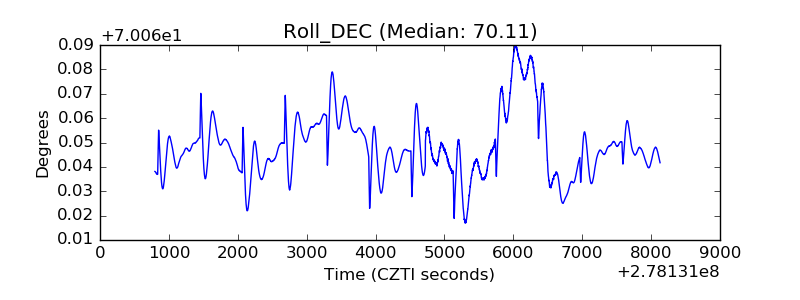 |
| _Roll_RA | 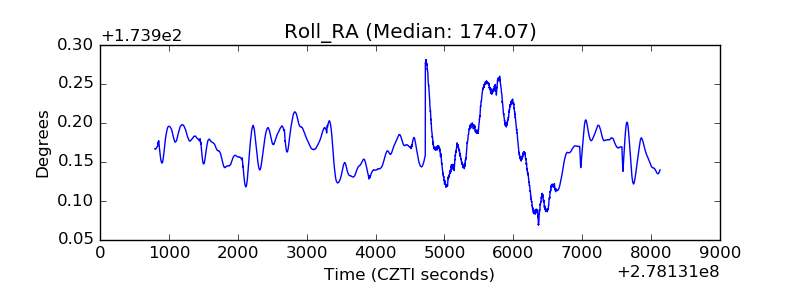 |
| Veto Counter | 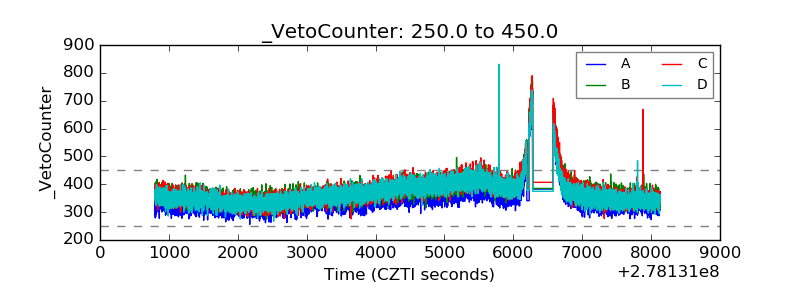 |