| Param | Original file | Final file |
|---|---|---|
| Filename | modeM0/AS1A05_064T01_9000002450_16624cztM0_level2.evt | modeM0/AS1A05_064T01_9000002450_16624cztM0_level2_quad_clean.evt |
| Size (bytes) | 678,447,360 | 148,377,600 |
| Size | 647.0 MB | 141.5 MB |
| Events in quadrant A | 3,793,443 | 1,001,865 |
| Events in quadrant B | 4,076,171 | 1,016,561 |
| Events in quadrant C | 4,481,053 | 976,393 |
| Events in quadrant D | 7,626,573 | 914,789 |
| Mode M0 | |||
|---|---|---|---|
| Quadrant | BADHDUFLAG | Total packets | Discarded packets |
| A | 0 | 17335 | 2 |
| B | 0 | 17744 | 1 |
| C | 0 | 18665 | 1 |
| D | 0 | 28517 | 1 |
| Mode SS | |||
|---|---|---|---|
| Quadrant | BADHDUFLAG | Total packets | Discarded packets |
| A | 0 | 170 | 0 |
| B | 0 | 170 | 0 |
| C | 0 | 170 | 0 |
| D | 0 | 170 | 0 |
| Mode M9 | |||
|---|---|---|---|
| Quadrant | BADHDUFLAG | Total packets | Discarded packets |
| A | 0 | 5 | 0 |
| B | 0 | 5 | 0 |
| C | 0 | 5 | 0 |
| D | 0 | 5 | 0 |
| Quadrant | Total seconds | Saturated seconds | Saturation percentage |
|---|---|---|---|
| A | 8414 | 72 | 0.855717% |
| B | 8414 | 65 | 0.772522% |
| C | 8414 | 106 | 1.259805% |
| D | 8414 | 809 | 9.614928% |
Noise dominated data is calculated using 1-second bins in cleaned event files. If a bin has >2000 counts, and if more than 50% of those come from <1% of pixels, then it is considered to be noise-dominated and hence unusable.
| Quadrant | # 1 sec bins | Bins with >0 counts | Bins with >2000 counts | High rate bins dominated by noise | Noise dominated (total time) | Noise dominated (detector-on time) | Marked lightcurve |
|---|---|---|---|---|---|---|---|
| A | 8890 | 8416 | 12 | 12 | 0.13% | 0.14% | 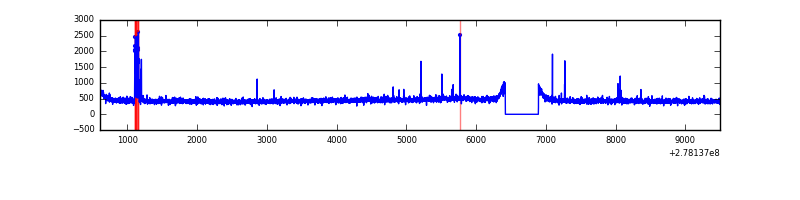 |
| B | 8890 | 8416 | 0 | 0 | 0.00% | 0.00% | 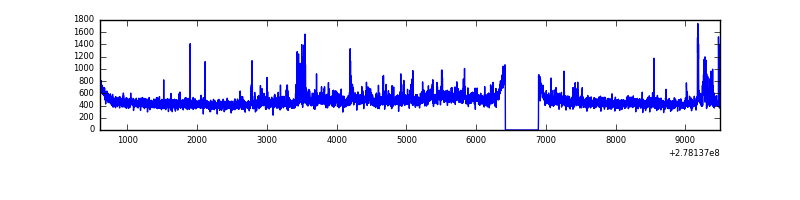 |
| C | 8890 | 8416 | 1 | 1 | 0.01% | 0.01% | 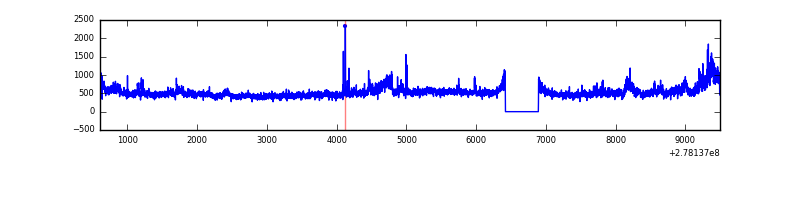 |
| D | 8890 | 8416 | 696 | 696 | 7.83% | 8.27% | 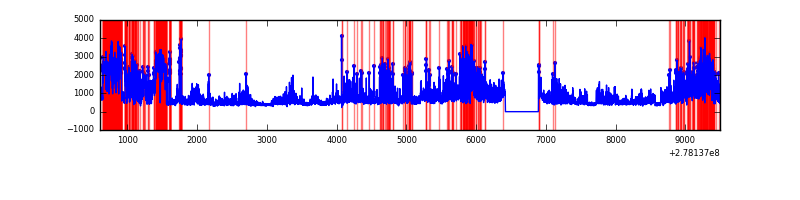 |
Top three noisy pixels from each quadrant. If the there are fewer than three noisy pixels in the level2.evt file, extra rows are filled as -1
| Pixel properties | Quadrant properties | ||||||
|---|---|---|---|---|---|---|---|
| Quadrant | DetID | PixID | Counts | Sigma | Mean | Median | Sigma |
| A | 9 | 143 | 94871 | 489.57 | 957 | 935 | 191.9 |
| A | 15 | 223 | 8782 | 40.89 | 957 | 935 | 191.9 |
| A | 0 | 226 | 8411 | 38.96 | 957 | 935 | 191.9 |
| B | 15 | 35 | 91195 | 495.29 | 957 | 933 | 182.2 |
| B | 3 | 209 | 63292 | 342.18 | 957 | 933 | 182.2 |
| B | 0 | 198 | 48457 | 260.78 | 957 | 933 | 182.2 |
| C | 3 | 233 | 717399 | 3368.23 | 914 | 920 | 212.7 |
| C | 14 | 238 | 142915 | 667.53 | 914 | 920 | 212.7 |
| C | 0 | 207 | 18922 | 84.63 | 914 | 920 | 212.7 |
| D | 1 | 52 | 4082689 | 18607.05 | 896 | 866 | 219.4 |
| D | 10 | 70 | 129038 | 584.27 | 896 | 866 | 219.4 |
| D | 2 | 234 | 35816 | 159.32 | 896 | 866 | 219.4 |
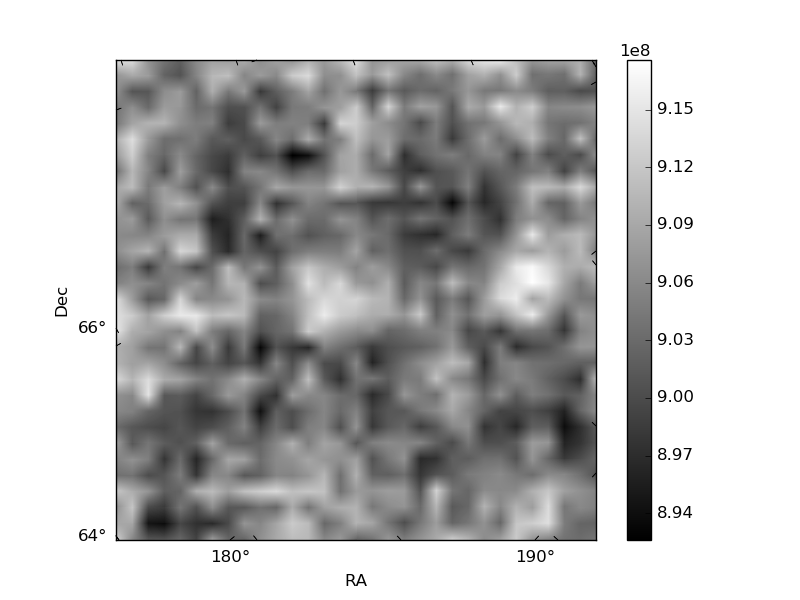
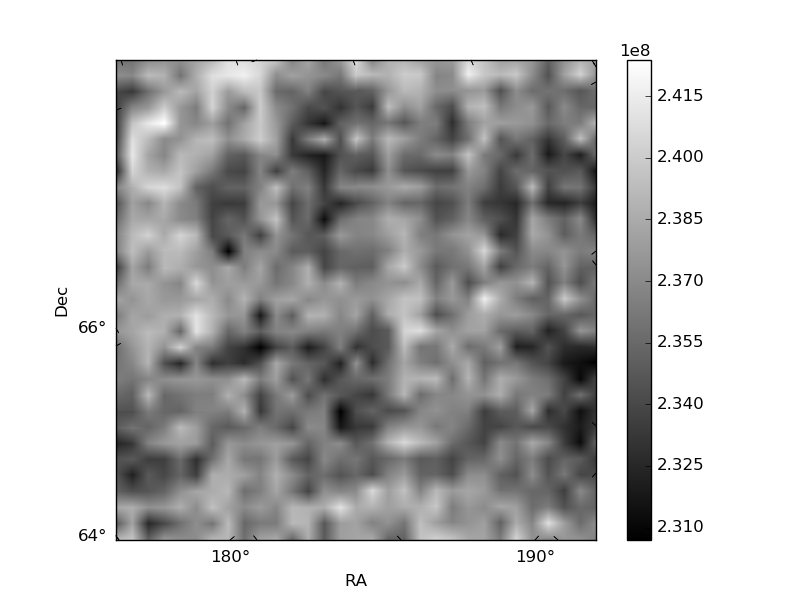
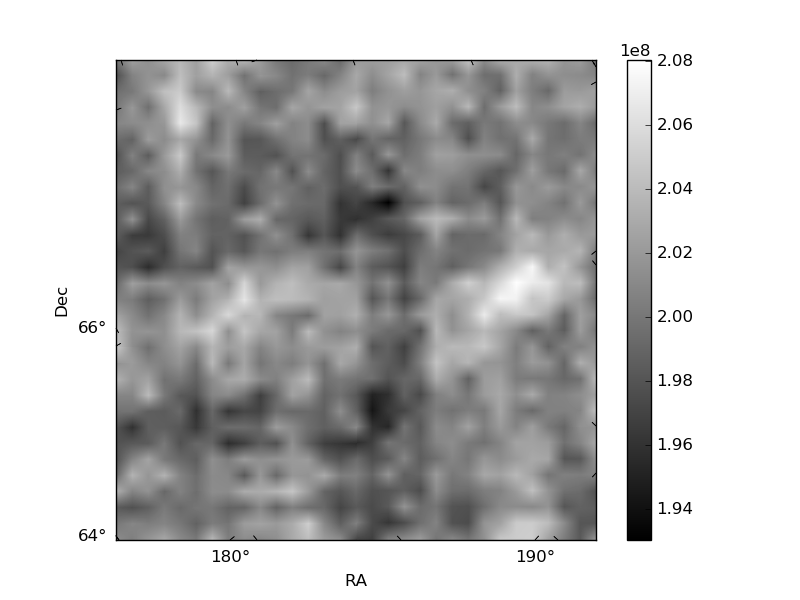
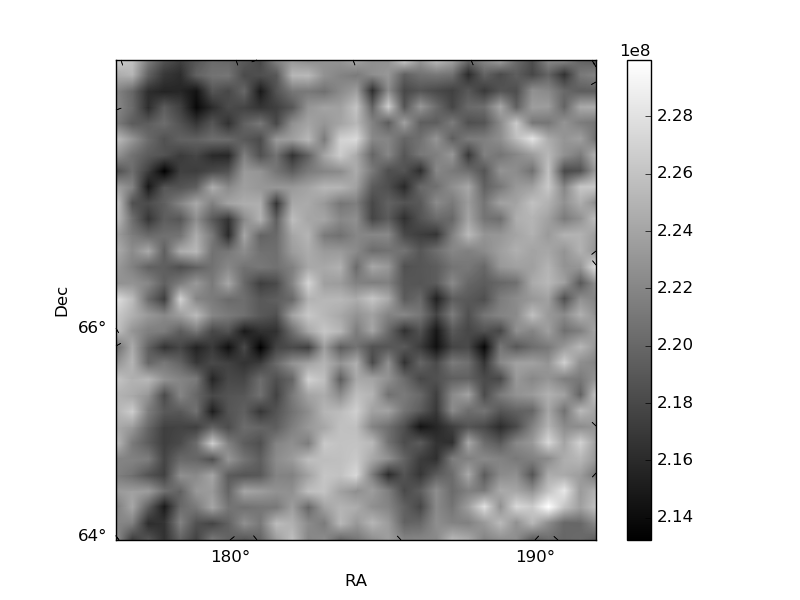
Histogram calculated using DETX and DETY for each event in the final _common_clean file
| Quadrant A | 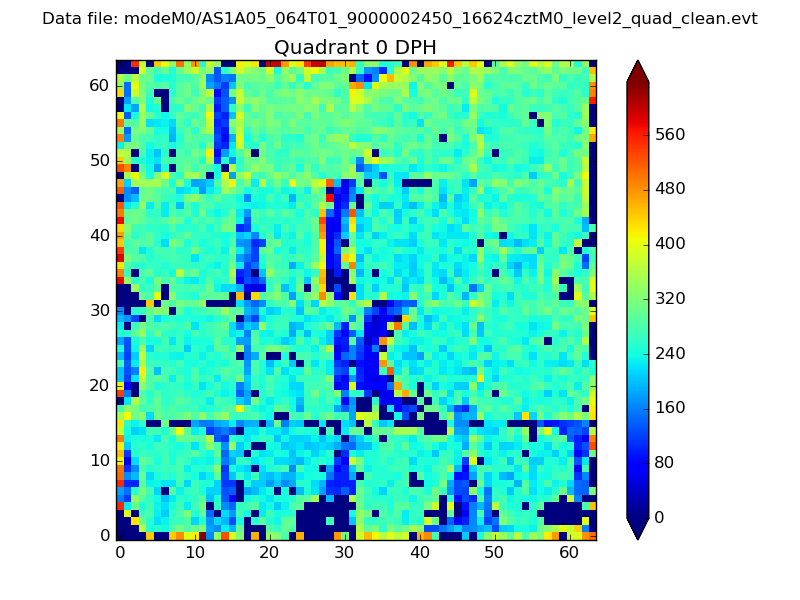 |
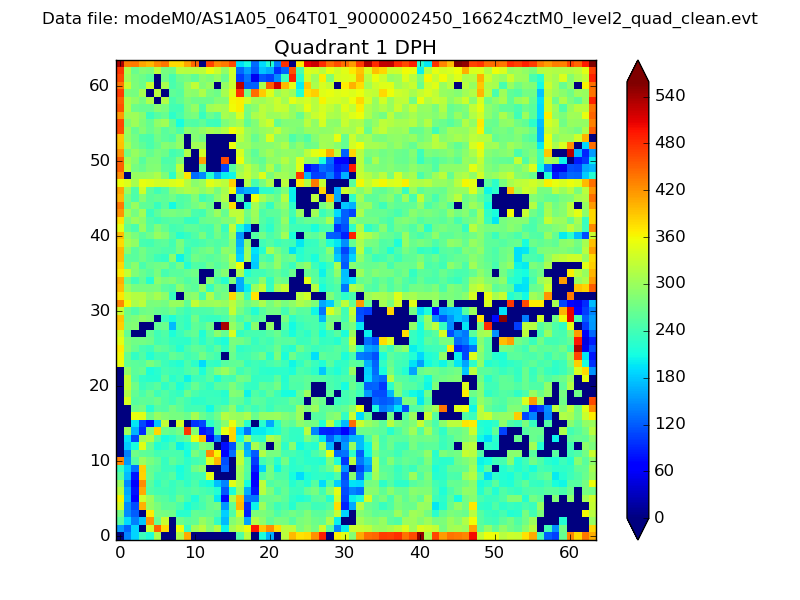 |
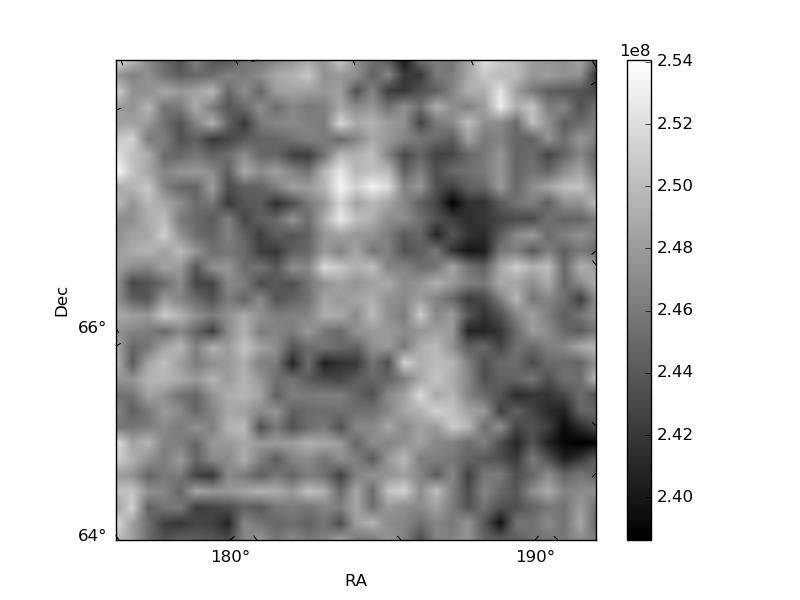
Quadrant B |
|---|---|---|---|
| Quadrant D | 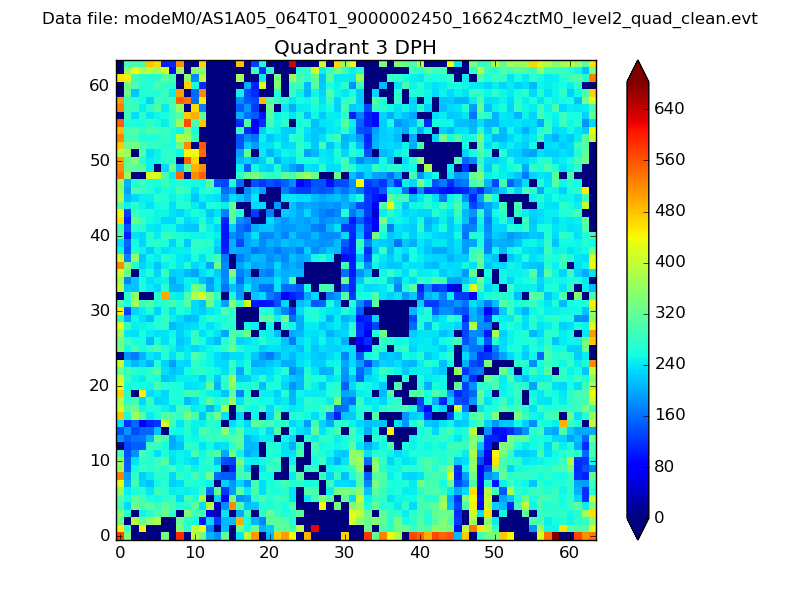 |
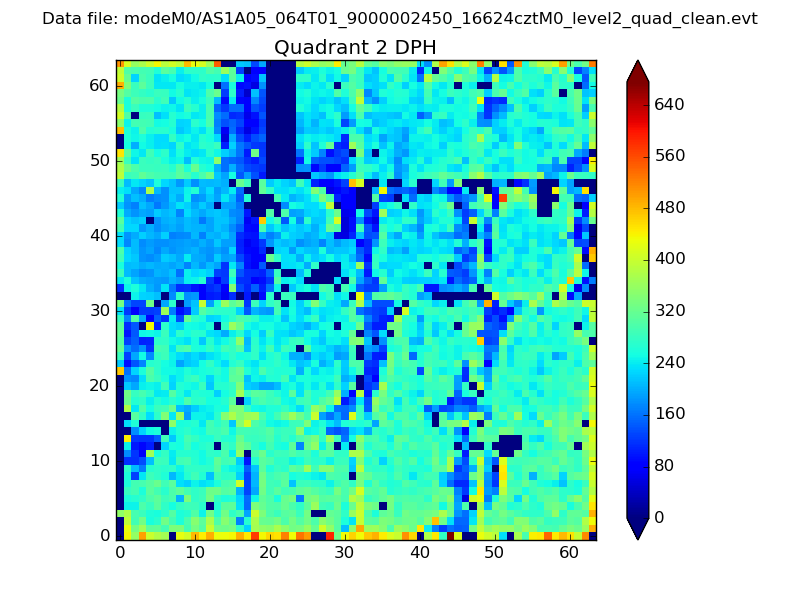 |
Quadrant C |
| Plot type | Count rate plots | Images |
|---|---|---|
| Comparison with Poisson distribution Blue bars denote a histogram of data divided into 1 sec bins. Red curve is a Poisson curve with rate = median count rate of data. |
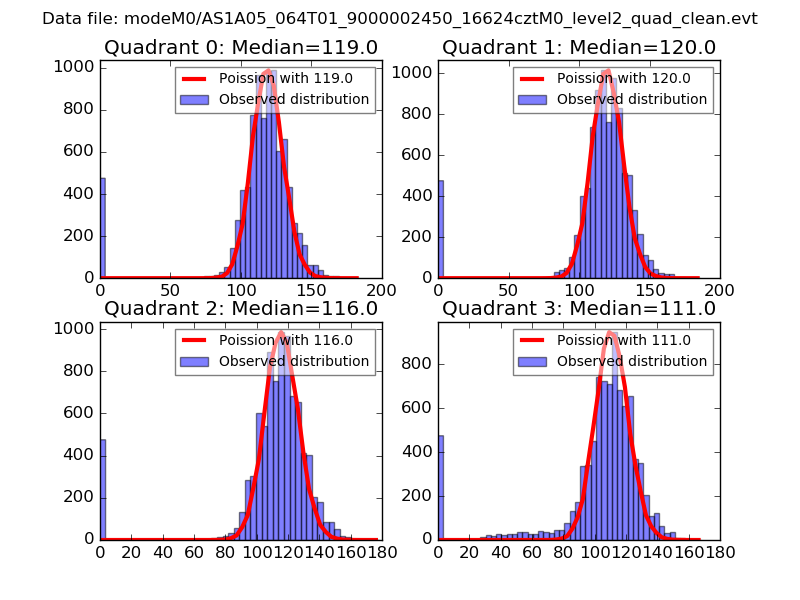 |
 |
| Quadrant-wise count rates Data is divided into 100 sec bins |
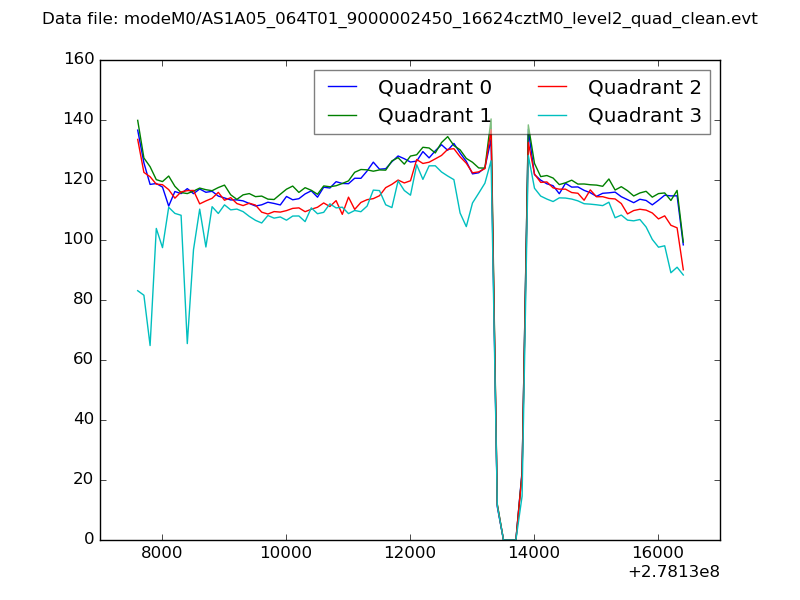 |
|
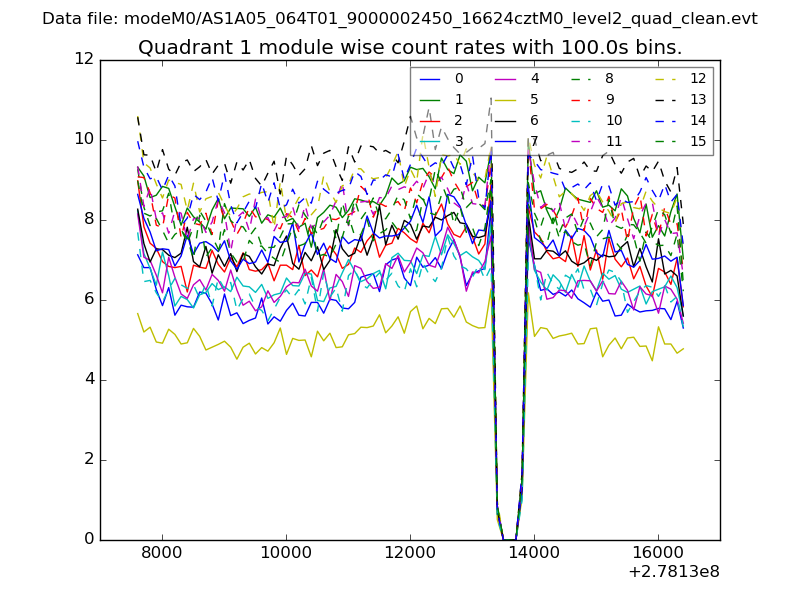
| Module-wise count rates for Quadrant A Data is divided into 100 sec bins |
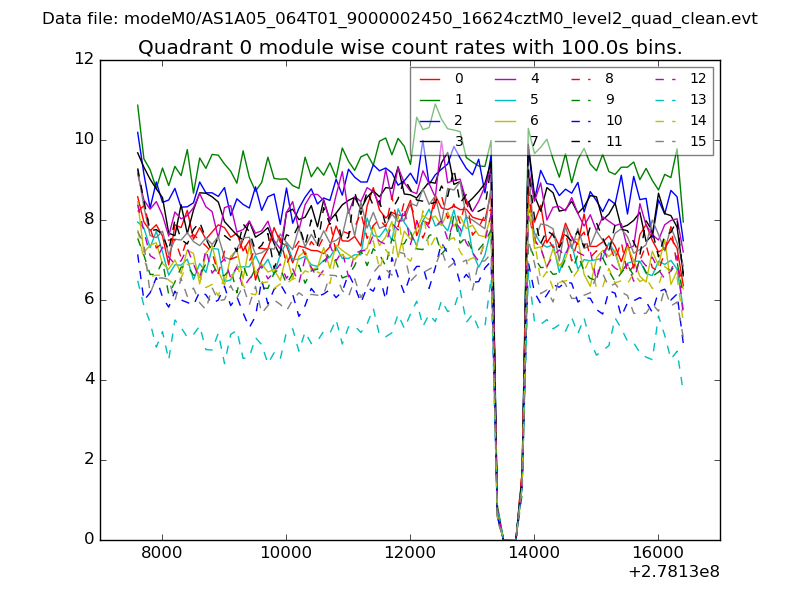 |
 |
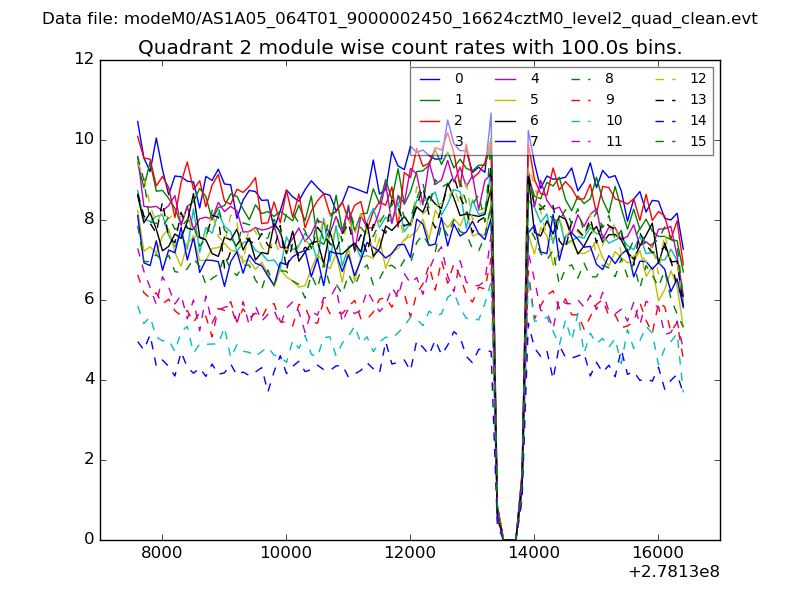
| Module-wise count rates for Quadrant B Data is divided into 100 sec bins |
 |
 |
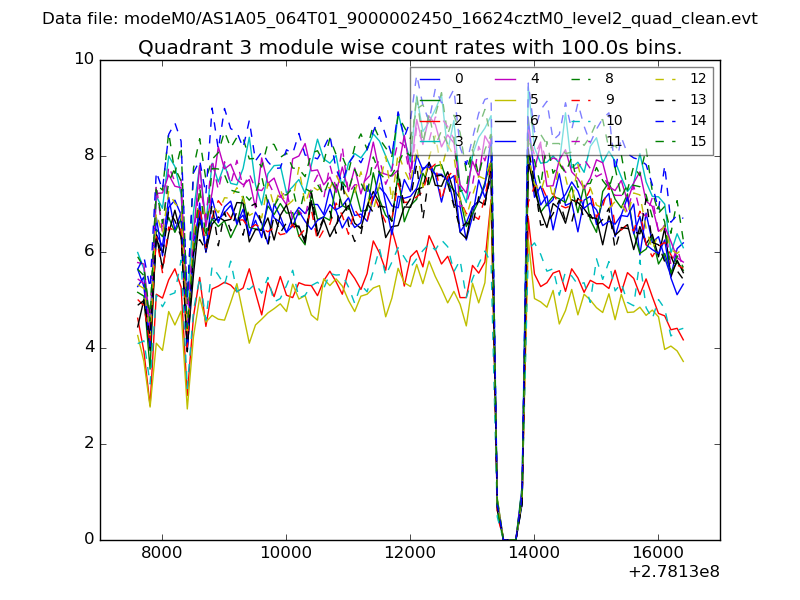
| Module-wise count rates for Quadrant C Data is divided into 100 sec bins |
 |
 |
| Module-wise count rates for Quadrant D Data is divided into 100 sec bins |
 |
 |
| Parameter | Plot |
|---|---|
| CZT HV Monitor | 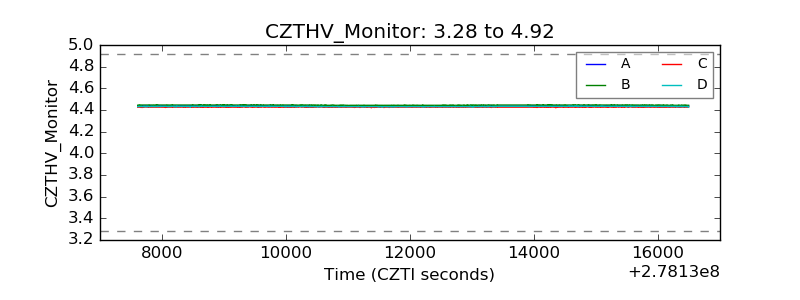 |
| D_VDD | 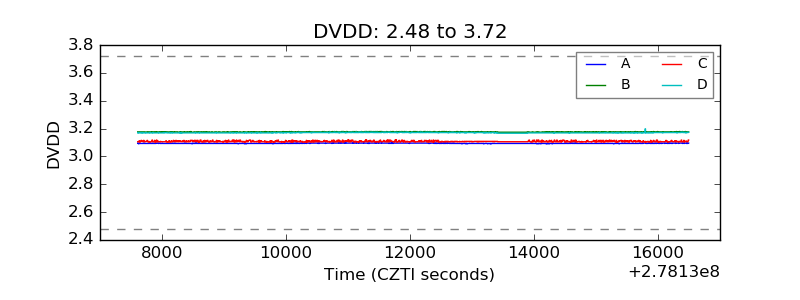 |
| Temperature 1 | 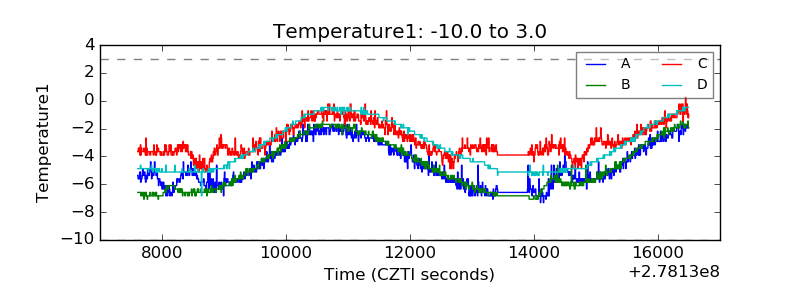 |
| Veto HV Monitor | 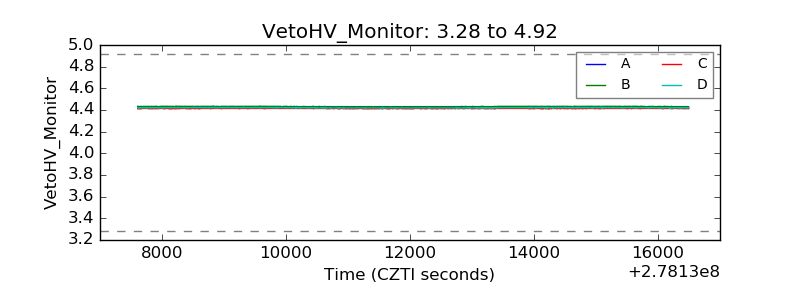 |
| Veto LLD | 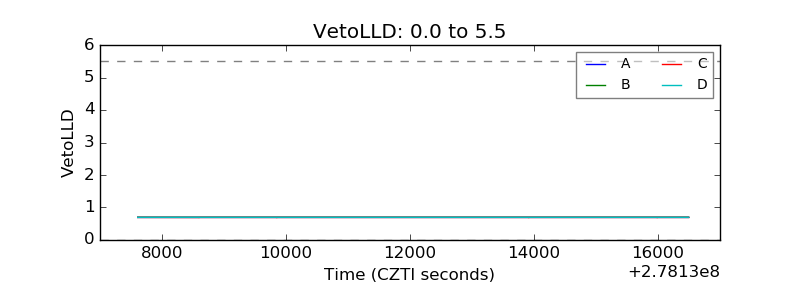 |
| Alpha Counter | 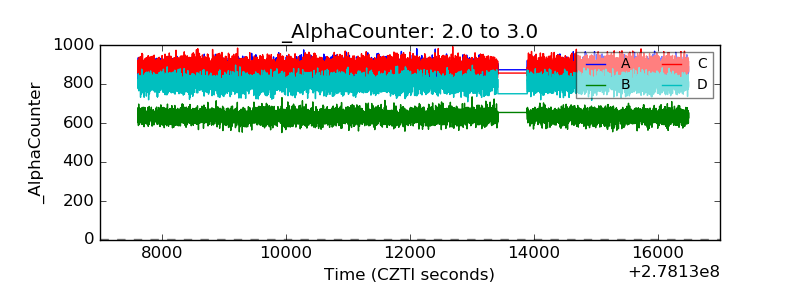 |
| _CPM_Rate | 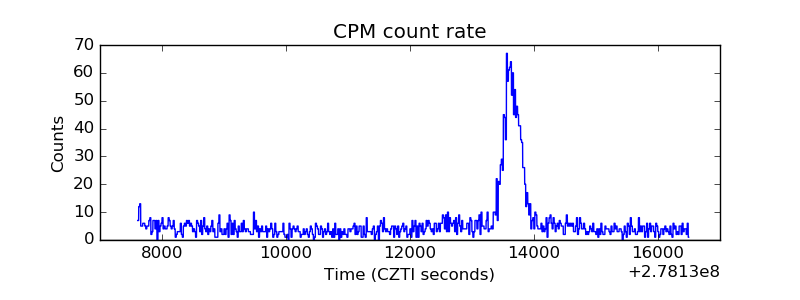 |
| CZT Counter | 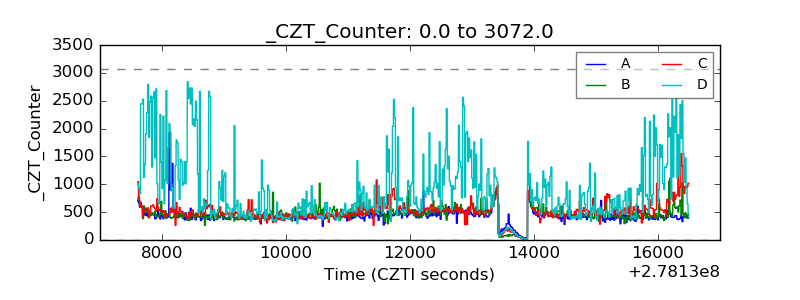 |
| +2.5 Volts monitor | 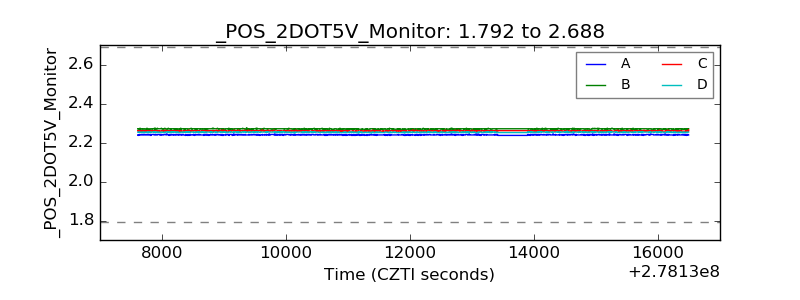 |
| +5 Volts monitor | 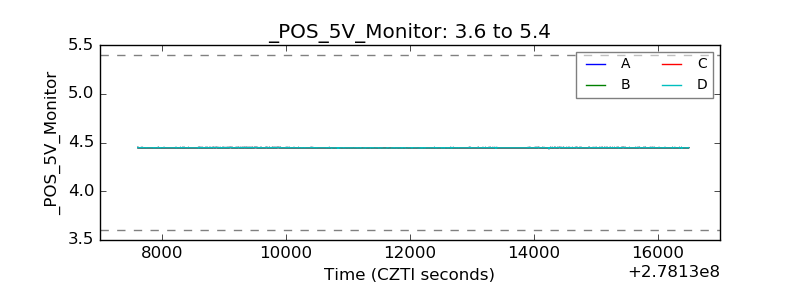 |
| _ROLL_ROT | 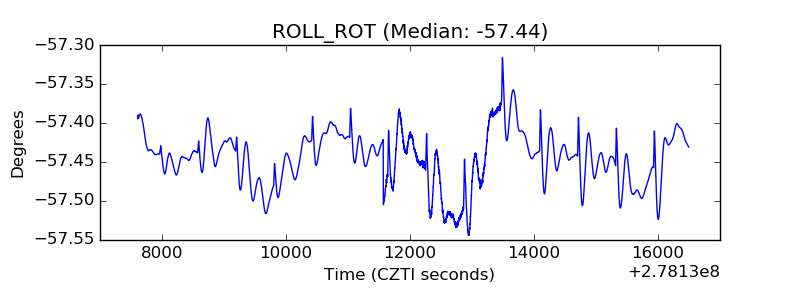 |
| _Roll_DEC | 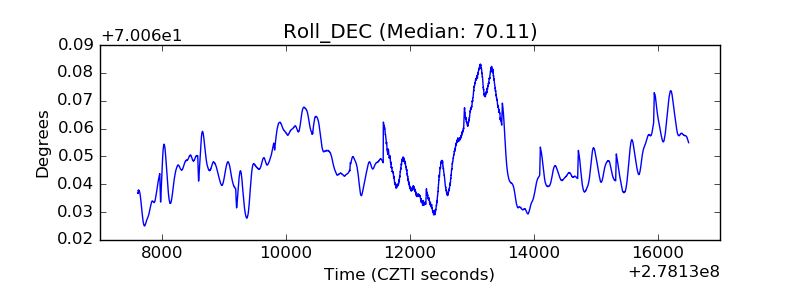 |
| _Roll_RA | 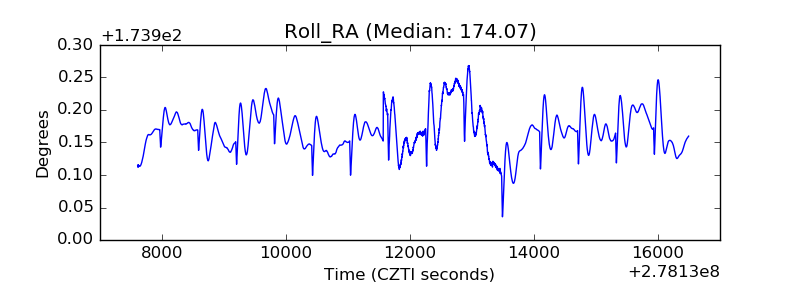 |
| Veto Counter | 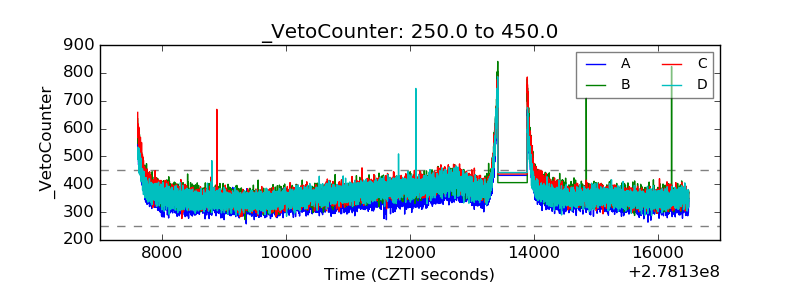 |