| Param | Original file | Final file |
|---|---|---|
| Filename | modeM0/AS1A05_064T01_9000002450_16625cztM0_level2.evt | modeM0/AS1A05_064T01_9000002450_16625cztM0_level2_quad_clean.evt |
| Size (bytes) | 1,183,147,200 | 185,160,960 |
| Size | 1.1 GB | 176.6 MB |
| Events in quadrant A | 5,771,775 | 1,282,439 |
| Events in quadrant B | 5,436,950 | 1,304,366 |
| Events in quadrant C | 13,753,331 | 1,107,452 |
| Events in quadrant D | 10,155,609 | 1,177,968 |
| Mode M0 | |||
|---|---|---|---|
| Quadrant | BADHDUFLAG | Total packets | Discarded packets |
| A | 0 | 24440 | 3 |
| B | 0 | 22864 | 2 |
| C | 0 | 48233 | 2 |
| D | 0 | 37503 | 2 |
| Mode SS | |||
|---|---|---|---|
| Quadrant | BADHDUFLAG | Total packets | Discarded packets |
| A | 0 | 214 | 0 |
| B | 0 | 214 | 0 |
| C | 0 | 214 | 0 |
| D | 0 | 214 | 0 |
| Mode M9 | |||
|---|---|---|---|
| Quadrant | BADHDUFLAG | Total packets | Discarded packets |
| A | 0 | 16 | 0 |
| B | 0 | 16 | 0 |
| C | 0 | 16 | 0 |
| D | 0 | 16 | 0 |
| Quadrant | Total seconds | Saturated seconds | Saturation percentage |
|---|---|---|---|
| A | 10612 | 413 | 3.891821% |
| B | 10612 | 113 | 1.064832% |
| C | 10612 | 3139 | 29.579721% |
| D | 10612 | 948 | 8.933283% |
Noise dominated data is calculated using 1-second bins in cleaned event files. If a bin has >2000 counts, and if more than 50% of those come from <1% of pixels, then it is considered to be noise-dominated and hence unusable.
| Quadrant | # 1 sec bins | Bins with >0 counts | Bins with >2000 counts | High rate bins dominated by noise | Noise dominated (total time) | Noise dominated (detector-on time) | Marked lightcurve |
|---|---|---|---|---|---|---|---|
| A | 12143 | 10615 | 198 | 198 | 1.63% | 1.87% | 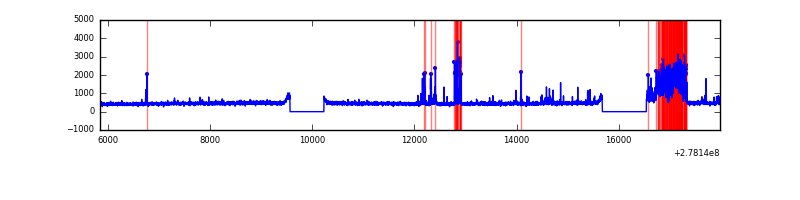 |
| B | 12143 | 10615 | 17 | 17 | 0.14% | 0.16% | 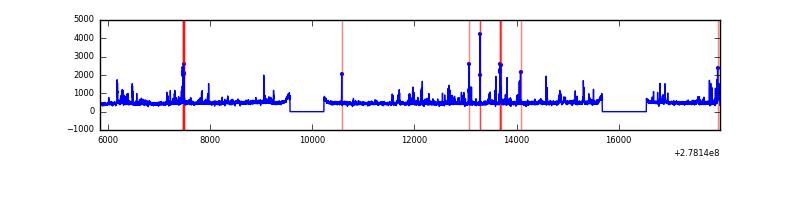 |
| C | 12143 | 10615 | 2332 | 2332 | 19.20% | 21.97% | 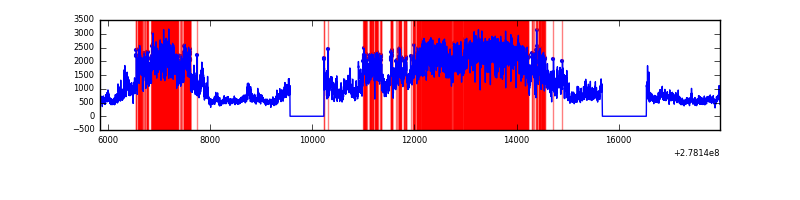 |
| D | 12143 | 10615 | 768 | 768 | 6.32% | 7.24% | 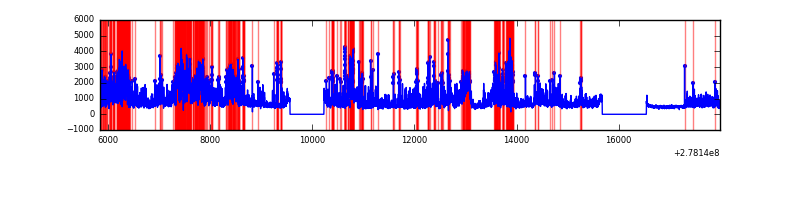 |
Top three noisy pixels from each quadrant. If the there are fewer than three noisy pixels in the level2.evt file, extra rows are filled as -1
| Pixel properties | Quadrant properties | ||||||
|---|---|---|---|---|---|---|---|
| Quadrant | DetID | PixID | Counts | Sigma | Mean | Median | Sigma |
| A | 15 | 174 | 970382 | 3912.86 | 1230 | 1201 | 247.7 |
| A | 9 | 143 | 55395 | 218.8 | 1230 | 1201 | 247.7 |
| A | 15 | 223 | 11855 | 43.01 | 1230 | 1201 | 247.7 |
| B | 15 | 35 | 148735 | 632.12 | 1230 | 1196 | 233.4 |
| B | 0 | 189 | 85576 | 361.52 | 1230 | 1196 | 233.4 |
| B | 0 | 198 | 75311 | 317.54 | 1230 | 1196 | 233.4 |
| C | 3 | 233 | 9249455 | 36804.2 | 1081 | 1086 | 251.3 |
| C | 14 | 238 | 162022 | 640.45 | 1081 | 1086 | 251.3 |
| C | 7 | 247 | 107457 | 423.31 | 1081 | 1086 | 251.3 |
| D | 1 | 52 | 5173523 | 17983.14 | 1172 | 1133 | 287.6 |
| D | 10 | 70 | 161226 | 556.6 | 1172 | 1133 | 287.6 |
| D | 5 | 222 | 138002 | 475.86 | 1172 | 1133 | 287.6 |
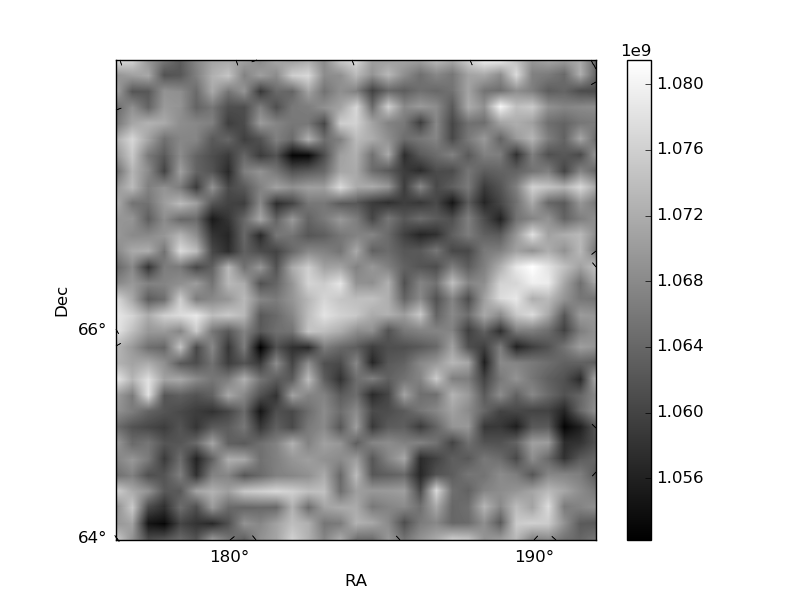
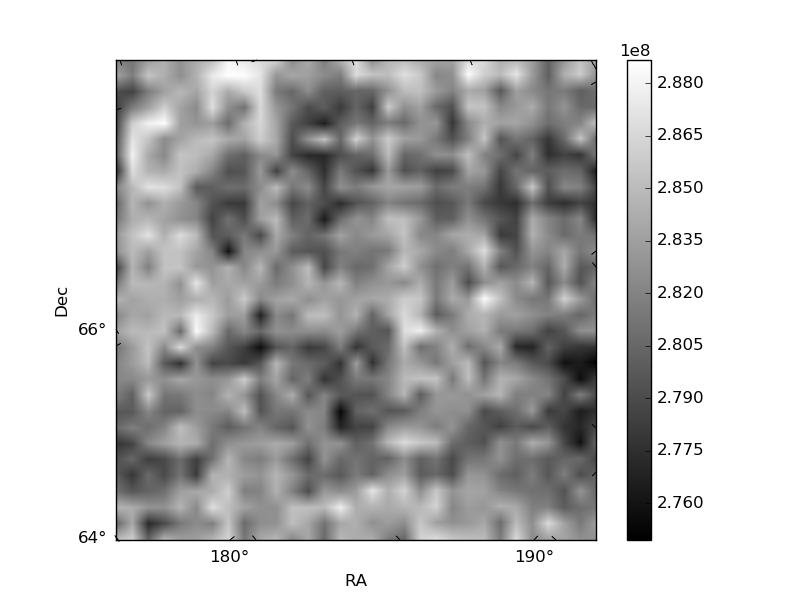
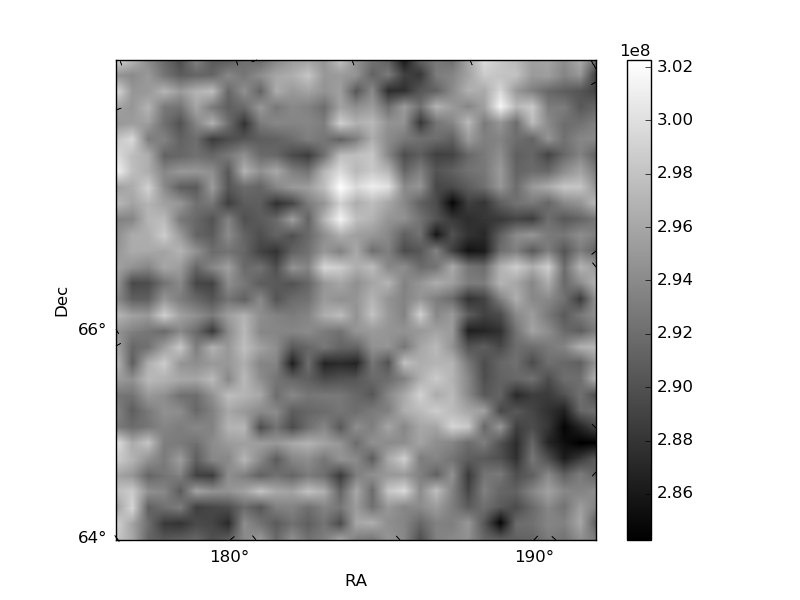
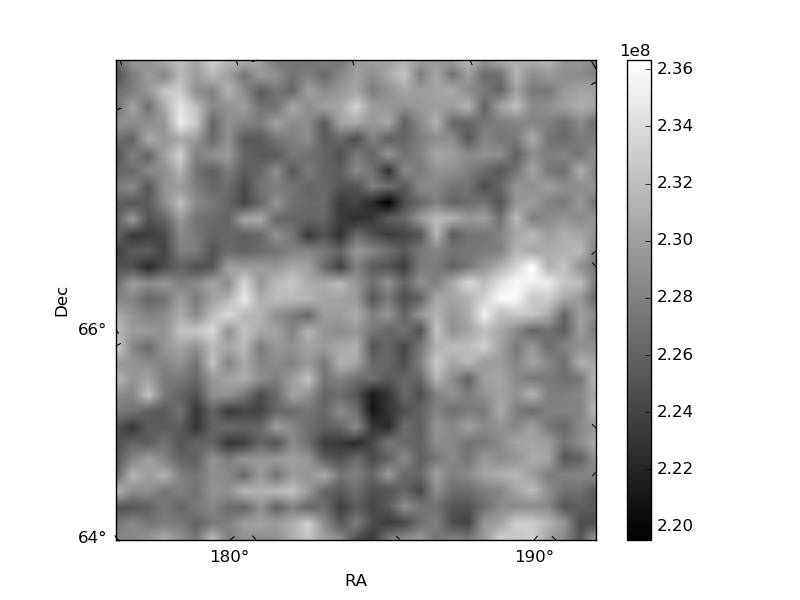
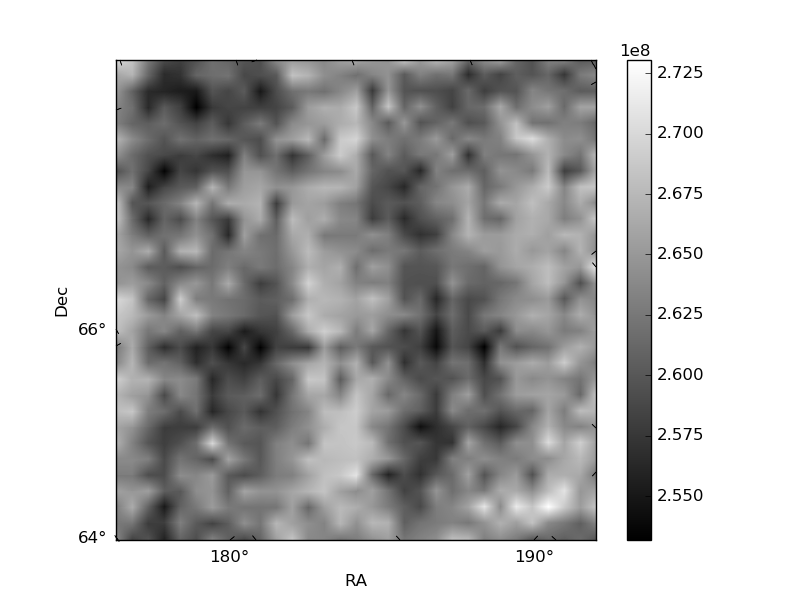
Histogram calculated using DETX and DETY for each event in the final _common_clean file
| Quadrant A | 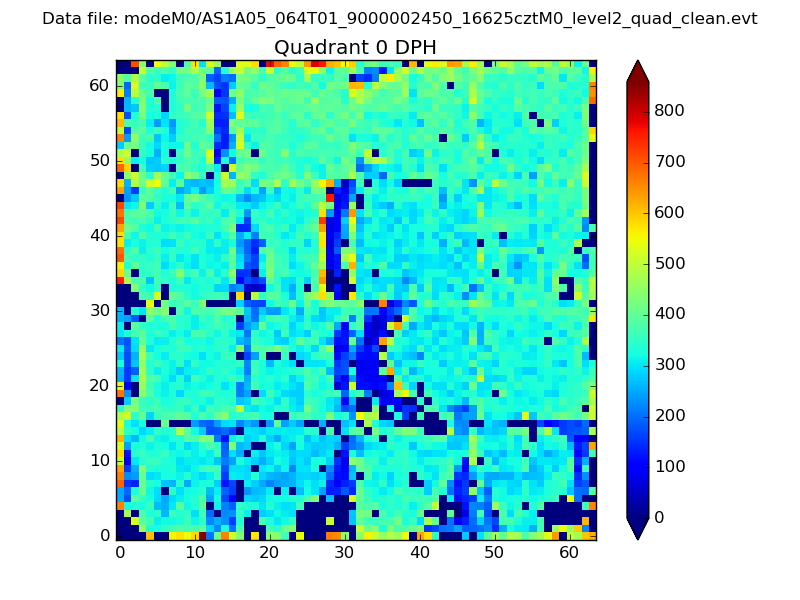 |
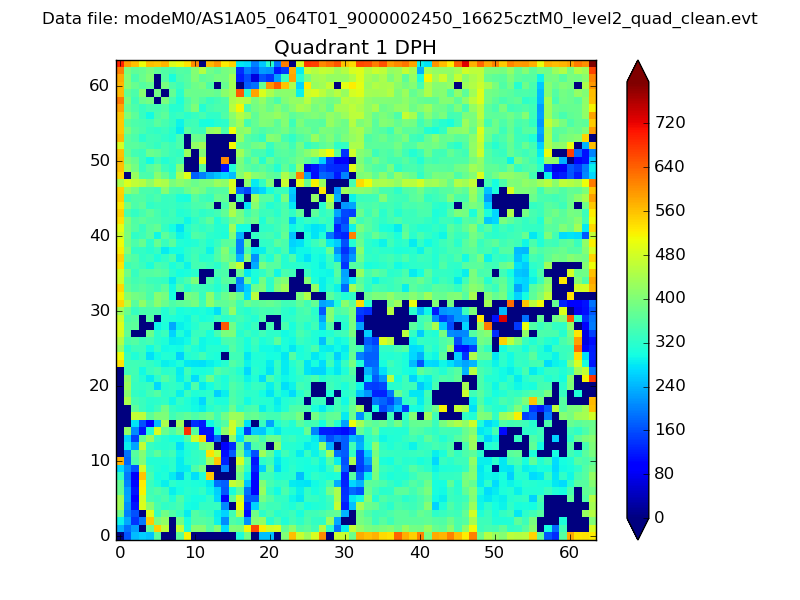 |
Quadrant B |
|---|---|---|---|
| Quadrant D | 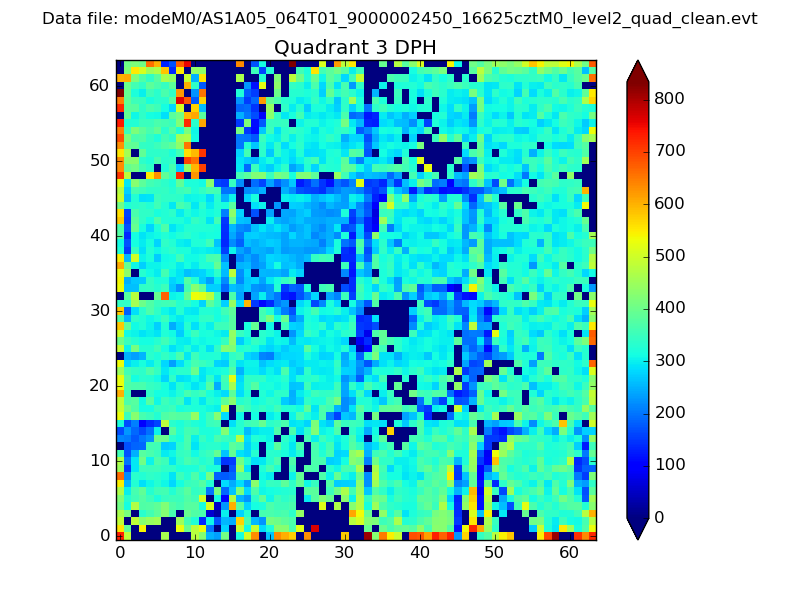 |
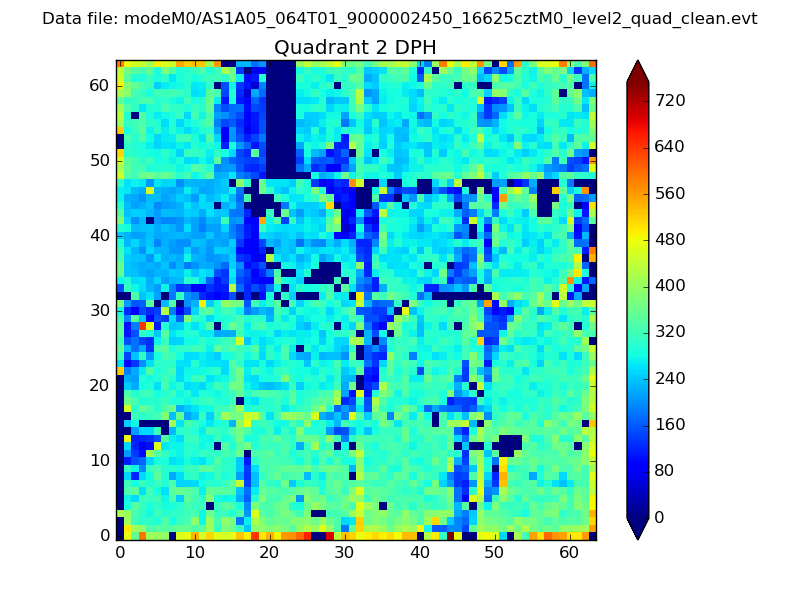 |
Quadrant C |
| Plot type | Count rate plots | Images |
|---|---|---|
| Comparison with Poisson distribution Blue bars denote a histogram of data divided into 1 sec bins. Red curve is a Poisson curve with rate = median count rate of data. |
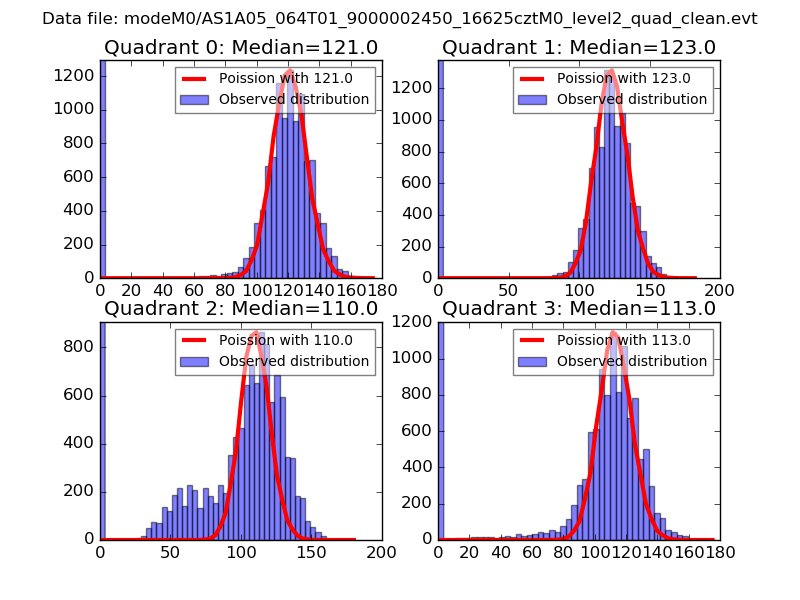 |
 |
| Quadrant-wise count rates Data is divided into 100 sec bins |
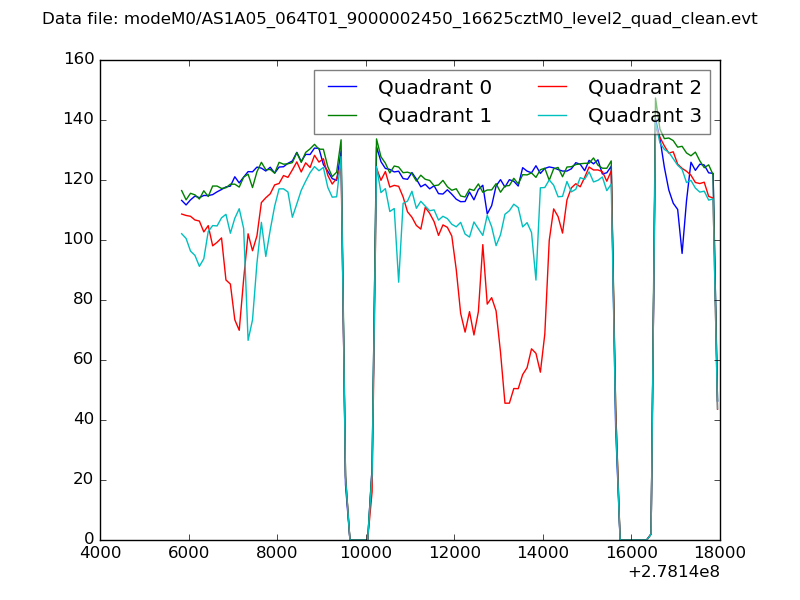 |
|
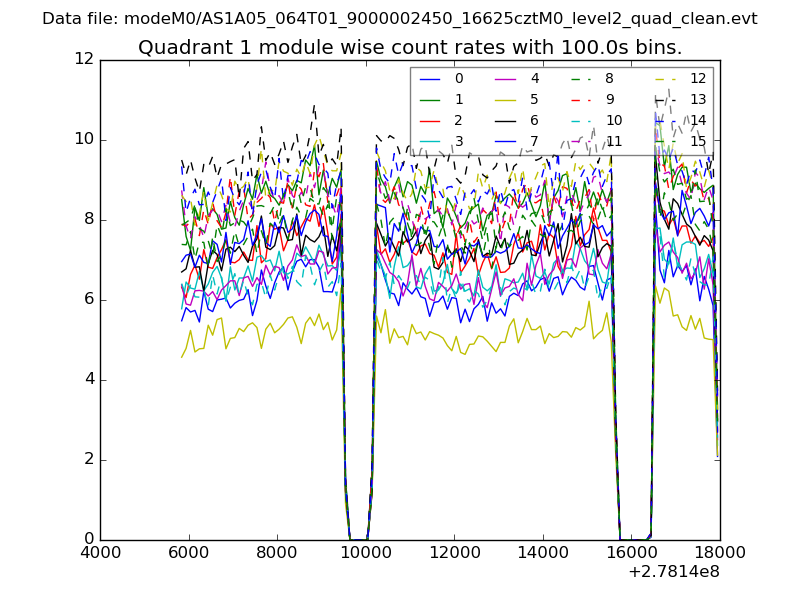
| Module-wise count rates for Quadrant A Data is divided into 100 sec bins |
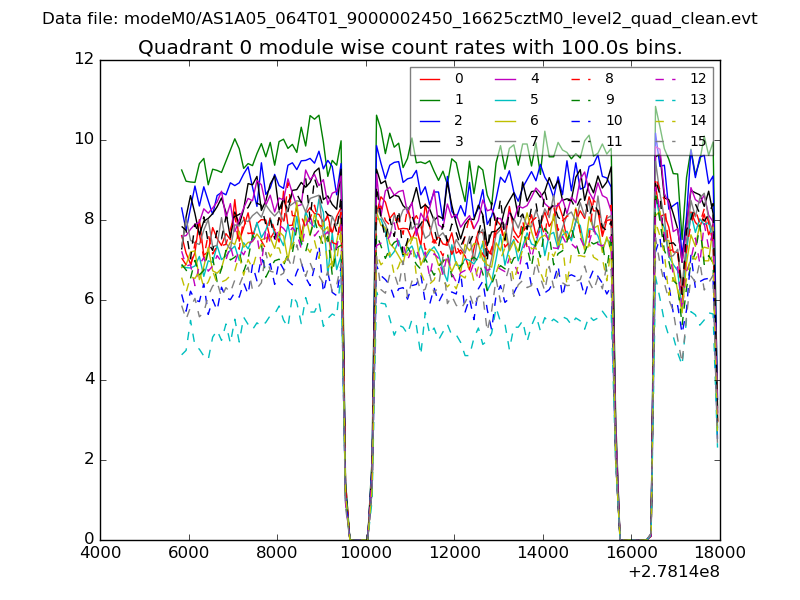 |
 |
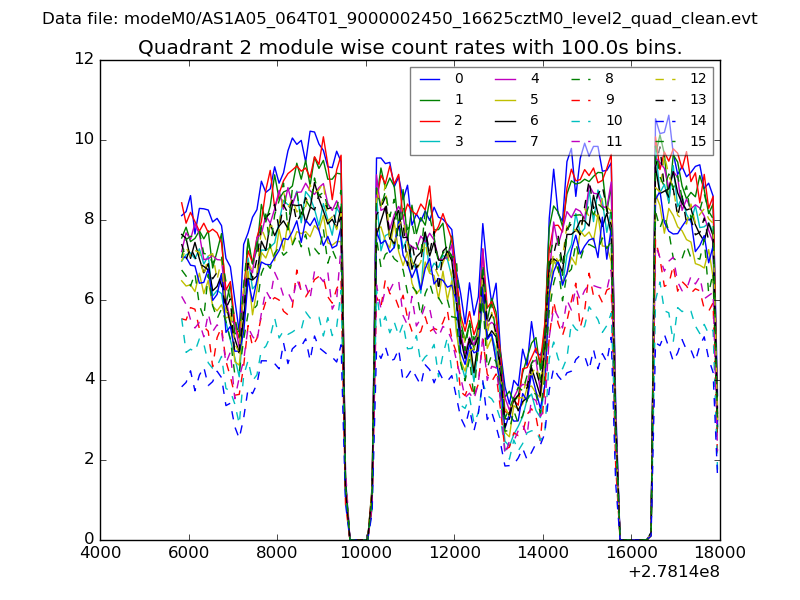
| Module-wise count rates for Quadrant B Data is divided into 100 sec bins |
 |
 |
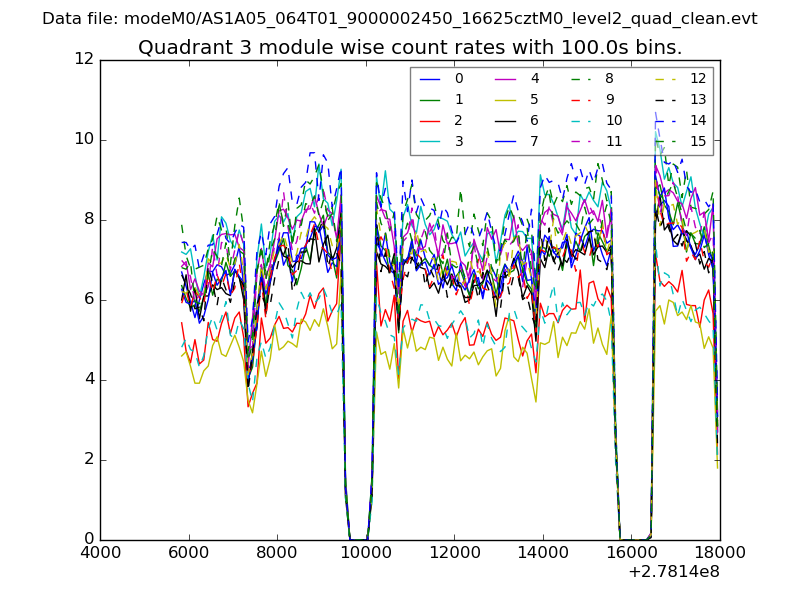
| Module-wise count rates for Quadrant C Data is divided into 100 sec bins |
 |
 |
| Module-wise count rates for Quadrant D Data is divided into 100 sec bins |
 |
 |
| Parameter | Plot |
|---|---|
| CZT HV Monitor | 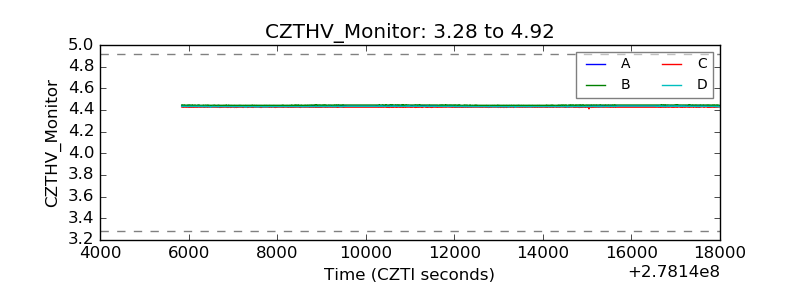 |
| D_VDD | 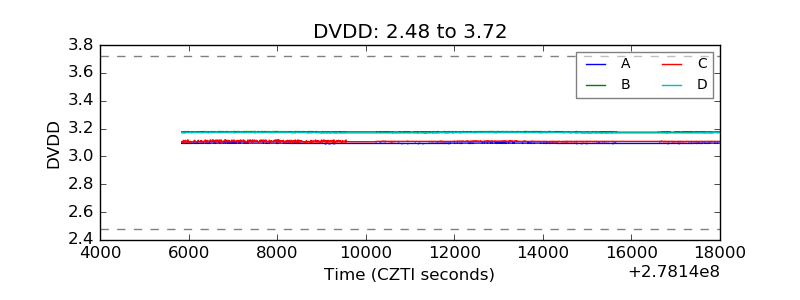 |
| Temperature 1 | 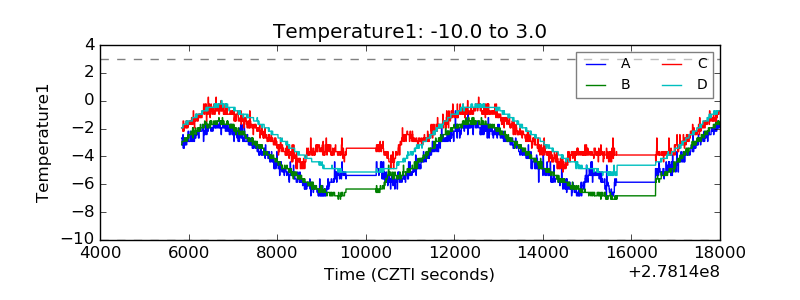 |
| Veto HV Monitor | 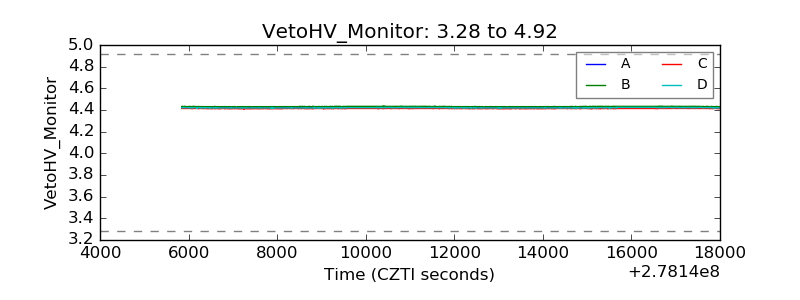 |
| Veto LLD | 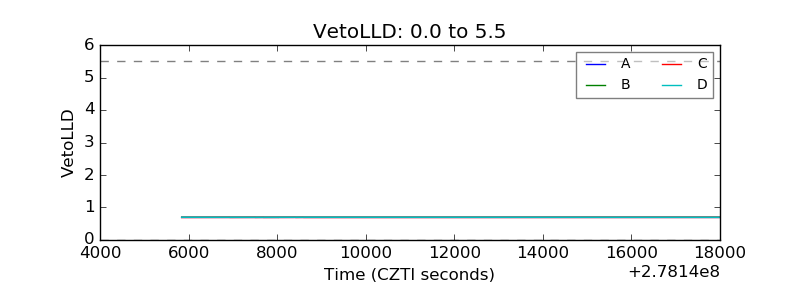 |
| Alpha Counter | 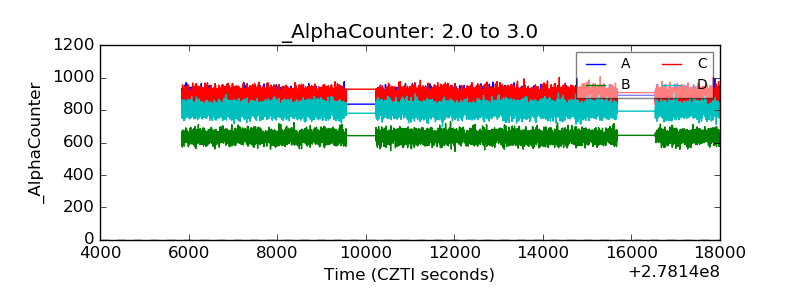 |
| _CPM_Rate | 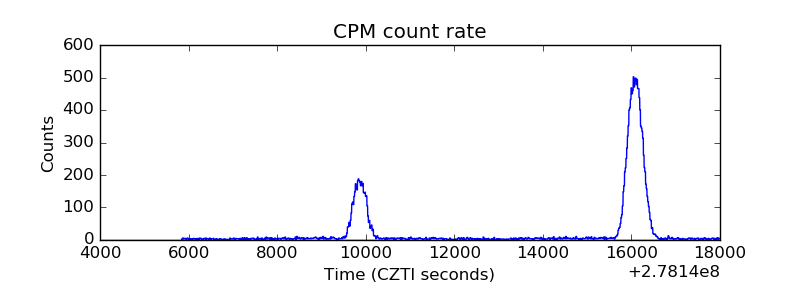 |
| CZT Counter | 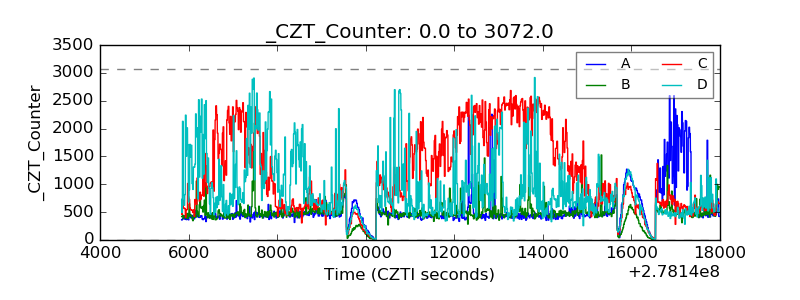 |
| +2.5 Volts monitor |  |
| +5 Volts monitor |  |
| _ROLL_ROT | 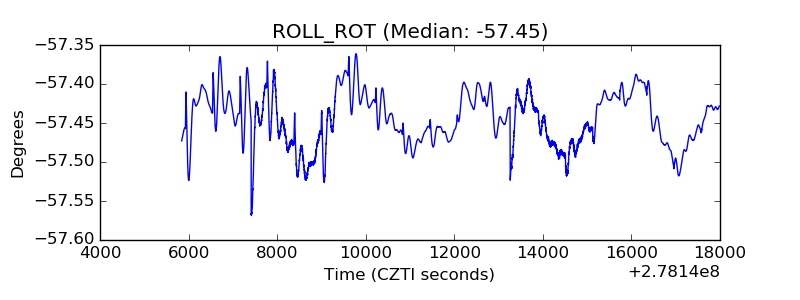 |
| _Roll_DEC |  |
| _Roll_RA | 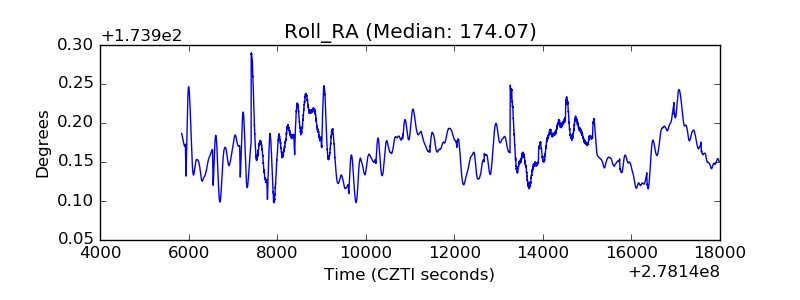 |
| Veto Counter | 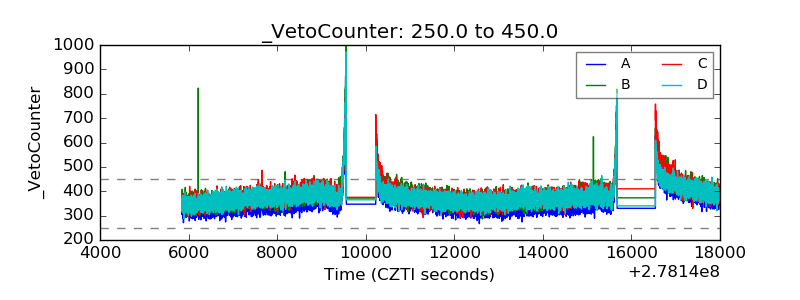 |