| Param | Original file | Final file |
|---|---|---|
| Filename | modeM0/AS1A05_064T01_9000002450_16626cztM0_level2.evt | modeM0/AS1A05_064T01_9000002450_16626cztM0_level2_quad_clean.evt |
| Size (bytes) | 554,572,800 | 117,095,040 |
| Size | 528.9 MB | 111.7 MB |
| Events in quadrant A | 3,525,939 | 792,280 |
| Events in quadrant B | 3,343,489 | 803,285 |
| Events in quadrant C | 4,521,047 | 761,615 |
| Events in quadrant D | 4,977,918 | 749,121 |
| Mode M0 | |||
|---|---|---|---|
| Quadrant | BADHDUFLAG | Total packets | Discarded packets |
| A | 0 | 14710 | 2 |
| B | 0 | 13963 | 1 |
| C | 0 | 18013 | 1 |
| D | 0 | 19113 | 1 |
| Mode SS | |||
|---|---|---|---|
| Quadrant | BADHDUFLAG | Total packets | Discarded packets |
| A | 0 | 130 | 0 |
| B | 0 | 130 | 0 |
| C | 0 | 130 | 0 |
| D | 0 | 130 | 0 |
| Mode M9 | |||
|---|---|---|---|
| Quadrant | BADHDUFLAG | Total packets | Discarded packets |
| A | 0 | 10 | 0 |
| B | 0 | 10 | 0 |
| C | 0 | 10 | 0 |
| D | 0 | 10 | 0 |
| Quadrant | Total seconds | Saturated seconds | Saturation percentage |
|---|---|---|---|
| A | 6299 | 266 | 4.222893% |
| B | 6299 | 40 | 0.635021% |
| C | 6299 | 83 | 1.317669% |
| D | 6299 | 168 | 2.667090% |
Noise dominated data is calculated using 1-second bins in cleaned event files. If a bin has >2000 counts, and if more than 50% of those come from <1% of pixels, then it is considered to be noise-dominated and hence unusable.
| Quadrant | # 1 sec bins | Bins with >0 counts | Bins with >2000 counts | High rate bins dominated by noise | Noise dominated (total time) | Noise dominated (detector-on time) | Marked lightcurve |
|---|---|---|---|---|---|---|---|
| A | 7325 | 6301 | 159 | 159 | 2.17% | 2.52% | 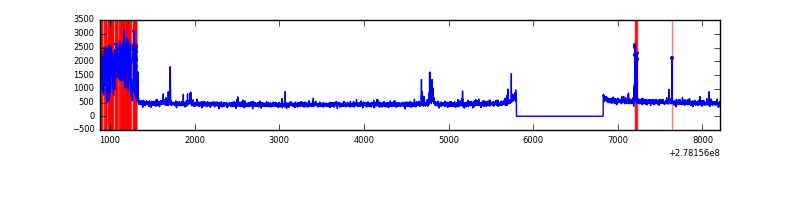 |
| B | 7325 | 6301 | 8 | 8 | 0.11% | 0.13% | 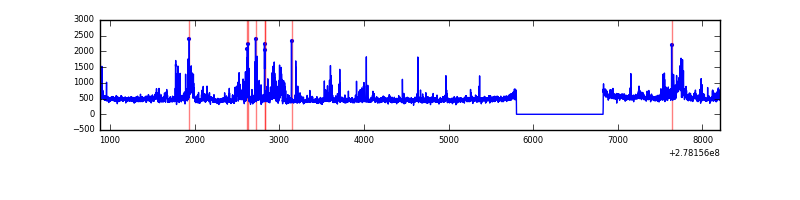 |
| C | 7325 | 6301 | 0 | 0 | 0.00% | 0.00% | 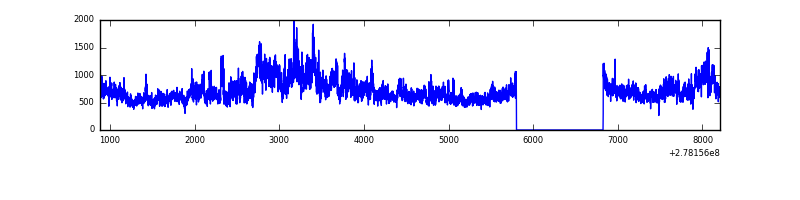 |
| D | 7325 | 6301 | 113 | 113 | 1.54% | 1.79% | 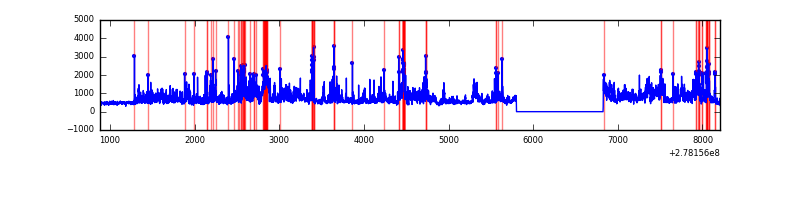 |
Top three noisy pixels from each quadrant. If the there are fewer than three noisy pixels in the level2.evt file, extra rows are filled as -1
| Pixel properties | Quadrant properties | ||||||
|---|---|---|---|---|---|---|---|
| Quadrant | DetID | PixID | Counts | Sigma | Mean | Median | Sigma |
| A | 15 | 174 | 636236 | 4250.51 | 740 | 726 | 149.5 |
| A | 9 | 143 | 38033 | 249.52 | 740 | 726 | 149.5 |
| A | 0 | 226 | 6481 | 38.49 | 740 | 726 | 149.5 |
| B | 0 | 189 | 165283 | 1176.94 | 738 | 719 | 139.8 |
| B | 15 | 35 | 114046 | 810.5 | 738 | 719 | 139.8 |
| B | 0 | 198 | 50316 | 354.71 | 738 | 719 | 139.8 |
| C | 3 | 233 | 1601165 | 9678.11 | 707 | 710 | 165.4 |
| C | 14 | 238 | 108499 | 651.81 | 707 | 710 | 165.4 |
| C | 7 | 247 | 54961 | 328.06 | 707 | 710 | 165.4 |
| D | 1 | 52 | 1936728 | 11204.42 | 717 | 696 | 172.8 |
| D | 2 | 33 | 160009 | 921.99 | 717 | 696 | 172.8 |
| D | 10 | 70 | 105144 | 604.47 | 717 | 696 | 172.8 |
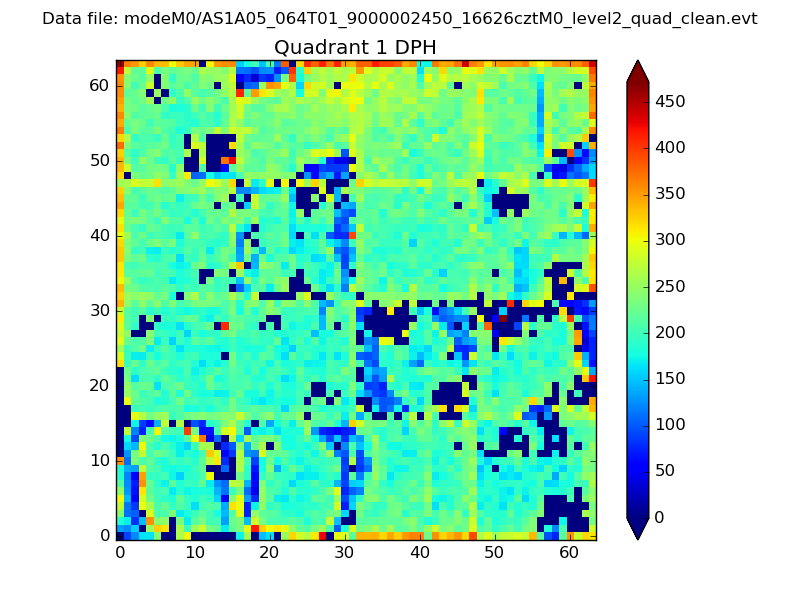
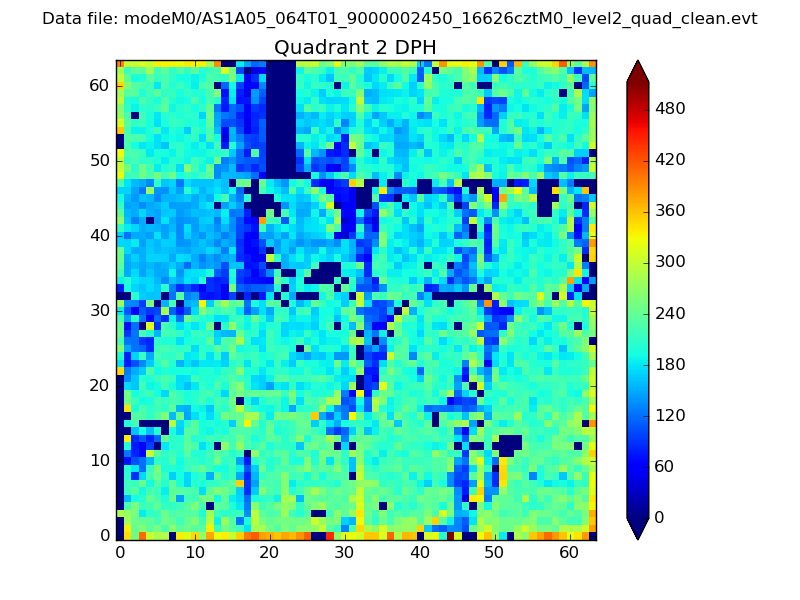
Histogram calculated using DETX and DETY for each event in the final _common_clean file
| Quadrant A |  |
 |
Quadrant B |
|---|---|---|---|
| Quadrant D | 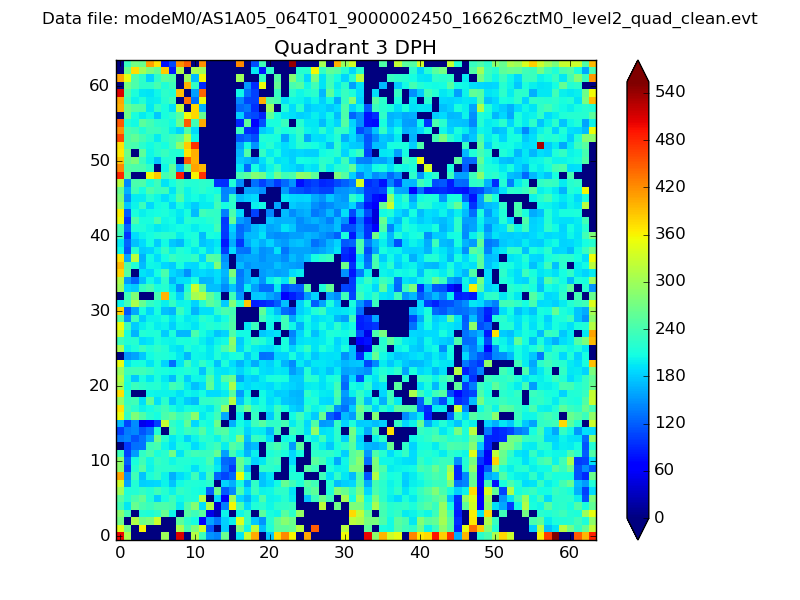 |
 |
Quadrant C |
| Plot type | Count rate plots | Images |
|---|---|---|
| Comparison with Poisson distribution Blue bars denote a histogram of data divided into 1 sec bins. Red curve is a Poisson curve with rate = median count rate of data. |
 |
 |
| Quadrant-wise count rates Data is divided into 100 sec bins |
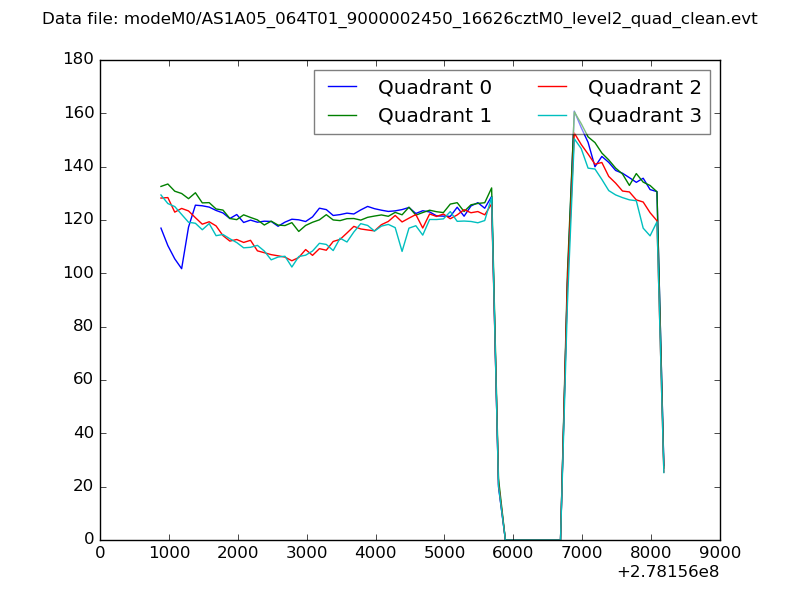 |
|
| Module-wise count rates for Quadrant A Data is divided into 100 sec bins |
 |
 |
| Module-wise count rates for Quadrant B Data is divided into 100 sec bins |
 |
 |
| Module-wise count rates for Quadrant C Data is divided into 100 sec bins |
 |
 |
| Module-wise count rates for Quadrant D Data is divided into 100 sec bins |
 |
 |
| Parameter | Plot |
|---|---|
| CZT HV Monitor |  |
| D_VDD | 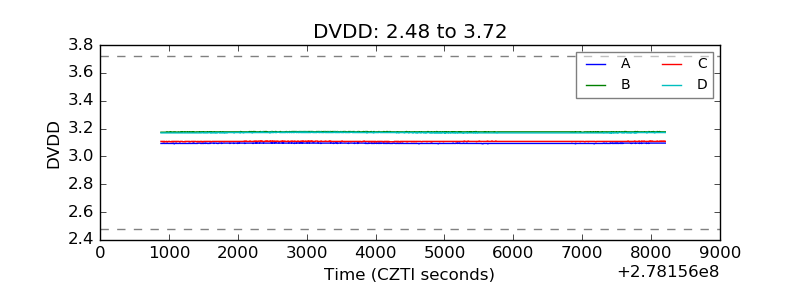 |
| Temperature 1 | 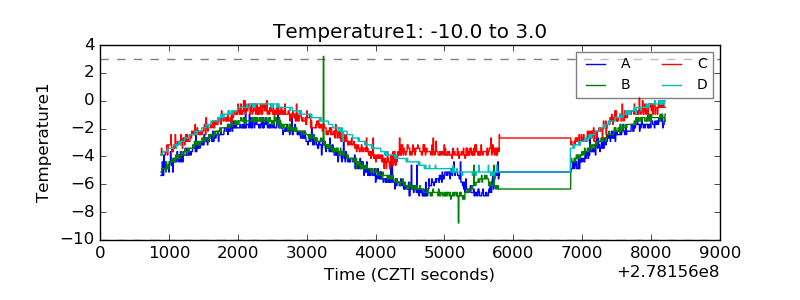 |
| Veto HV Monitor | 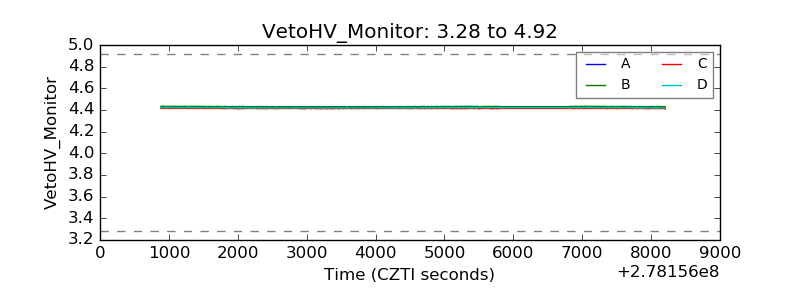 |
| Veto LLD | 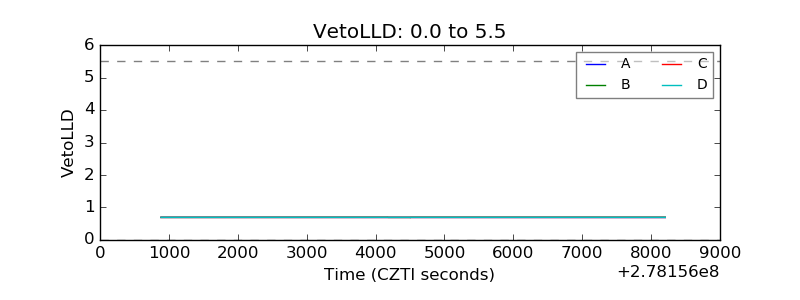 |
| Alpha Counter |  |
| _CPM_Rate | 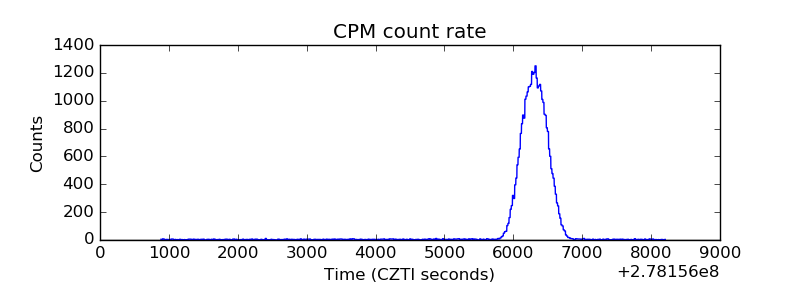 |
| CZT Counter | 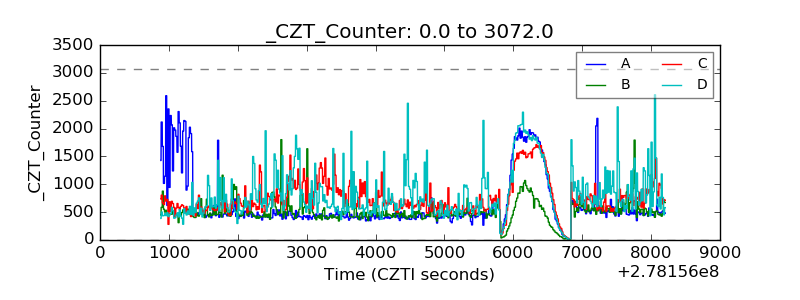 |
| +2.5 Volts monitor |  |
| +5 Volts monitor |  |
| _ROLL_ROT | 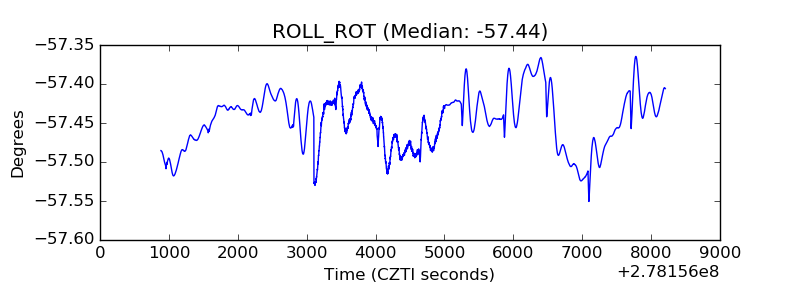 |
| _Roll_DEC | 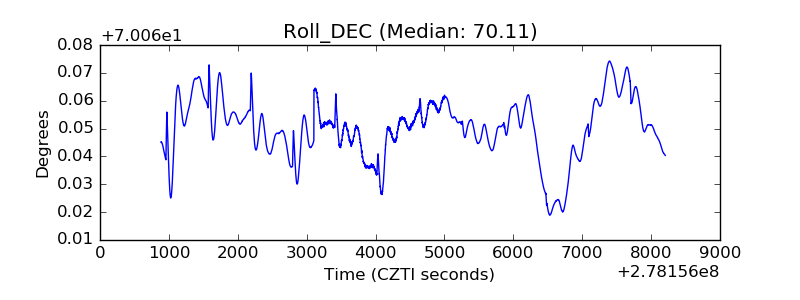 |
| _Roll_RA | 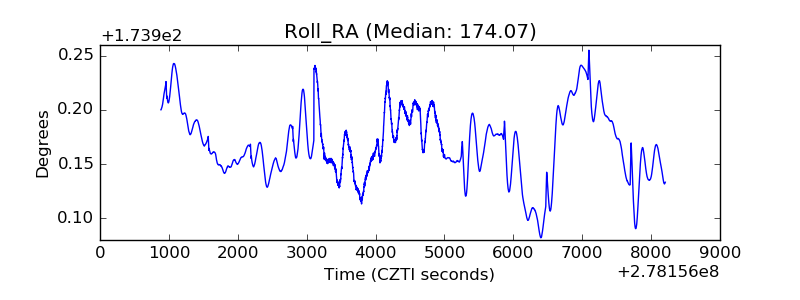 |
| Veto Counter | 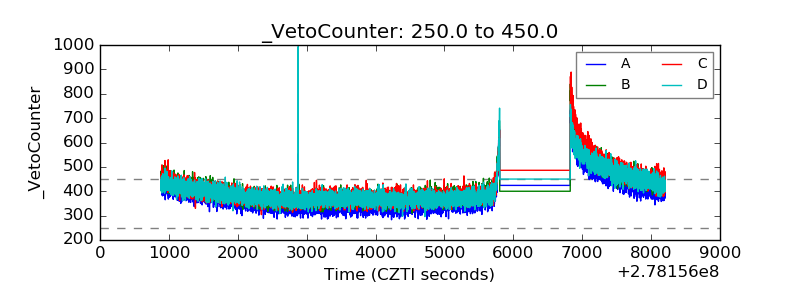 |