| Param | Original file | Final file |
|---|---|---|
| Filename | modeM0/AS1A05_064T01_9000002450_16632cztM0_level2.evt | modeM0/AS1A05_064T01_9000002450_16632cztM0_level2_quad_clean.evt |
| Size (bytes) | 455,878,080 | 128,280,960 |
| Size | 434.8 MB | 122.3 MB |
| Events in quadrant A | 3,036,683 | 866,052 |
| Events in quadrant B | 3,454,269 | 878,297 |
| Events in quadrant C | 3,509,935 | 864,741 |
| Events in quadrant D | 3,385,697 | 845,086 |
| Mode M0 | |||
|---|---|---|---|
| Quadrant | BADHDUFLAG | Total packets | Discarded packets |
| A | 0 | 13071 | 3 |
| B | 0 | 14406 | 2 |
| C | 0 | 14396 | 2 |
| D | 0 | 14111 | 2 |
| Mode SS | |||
|---|---|---|---|
| Quadrant | BADHDUFLAG | Total packets | Discarded packets |
| A | 0 | 128 | 0 |
| B | 0 | 128 | 0 |
| C | 0 | 128 | 0 |
| D | 0 | 128 | 0 |
| Mode M9 | |||
|---|---|---|---|
| Quadrant | BADHDUFLAG | Total packets | Discarded packets |
| A | 0 | 18 | 0 |
| B | 0 | 18 | 0 |
| C | 0 | 18 | 0 |
| D | 0 | 19 | 0 |
| Quadrant | Total seconds | Saturated seconds | Saturation percentage |
|---|---|---|---|
| A | 6168 | 85 | 1.378080% |
| B | 6168 | 125 | 2.026589% |
| C | 6168 | 155 | 2.512970% |
| D | 6168 | 92 | 1.491569% |
Noise dominated data is calculated using 1-second bins in cleaned event files. If a bin has >2000 counts, and if more than 50% of those come from <1% of pixels, then it is considered to be noise-dominated and hence unusable.
| Quadrant | # 1 sec bins | Bins with >0 counts | Bins with >2000 counts | High rate bins dominated by noise | Noise dominated (total time) | Noise dominated (detector-on time) | Marked lightcurve |
|---|---|---|---|---|---|---|---|
| A | 7439 | 6170 | 0 | 0 | 0.00% | 0.00% | 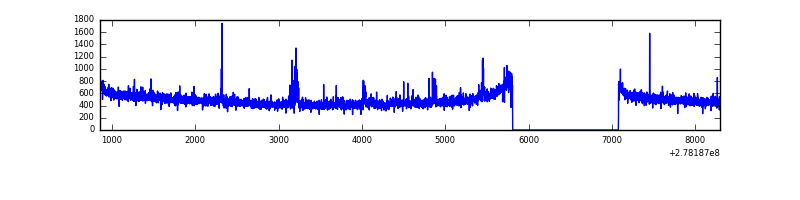 |
| B | 7439 | 6170 | 17 | 17 | 0.23% | 0.28% | 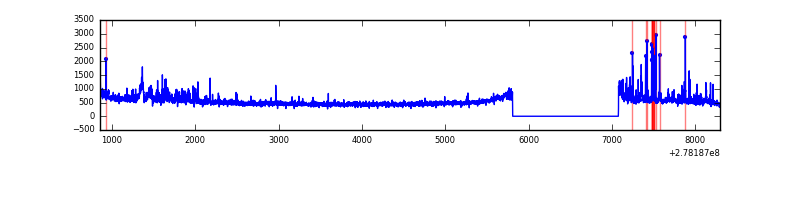 |
| C | 7439 | 6170 | 0 | 0 | 0.00% | 0.00% | 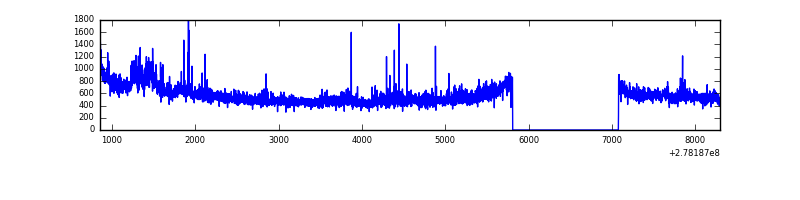 |
| D | 7439 | 6170 | 18 | 18 | 0.24% | 0.29% | 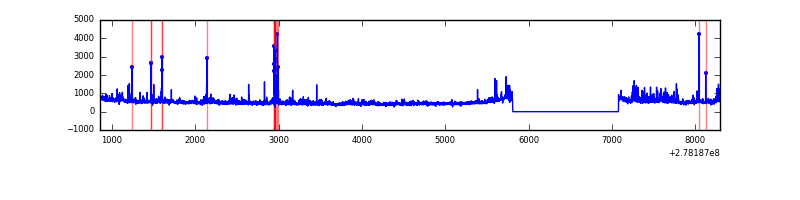 |
Top three noisy pixels from each quadrant. If the there are fewer than three noisy pixels in the level2.evt file, extra rows are filled as -1
| Pixel properties | Quadrant properties | ||||||
|---|---|---|---|---|---|---|---|
| Quadrant | DetID | PixID | Counts | Sigma | Mean | Median | Sigma |
| A | 15 | 174 | 68788 | 442.48 | 770 | 752 | 153.8 |
| A | 0 | 226 | 6856 | 39.7 | 770 | 752 | 153.8 |
| A | 12 | 194 | 5833 | 33.05 | 770 | 752 | 153.8 |
| B | 0 | 85 | 127666 | 884.67 | 775 | 755 | 143.5 |
| B | 0 | 189 | 104865 | 725.73 | 775 | 755 | 143.5 |
| B | 15 | 35 | 65599 | 452.01 | 775 | 755 | 143.5 |
| C | 3 | 233 | 409539 | 2348.41 | 759 | 766 | 174.1 |
| C | 14 | 238 | 117203 | 668.93 | 759 | 766 | 174.1 |
| C | 7 | 247 | 17484 | 96.05 | 759 | 766 | 174.1 |
| D | 5 | 222 | 258353 | 1403.06 | 765 | 744 | 183.6 |
| D | 10 | 70 | 127597 | 690.9 | 765 | 744 | 183.6 |
| D | 1 | 52 | 87145 | 470.58 | 765 | 744 | 183.6 |
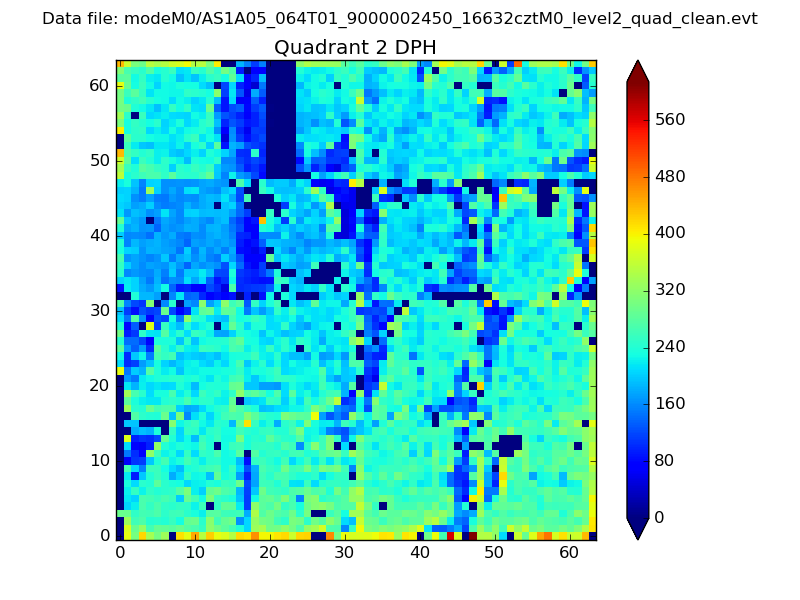
Histogram calculated using DETX and DETY for each event in the final _common_clean file
| Quadrant A | 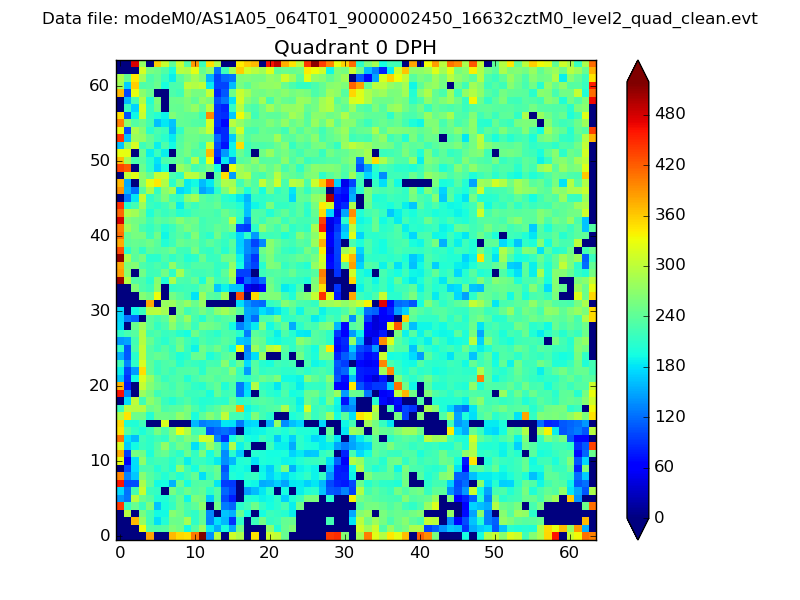 |
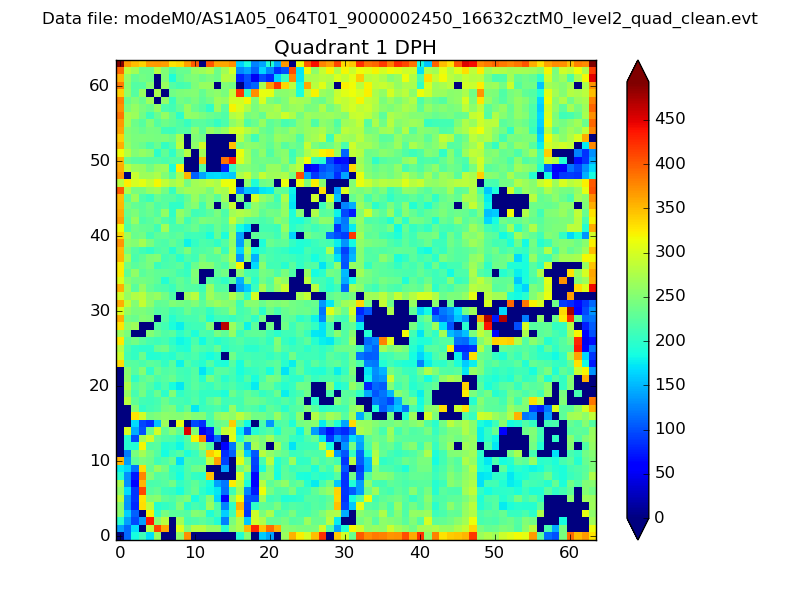 |
Quadrant B |
|---|---|---|---|
| Quadrant D | 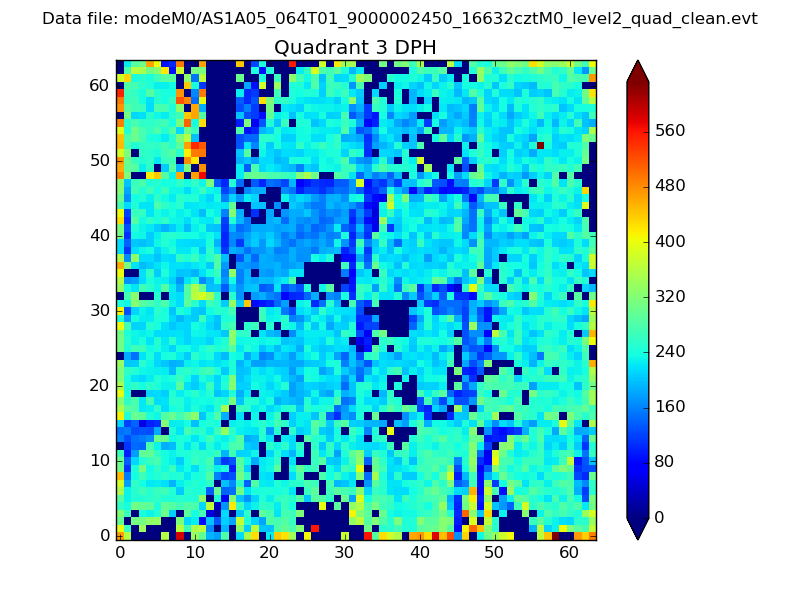 |
 |
Quadrant C |
| Plot type | Count rate plots | Images |
|---|---|---|
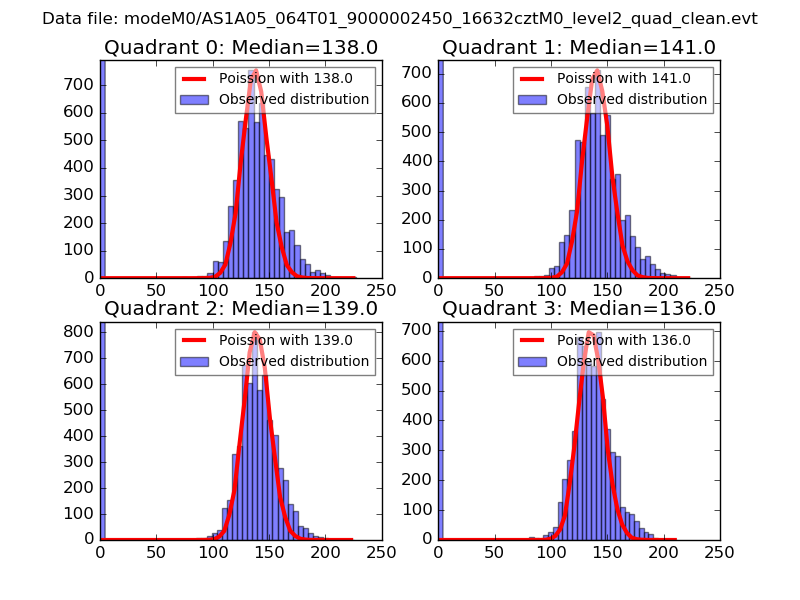
| Comparison with Poisson distribution Blue bars denote a histogram of data divided into 1 sec bins. Red curve is a Poisson curve with rate = median count rate of data. |
 |
 |
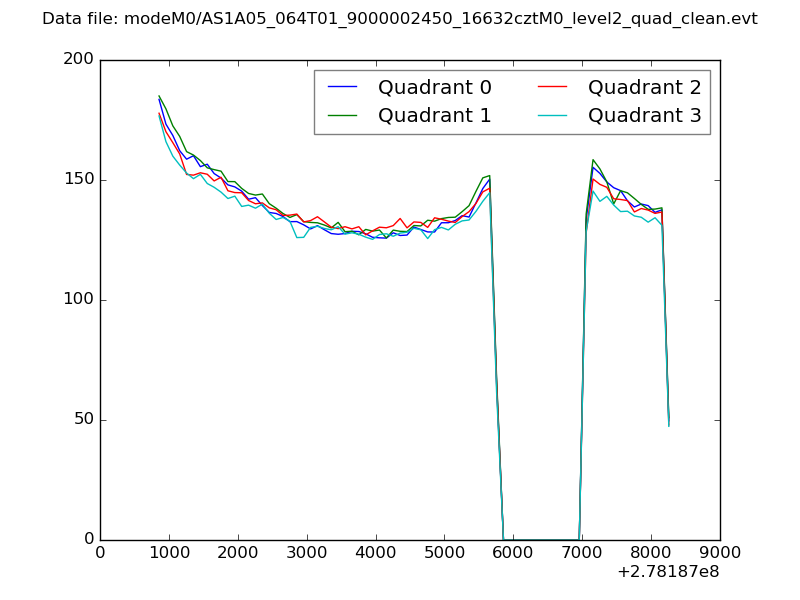
| Quadrant-wise count rates Data is divided into 100 sec bins |
 |
|
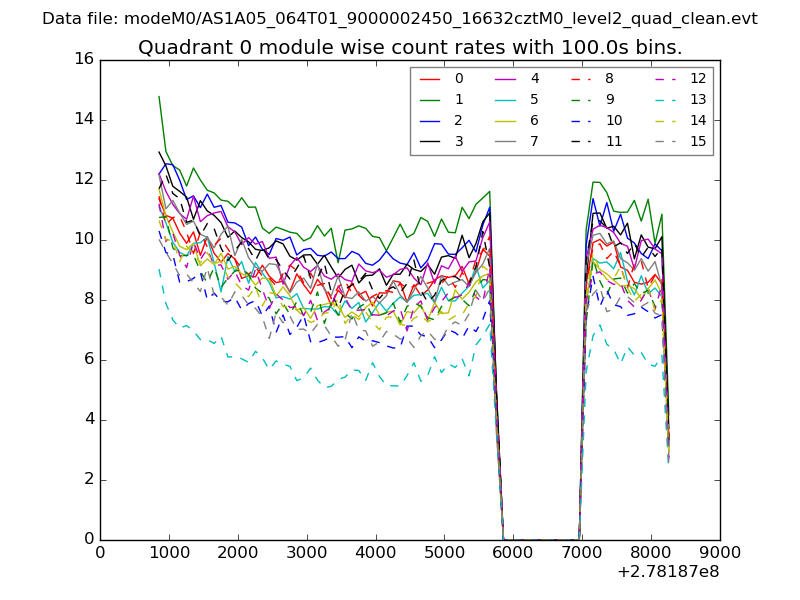
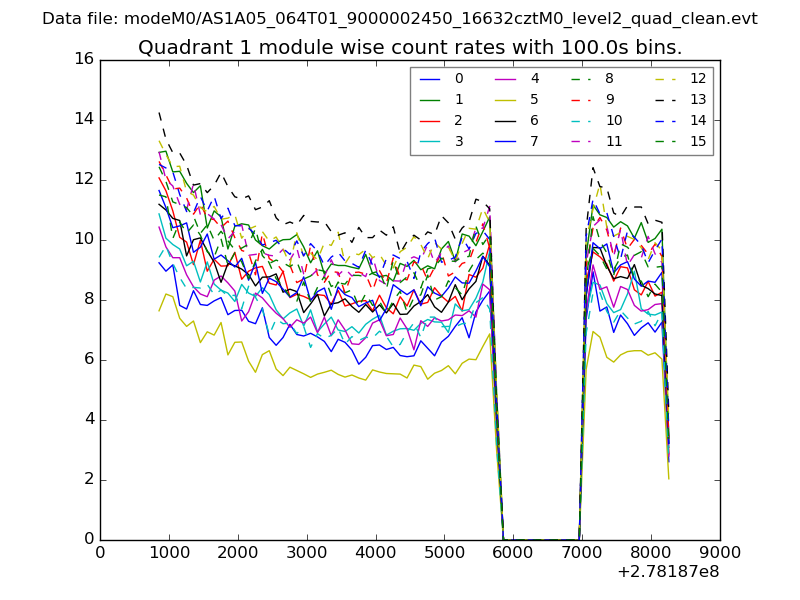
| Module-wise count rates for Quadrant A Data is divided into 100 sec bins |
 |
 |
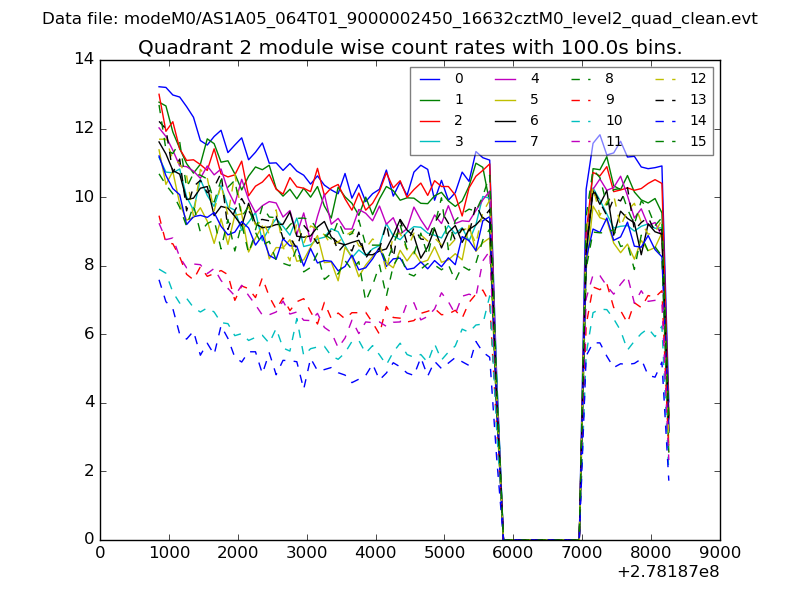
| Module-wise count rates for Quadrant B Data is divided into 100 sec bins |
 |
 |
| Module-wise count rates for Quadrant C Data is divided into 100 sec bins |
 |
 |
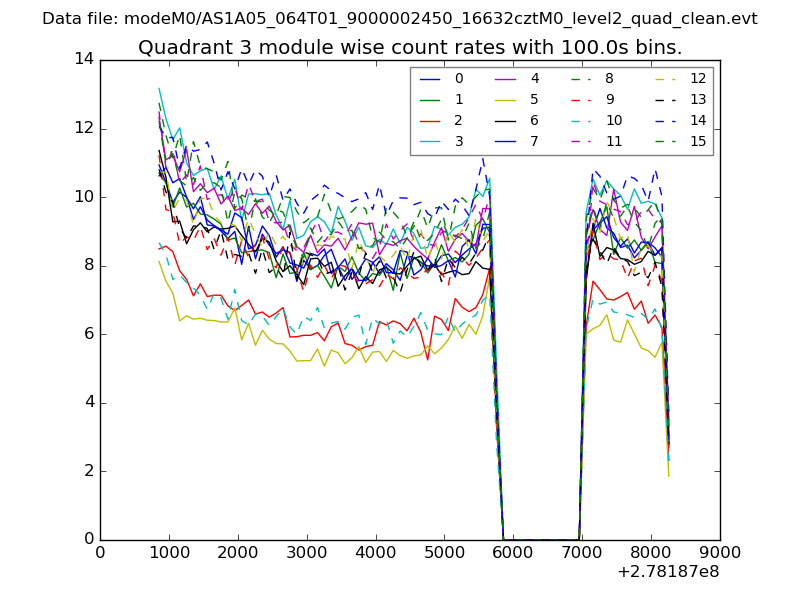
| Module-wise count rates for Quadrant D Data is divided into 100 sec bins |
 |
 |
| Parameter | Plot |
|---|---|
| CZT HV Monitor | 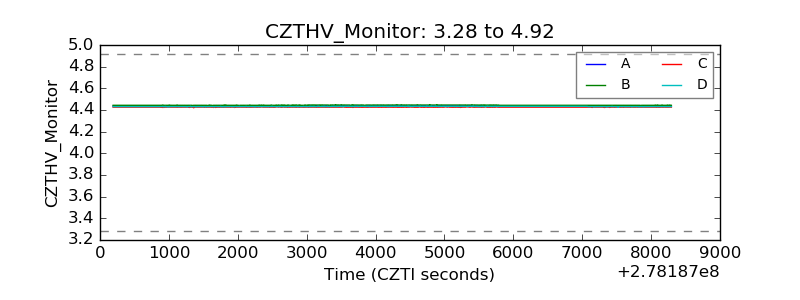 |
| D_VDD | 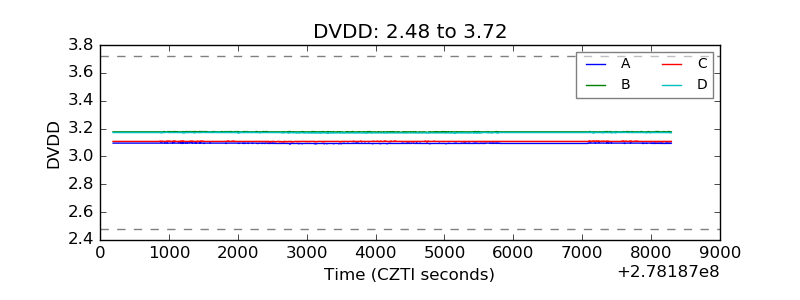 |
| Temperature 1 | 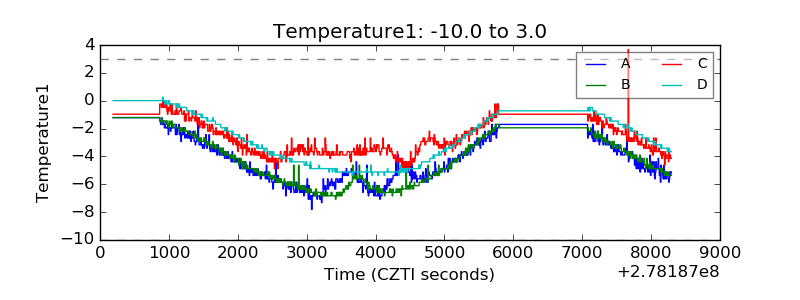 |
| Veto HV Monitor | 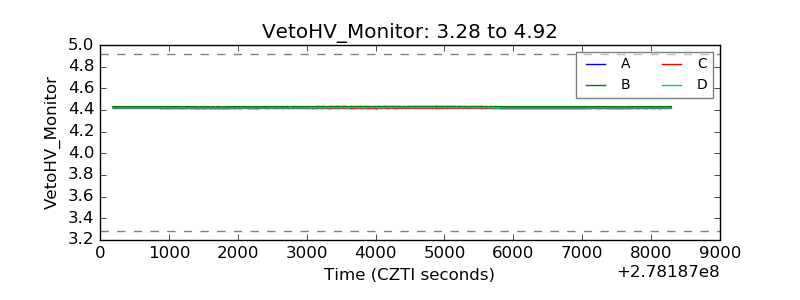 |
| Veto LLD | 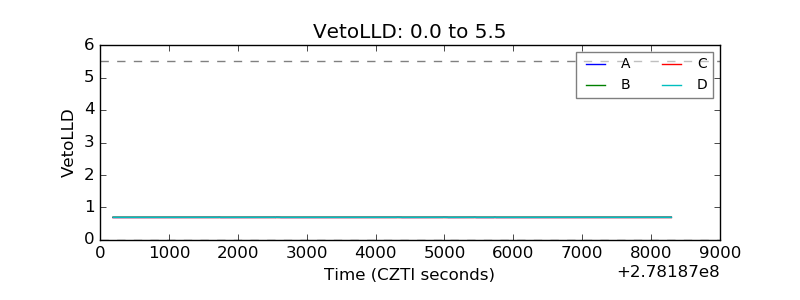 |
| Alpha Counter | 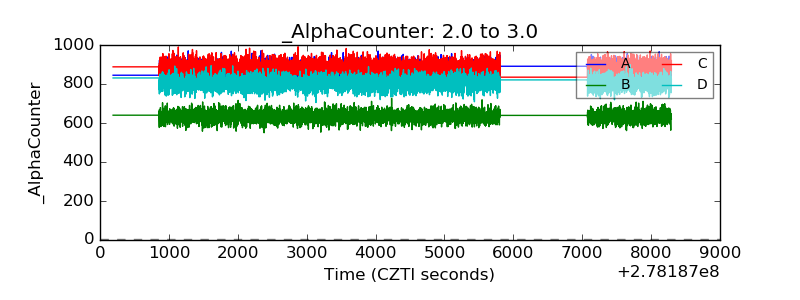 |
| _CPM_Rate | 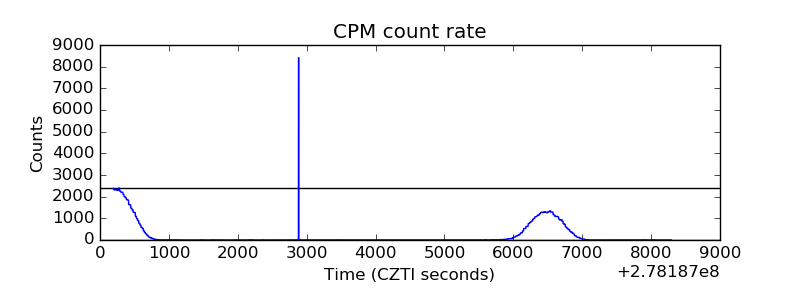 |
| CZT Counter | 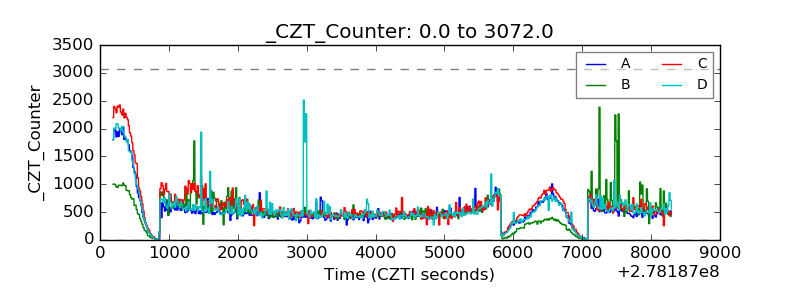 |
| +2.5 Volts monitor |  |
| +5 Volts monitor |  |
| _ROLL_ROT | 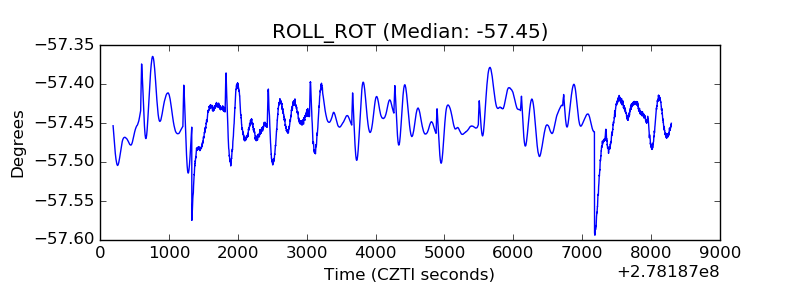 |
| _Roll_DEC | 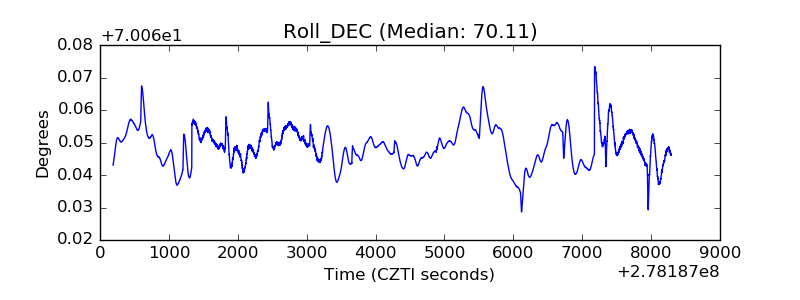 |
| _Roll_RA | 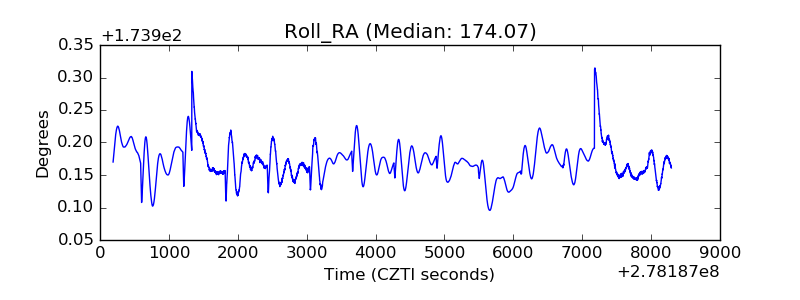 |
| Veto Counter | 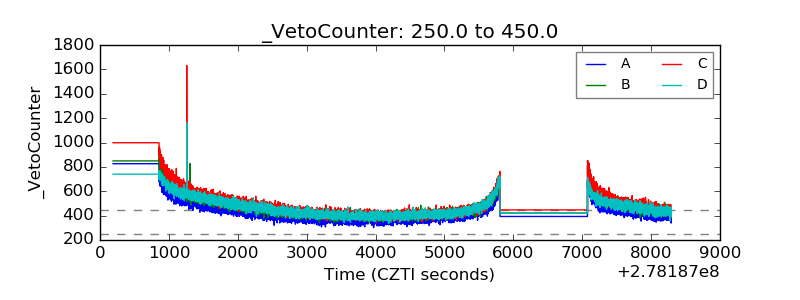 |