| Param | Original file | Final file |
|---|---|---|
| Filename | modeM0/AS1A05_002T07_9000002458_16649cztM0_level2.evt | modeM0/AS1A05_002T07_9000002458_16649cztM0_level2_quad_clean.evt |
| Size (bytes) | 65,018,880 | 16,038,720 |
| Size | 62.0 MB | 15.3 MB |
| Events in quadrant A | 435,021 | 106,035 |
| Events in quadrant B | 554,447 | 107,934 |
| Events in quadrant C | 435,594 | 103,886 |
| Events in quadrant D | 482,643 | 100,300 |
| Mode M9 | |||
|---|---|---|---|
| Quadrant | BADHDUFLAG | Total packets | Discarded packets |
| A | 0 | 8 | 0 |
| B | 0 | 8 | 0 |
| C | 0 | 8 | 0 |
| D | 0 | 8 | 0 |
| Mode SS | |||
|---|---|---|---|
| Quadrant | BADHDUFLAG | Total packets | Discarded packets |
| A | 0 | 20 | 0 |
| B | 0 | 20 | 0 |
| C | 0 | 20 | 0 |
| D | 0 | 20 | 0 |
| Mode M0 | |||
|---|---|---|---|
| Quadrant | BADHDUFLAG | Total packets | Discarded packets |
| A | 0 | 1852 | 1 |
| B | 0 | 2205 | 1 |
| C | 0 | 1834 | 1 |
| D | 0 | 2027 | 1 |
| Quadrant | Total seconds | Saturated seconds | Saturation percentage |
|---|---|---|---|
| A | 850 | 12 | 1.411765% |
| B | 850 | 70 | 8.235294% |
| C | 850 | 21 | 2.470588% |
| D | 850 | 22 | 2.588235% |
Noise dominated data is calculated using 1-second bins in cleaned event files. If a bin has >2000 counts, and if more than 50% of those come from <1% of pixels, then it is considered to be noise-dominated and hence unusable.
| Quadrant | # 1 sec bins | Bins with >0 counts | Bins with >2000 counts | High rate bins dominated by noise | Noise dominated (total time) | Noise dominated (detector-on time) | Marked lightcurve |
|---|---|---|---|---|---|---|---|
| A | 1691 | 852 | 0 | 0 | 0.00% | 0.00% | 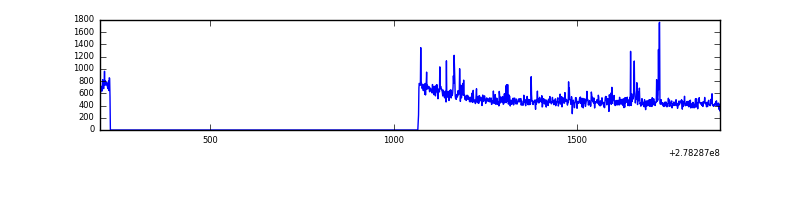 |
| B | 1691 | 852 | 7 | 7 | 0.41% | 0.82% | 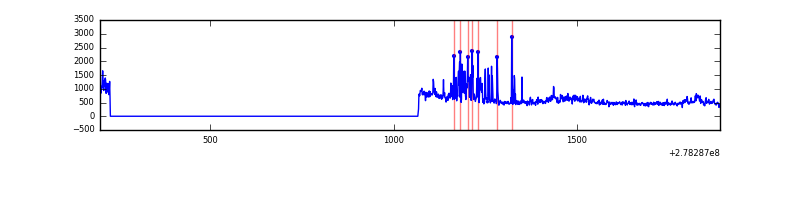 |
| C | 1691 | 852 | 0 | 0 | 0.00% | 0.00% | 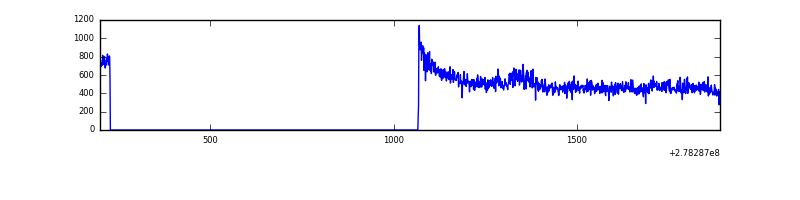 |
| D | 1691 | 852 | 12 | 12 | 0.71% | 1.41% | 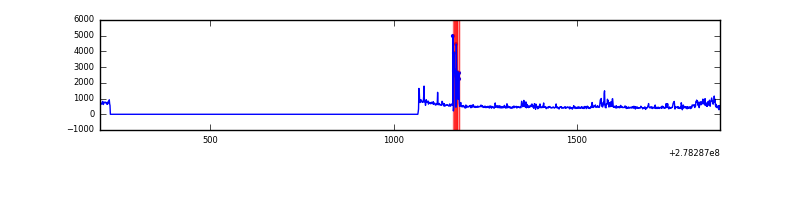 |
Top three noisy pixels from each quadrant. If the there are fewer than three noisy pixels in the level2.evt file, extra rows are filled as -1
| Pixel properties | Quadrant properties | ||||||
|---|---|---|---|---|---|---|---|
| Quadrant | DetID | PixID | Counts | Sigma | Mean | Median | Sigma |
| A | 3 | 1 | 12655 | 533.12 | 106 | 103 | 23.5 |
| A | 12 | 96 | 10189 | 428.38 | 106 | 103 | 23.5 |
| A | 15 | 9 | 1070 | 41.07 | 106 | 103 | 23.5 |
| B | 15 | 35 | 87242 | 3777.76 | 107 | 104 | 23.1 |
| B | 0 | 189 | 16430 | 707.79 | 107 | 104 | 23.1 |
| B | 0 | 198 | 14212 | 611.63 | 107 | 104 | 23.1 |
| C | 3 | 233 | 27048 | 1066.4 | 100 | 100 | 25.3 |
| C | 14 | 238 | 16119 | 633.91 | 100 | 100 | 25.3 |
| C | 13 | 61 | 692 | 23.43 | 100 | 100 | 25.3 |
| D | 15 | 0 | 38829 | 1502.53 | 98 | 95 | 25.8 |
| D | 5 | 222 | 31124 | 1203.64 | 98 | 95 | 25.8 |
| D | 1 | 52 | 20496 | 791.37 | 98 | 95 | 25.8 |
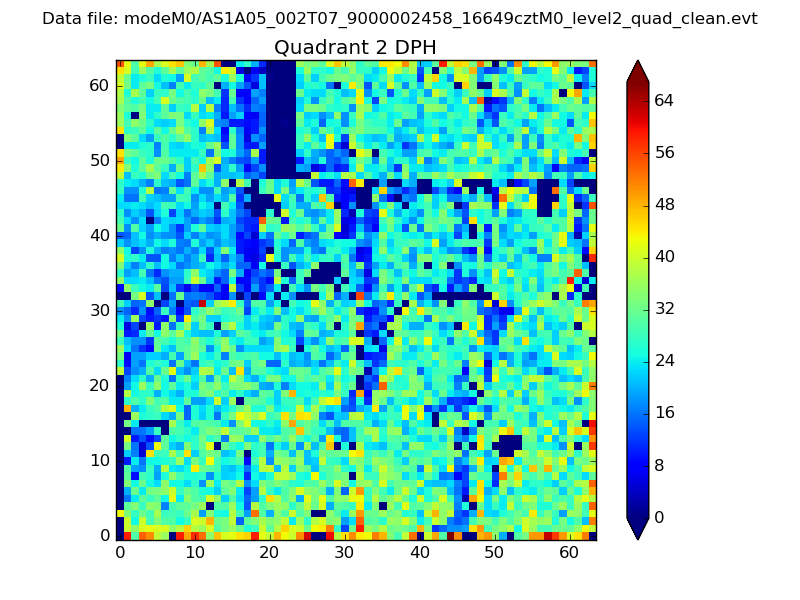
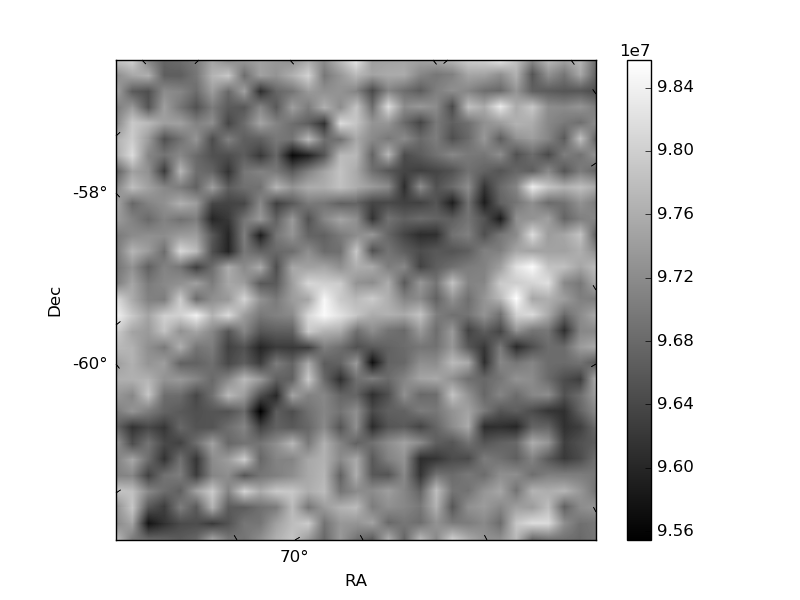
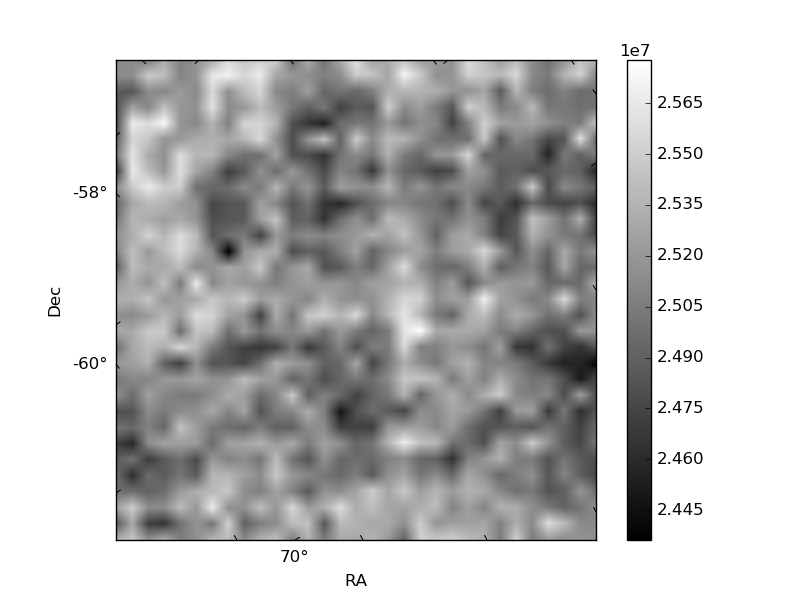
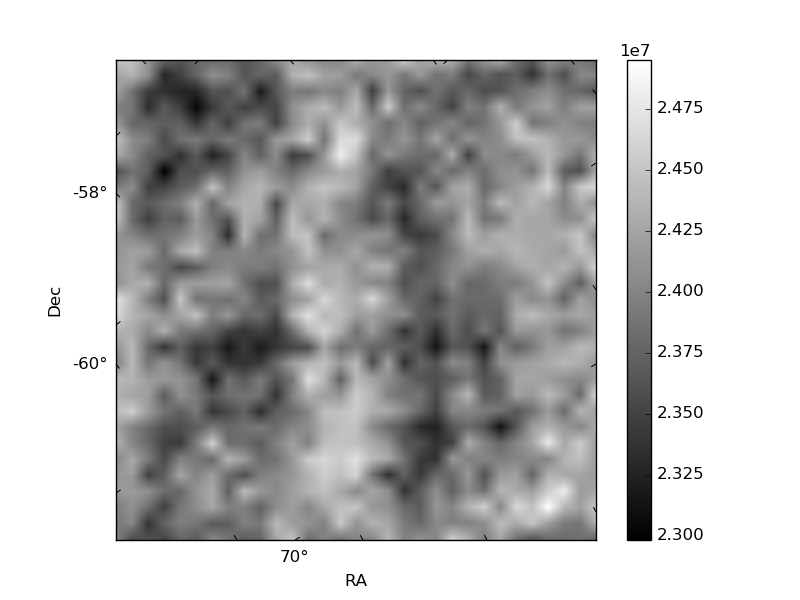
Histogram calculated using DETX and DETY for each event in the final _common_clean file
| Quadrant A | 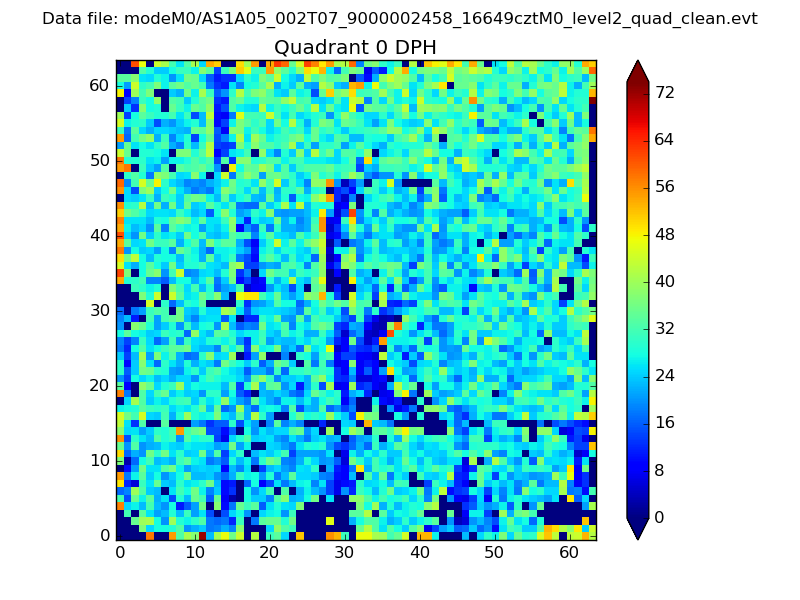 |
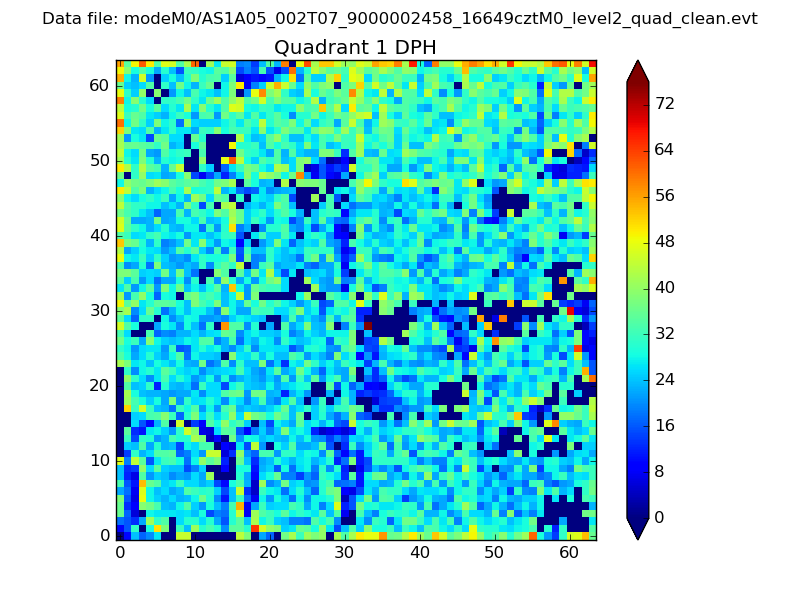 |
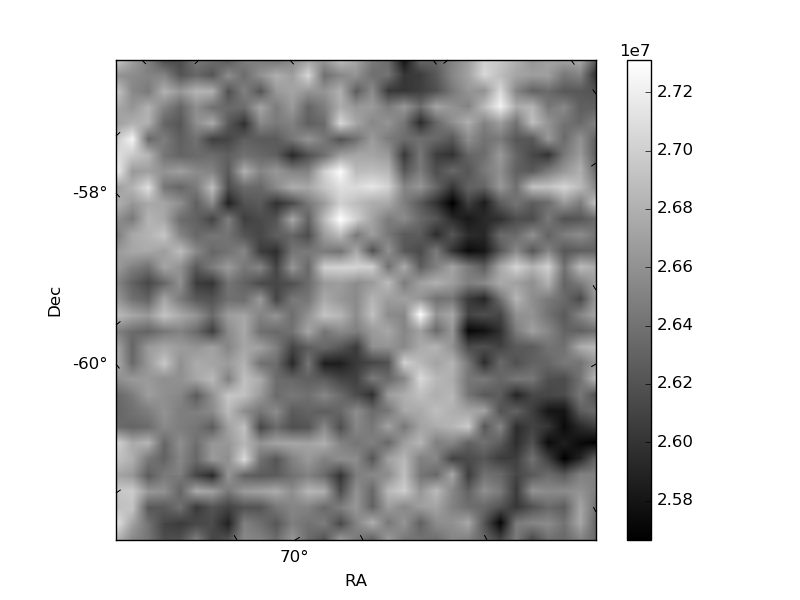
Quadrant B |
|---|---|---|---|
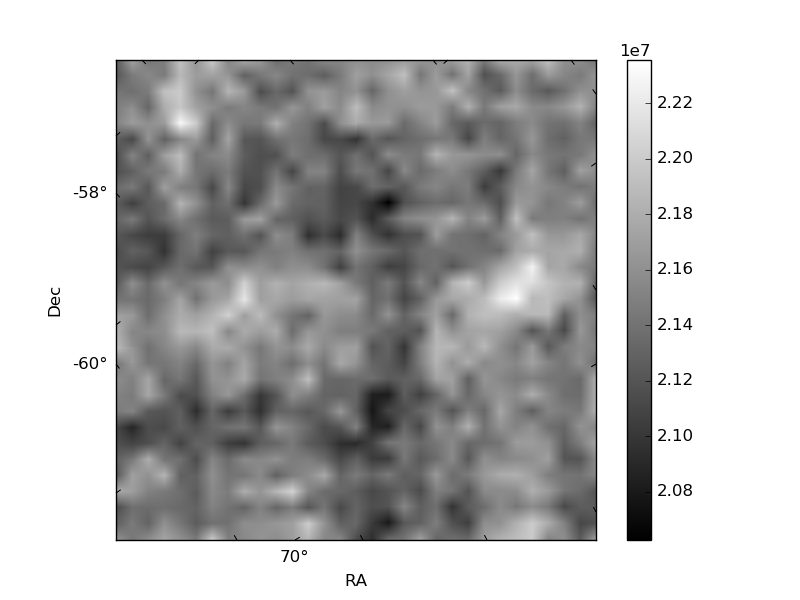
| Quadrant D | 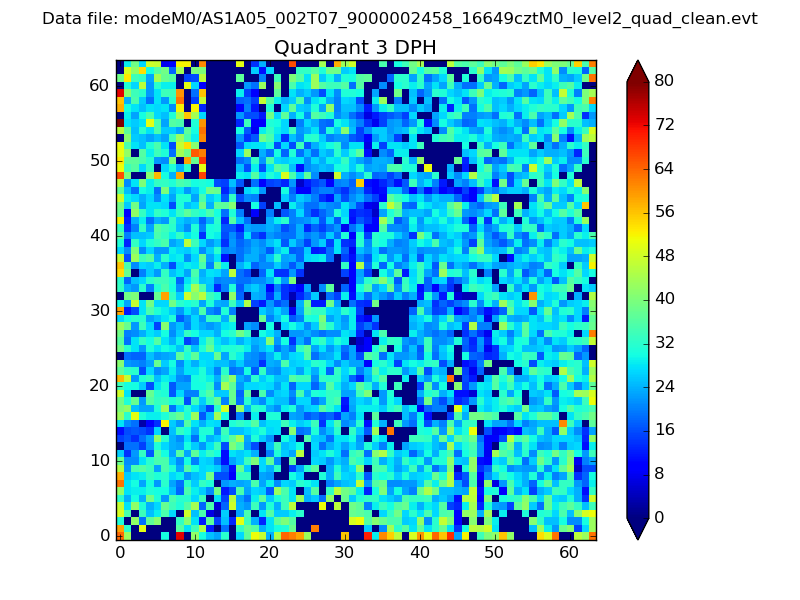 |
 |
Quadrant C |
| Plot type | Count rate plots | Images |
|---|---|---|
| Comparison with Poisson distribution Blue bars denote a histogram of data divided into 1 sec bins. Red curve is a Poisson curve with rate = median count rate of data. |
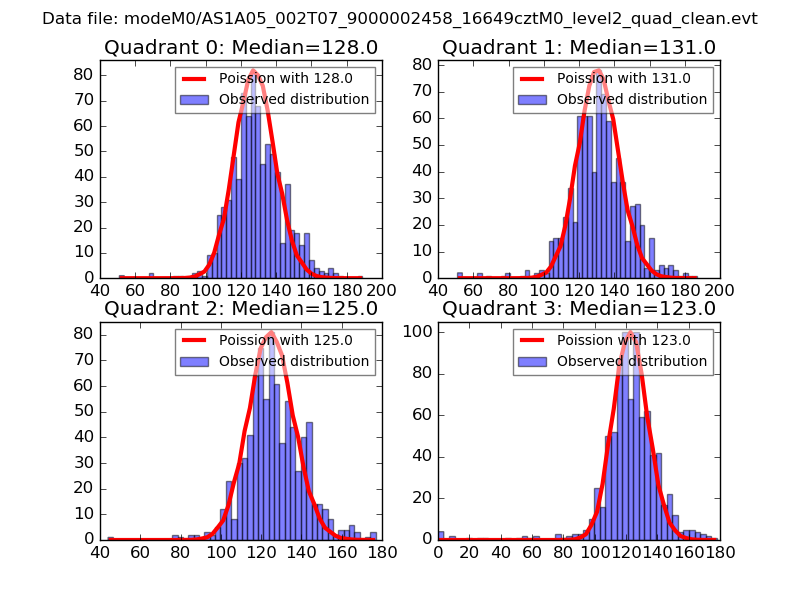 |
 |
| Quadrant-wise count rates Data is divided into 100 sec bins |
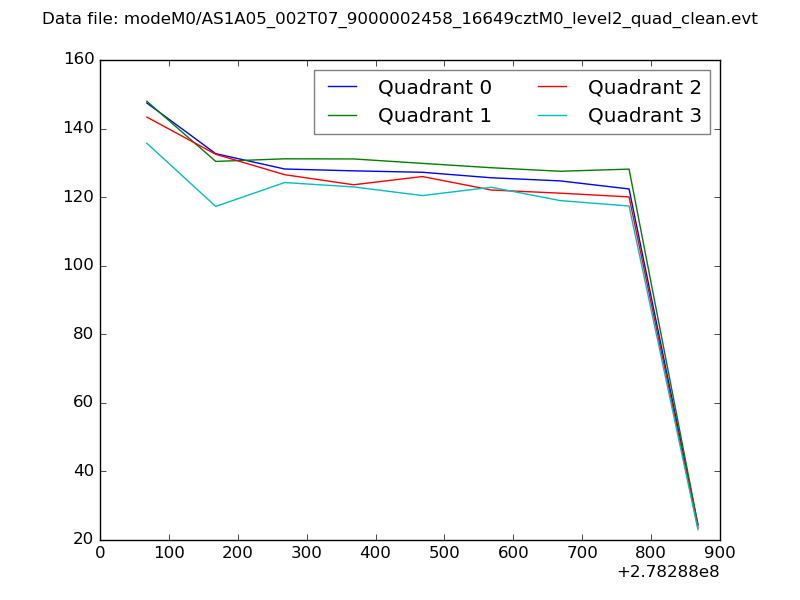 |
|
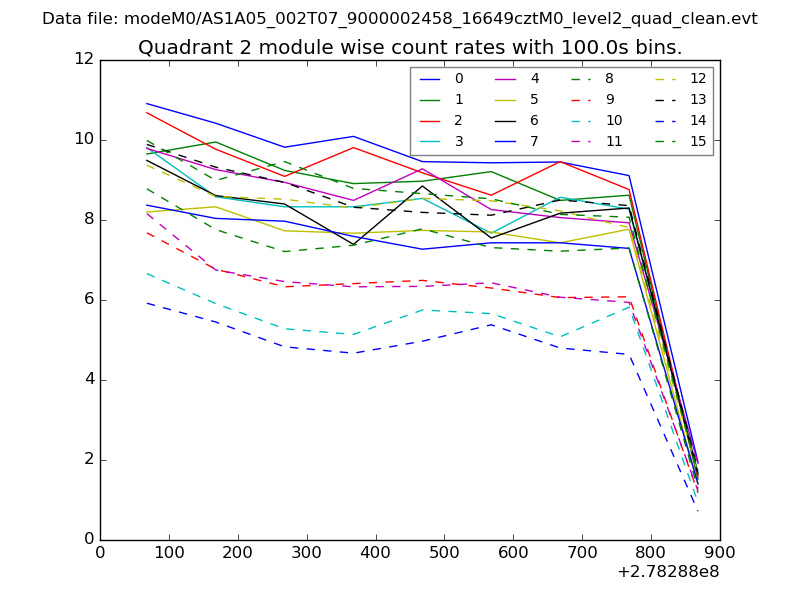
| Module-wise count rates for Quadrant A Data is divided into 100 sec bins |
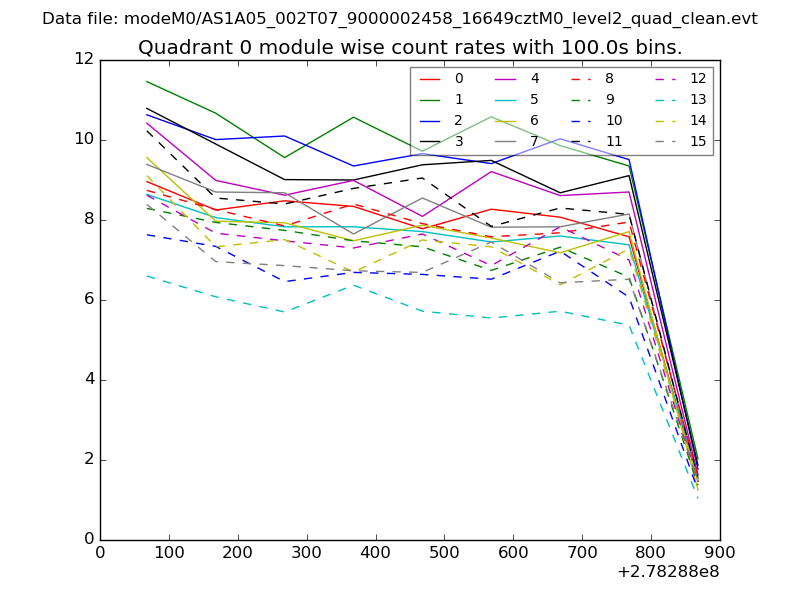 |
 |
| Module-wise count rates for Quadrant B Data is divided into 100 sec bins |
 |
 |
| Module-wise count rates for Quadrant C Data is divided into 100 sec bins |
 |
 |
| Module-wise count rates for Quadrant D Data is divided into 100 sec bins |
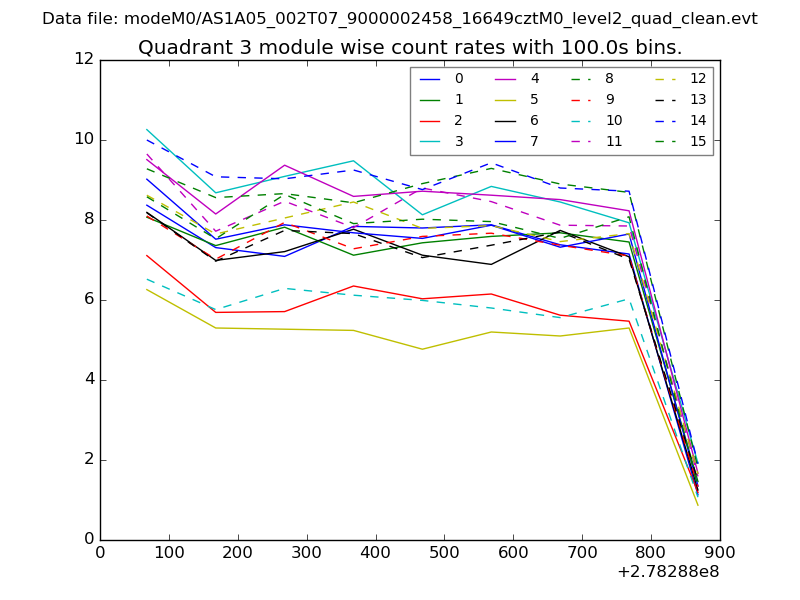 |
 |
| Parameter | Plot |
|---|---|
| CZT HV Monitor | 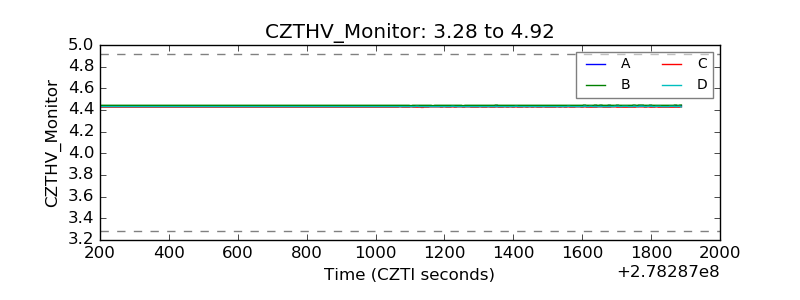 |
| D_VDD | 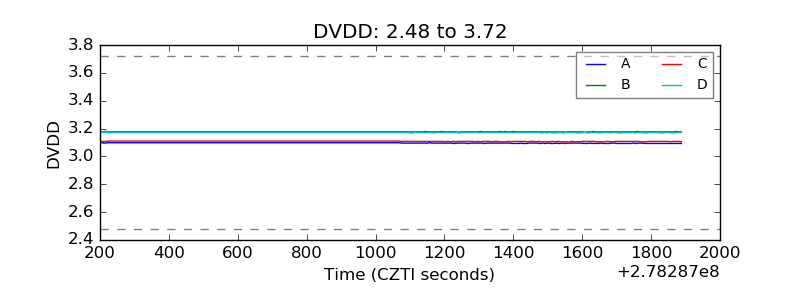 |
| Temperature 1 | 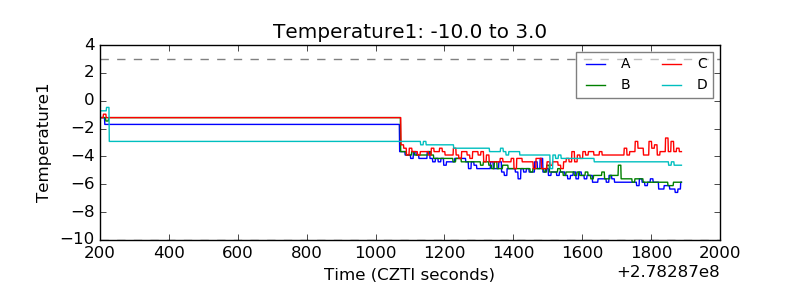 |
| Veto HV Monitor | 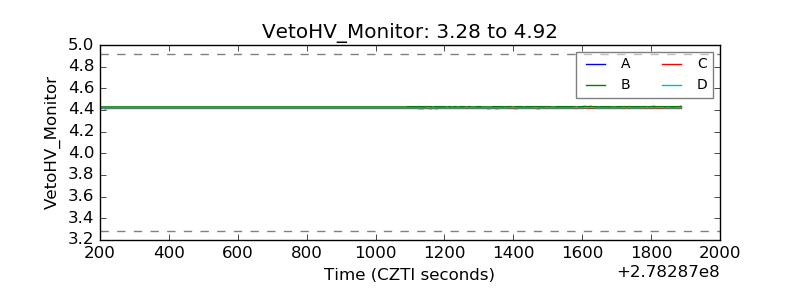 |
| Veto LLD | 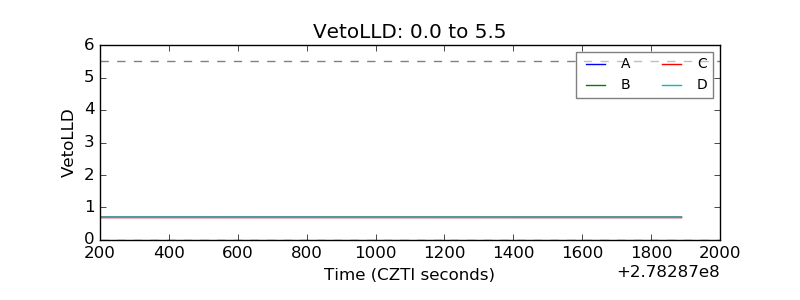 |
| Alpha Counter | 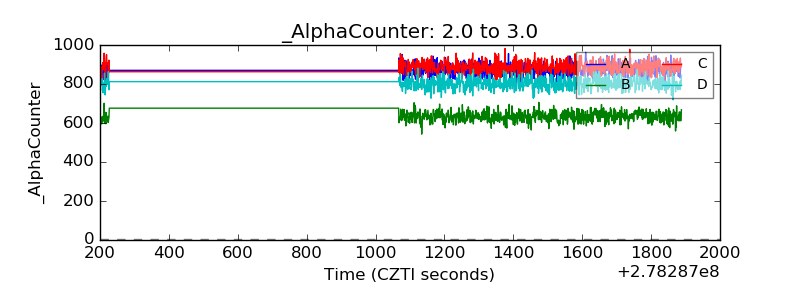 |
| _CPM_Rate | 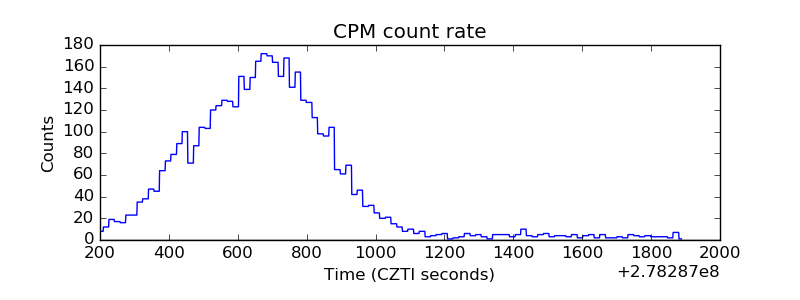 |
| CZT Counter | 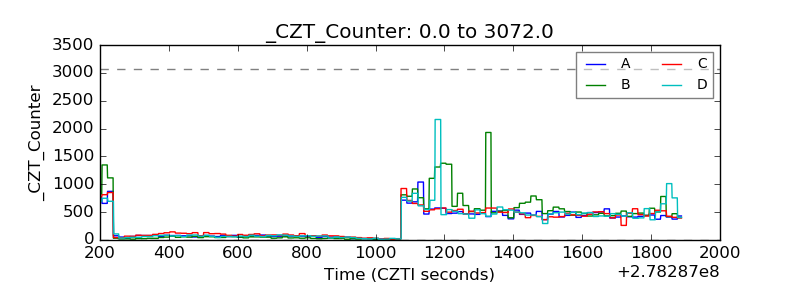 |
| +2.5 Volts monitor |  |
| +5 Volts monitor |  |
| _ROLL_ROT | 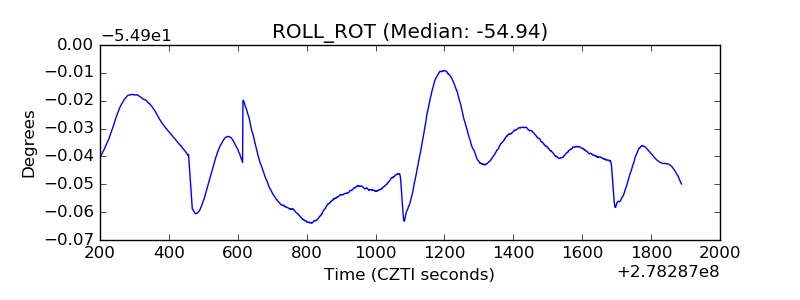 |
| _Roll_DEC |  |
| _Roll_RA | 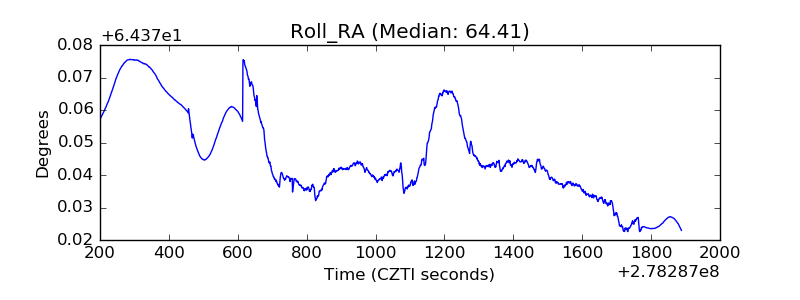 |
| Veto Counter | 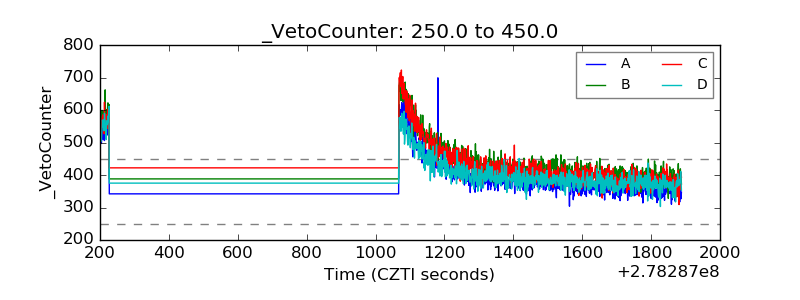 |