| Param | Original file | Final file |
|---|---|---|
| Filename | modeM0/AS1A05_002T09_9000002456cztM0_level2.fits | modeM0/AS1A05_002T09_9000002456cztM0_level2_quad_clean.evt |
| Size (bytes) | 83,931,840 | 76,023,360 |
| Size | 80.0 MB | 72.5 MB |
| Events in quadrant A | 535,292 | 466,600 |
| Events in quadrant B | 517,236 | 471,293 |
| Events in quadrant C | 507,906 | 428,212 |
| Events in quadrant D | 447,454 | 401,191 |
| Mode M0 | |||
|---|---|---|---|
| Quadrant | BADHDUFLAG | Total packets | Discarded packets |
| A | 0 | 16691 | 0 |
| B | 0 | 18571 | 0 |
| C | 0 | 18554 | 0 |
| D | 0 | 17216 | 0 |
| Mode M9 | |||
|---|---|---|---|
| Quadrant | BADHDUFLAG | Total packets | Discarded packets |
| A | 0 | 22 | 0 |
| B | 0 | 22 | 0 |
| C | 0 | 22 | 0 |
| D | 0 | 22 | 0 |
| Mode SS | |||
|---|---|---|---|
| Quadrant | BADHDUFLAG | Total packets | Discarded packets |
| A | 0 | 156 | 0 |
| B | 0 | 156 | 0 |
| C | 0 | 156 | 0 |
| D | 0 | 156 | 0 |
| Quadrant | Total seconds | Saturated seconds | Saturation percentage |
|---|---|---|---|
| A | 7682 | 91 | 1.184587% |
| B | 7682 | 175 | 2.278053% |
| C | 7682 | 147 | 1.913564% |
| D | 7682 | 93 | 1.210622% |
Noise dominated data is calculated using 1-second bins in cleaned event files. If a bin has >2000 counts, and if more than 50% of those come from <1% of pixels, then it is considered to be noise-dominated and hence unusable.
| Quadrant | # 1 sec bins | Bins with >0 counts | Bins with >2000 counts | High rate bins dominated by noise | Noise dominated (total time) | Noise dominated (detector-on time) | Marked lightcurve |
|---|---|---|---|---|---|---|---|
| A | 9021 | 7681 | 0 | 0 | 0.00% | 0.00% |  |
| B | 9021 | 7681 | 0 | 0 | 0.00% | 0.00% |  |
| C | 9021 | 7681 | 0 | 0 | 0.00% | 0.00% | 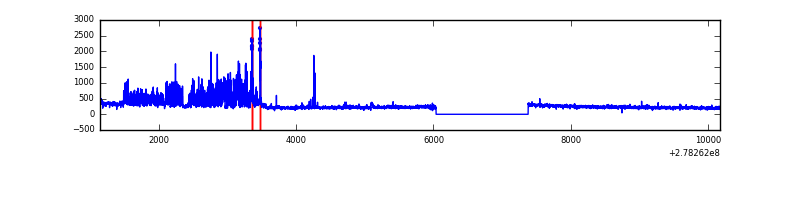 |
| D | 9021 | 7681 | 0 | 0 | 0.00% | 0.00% |  |
Top three noisy pixels from each quadrant. If the there are fewer than three noisy pixels in the level2.evt file, extra rows are filled as -1
| Pixel properties | Quadrant properties | ||||||
|---|---|---|---|---|---|---|---|
| Quadrant | DetID | PixID | Counts | Sigma | Mean | Median | Sigma |
| A | 0 | 29 | 471 | 9.63 | 139 | 133 | 35.1 |
| A | 7 | 110 | 439 | 8.72 | 139 | 133 | 35.1 |
| A | 9 | 19 | 434 | 8.58 | 139 | 133 | 35.1 |
| B | 2 | 9 | 448 | 11.28 | 136 | 132 | 28.0 |
| B | 2 | 8 | 382 | 8.93 | 136 | 132 | 28.0 |
| B | 5 | 128 | 361 | 8.18 | 136 | 132 | 28.0 |
| C | 3 | 202 | 386 | 7.13 | 134 | 127 | 36.3 |
| C | 1 | 81 | 370 | 6.69 | 134 | 127 | 36.3 |
| C | 3 | 203 | 360 | 6.41 | 134 | 127 | 36.3 |
| D | 6 | 231 | 339 | 6.38 | 127 | 117 | 34.8 |
| D | 6 | 67 | 327 | 6.03 | 127 | 117 | 34.8 |
| D | 3 | 159 | 311 | 5.58 | 127 | 117 | 34.8 |
Histogram calculated using DETX and DETY for each event in the final _common_clean file
| Quadrant A |  |
 |
Quadrant B |
|---|---|---|---|
| Quadrant D |  |
 |
Quadrant C |
| Plot type | Count rate plots | Images |
|---|---|---|
| Comparison with Poisson distribution Blue bars denote a histogram of data divided into 1 sec bins. Red curve is a Poisson curve with rate = median count rate of data. |
 |
 |
| Quadrant-wise count rates Data is divided into 100 sec bins |
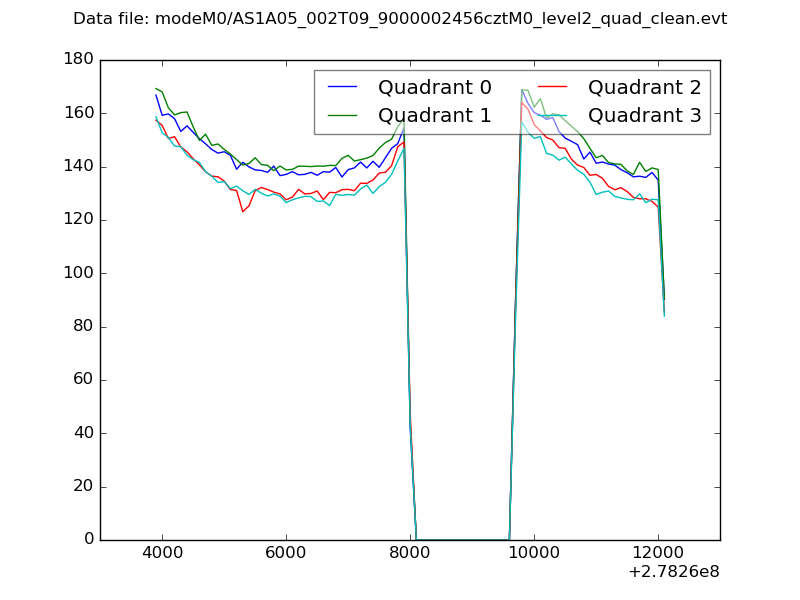 |
|
| Module-wise count rates for Quadrant A Data is divided into 100 sec bins |
 |
 |
| Module-wise count rates for Quadrant B Data is divided into 100 sec bins |
 |
 |
| Module-wise count rates for Quadrant C Data is divided into 100 sec bins |
 |
 |
| Module-wise count rates for Quadrant D Data is divided into 100 sec bins |
 |
 |
| Parameter | Plot |
|---|---|
| CZT HV Monitor |  |
| D_VDD |  |
| Temperature 1 |  |
| Veto HV Monitor |  |
| Veto LLD |  |
| Alpha Counter |  |
| _CPM_Rate |  |
| CZT Counter |  |
| +2.5 Volts monitor |  |
| +5 Volts monitor |  |
| _ROLL_ROT | 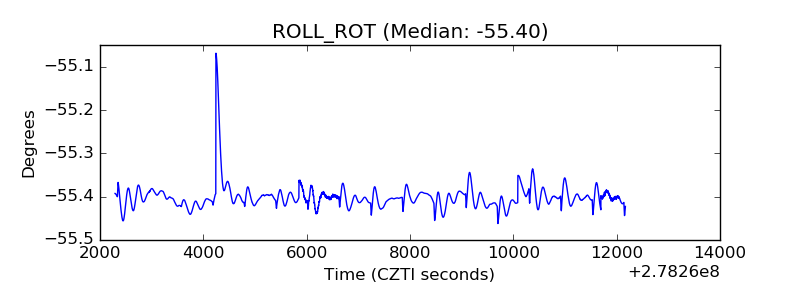 |
| _Roll_DEC |  |
| _Roll_RA |  |
| Veto Counter |  |