| Param | Original file | Final file |
|---|---|---|
| Filename | modeM0/AS1A05_002T09_9000002456_16644cztM0_level2.evt | modeM0/AS1A05_002T09_9000002456_16644cztM0_level2_quad_clean.evt |
| Size (bytes) | 131,808,960 | 18,996,480 |
| Size | 125.7 MB | 18.1 MB |
| Events in quadrant A | 876,555 | 117,873 |
| Events in quadrant B | 991,032 | 120,943 |
| Events in quadrant C | 1,136,261 | 112,093 |
| Events in quadrant D | 883,308 | 112,309 |
| Mode M0 | |||
|---|---|---|---|
| Quadrant | BADHDUFLAG | Total packets | Discarded packets |
| A | 0 | 3622 | 2 |
| B | 0 | 4014 | 1 |
| C | 0 | 4515 | 1 |
| D | 0 | 3599 | 1 |
| Mode M9 | |||
|---|---|---|---|
| Quadrant | BADHDUFLAG | Total packets | Discarded packets |
| A | 0 | 9 | 0 |
| B | 0 | 9 | 0 |
| C | 0 | 9 | 0 |
| D | 0 | 9 | 0 |
| Mode SS | |||
|---|---|---|---|
| Quadrant | BADHDUFLAG | Total packets | Discarded packets |
| A | 0 | 30 | 0 |
| B | 0 | 30 | 0 |
| C | 0 | 30 | 0 |
| D | 0 | 30 | 0 |
| Quadrant | Total seconds | Saturated seconds | Saturation percentage |
|---|---|---|---|
| A | 1505 | 9 | 0.598007% |
| B | 1505 | 9 | 0.598007% |
| C | 1505 | 36 | 2.392027% |
| D | 1505 | 12 | 0.797342% |
Noise dominated data is calculated using 1-second bins in cleaned event files. If a bin has >2000 counts, and if more than 50% of those come from <1% of pixels, then it is considered to be noise-dominated and hence unusable.
| Quadrant | # 1 sec bins | Bins with >0 counts | Bins with >2000 counts | High rate bins dominated by noise | Noise dominated (total time) | Noise dominated (detector-on time) | Marked lightcurve |
|---|---|---|---|---|---|---|---|
| A | 1506 | 1506 | 0 | 0 | 0.00% | 0.00% | 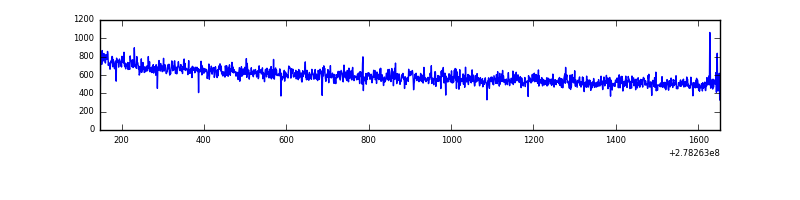 |
| B | 1506 | 1506 | 2 | 2 | 0.13% | 0.13% | 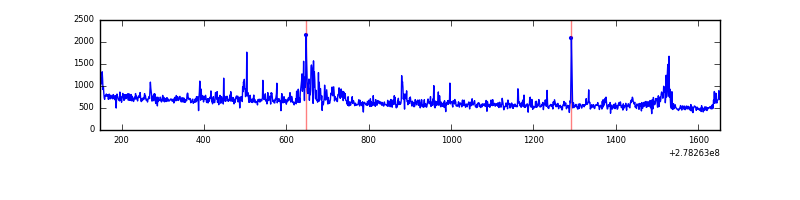 |
| C | 1506 | 1506 | 0 | 0 | 0.00% | 0.00% | 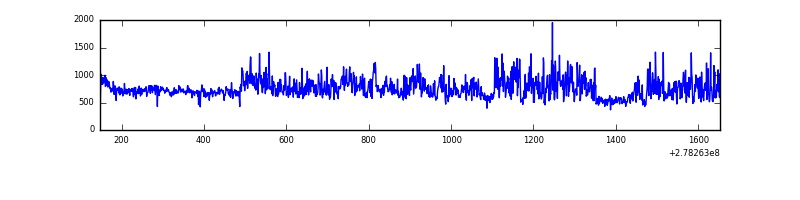 |
| D | 1506 | 1506 | 6 | 6 | 0.40% | 0.40% | 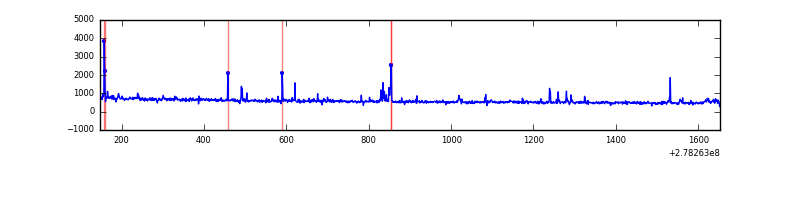 |
Top three noisy pixels from each quadrant. If the there are fewer than three noisy pixels in the level2.evt file, extra rows are filled as -1
| Pixel properties | Quadrant properties | ||||||
|---|---|---|---|---|---|---|---|
| Quadrant | DetID | PixID | Counts | Sigma | Mean | Median | Sigma |
| A | 12 | 96 | 2552 | 50.28 | 226 | 223 | 46.3 |
| A | 0 | 226 | 2033 | 39.07 | 226 | 223 | 46.3 |
| A | 12 | 194 | 1727 | 32.47 | 226 | 223 | 46.3 |
| B | 15 | 35 | 65570 | 1526.5 | 224 | 220 | 42.8 |
| B | 0 | 198 | 22331 | 516.49 | 224 | 220 | 42.8 |
| B | 0 | 189 | 15837 | 364.8 | 224 | 220 | 42.8 |
| C | 7 | 247 | 256940 | 5293.7 | 207 | 209 | 48.5 |
| C | 14 | 238 | 35169 | 720.86 | 207 | 209 | 48.5 |
| C | 3 | 233 | 33419 | 684.78 | 207 | 209 | 48.5 |
| D | 1 | 52 | 19741 | 362.52 | 215 | 208 | 53.9 |
| D | 10 | 70 | 14256 | 260.72 | 215 | 208 | 53.9 |
| D | 2 | 33 | 13506 | 246.8 | 215 | 208 | 53.9 |
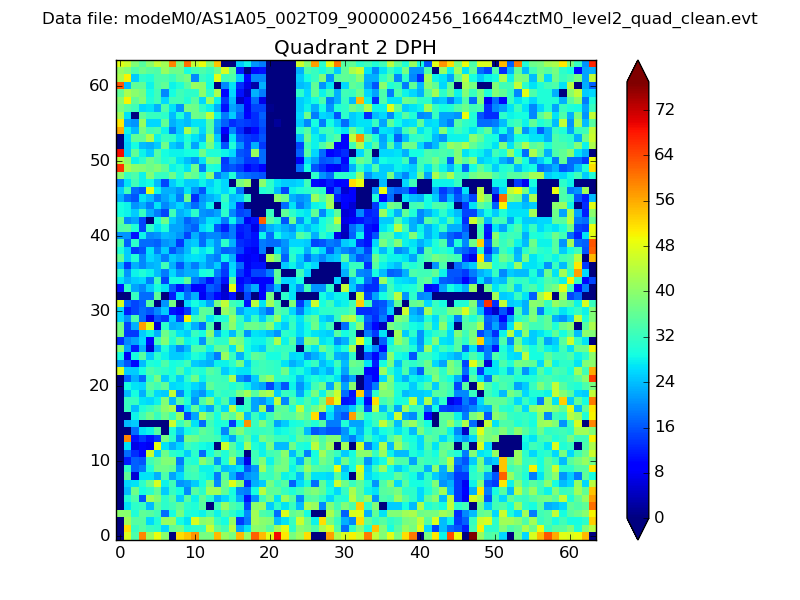
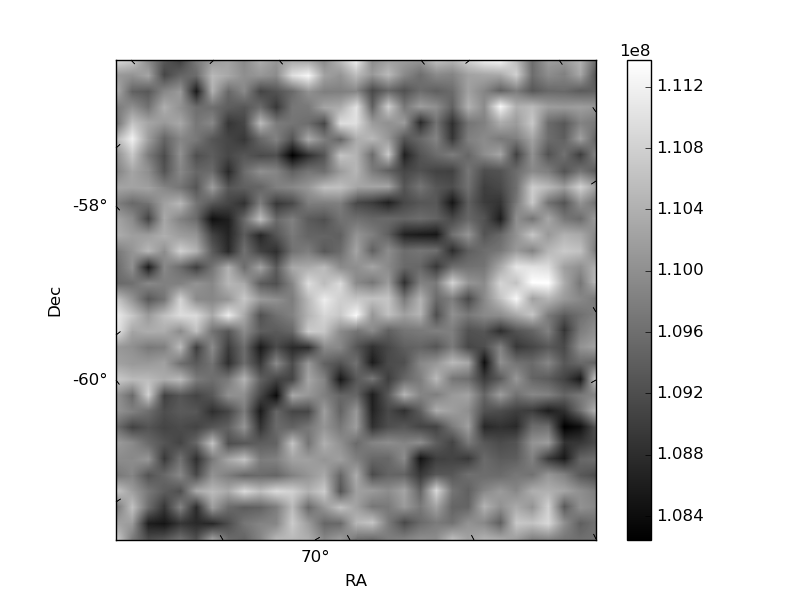
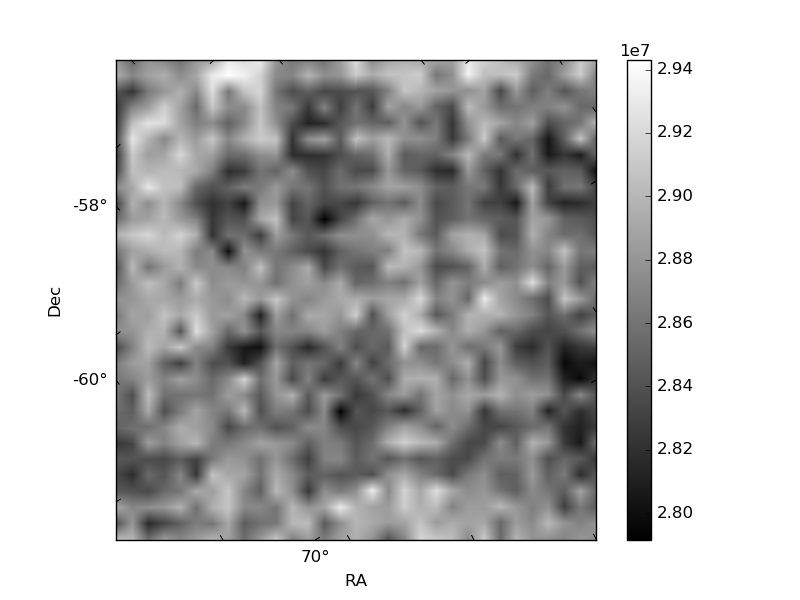
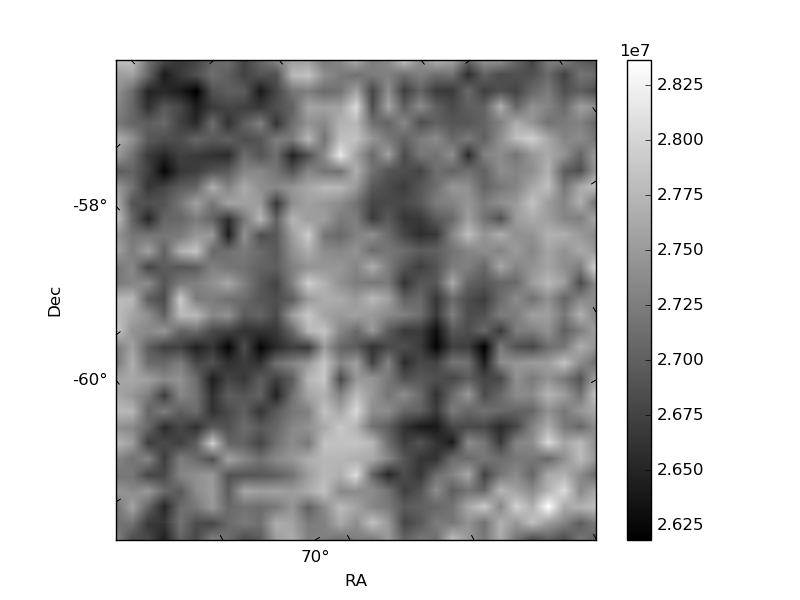
Histogram calculated using DETX and DETY for each event in the final _common_clean file
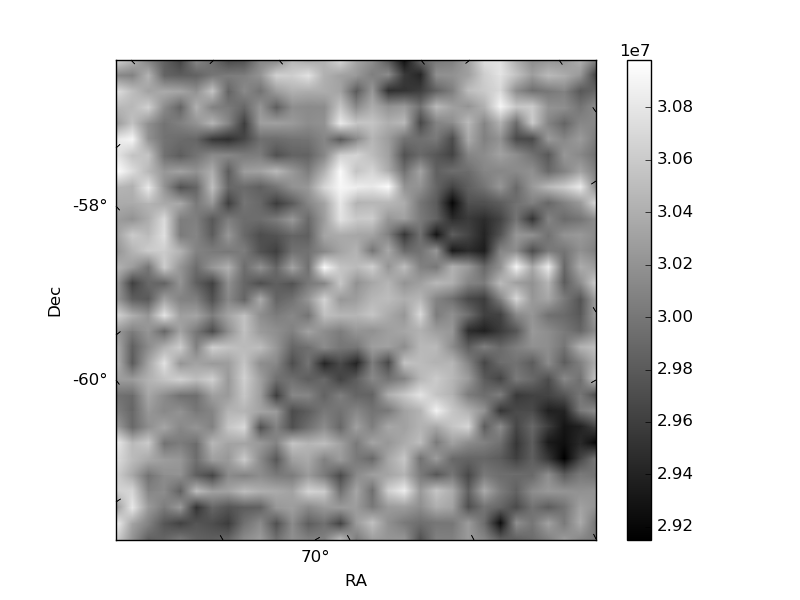
| Quadrant A | 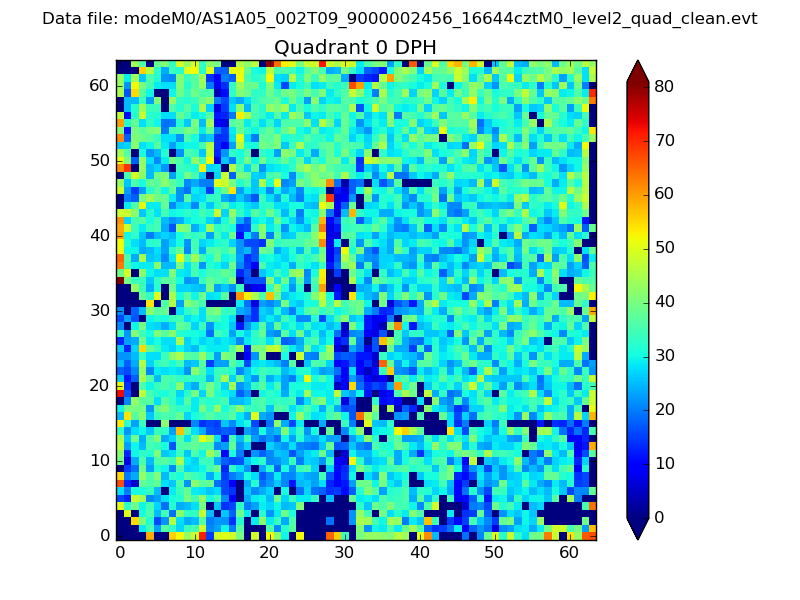 |
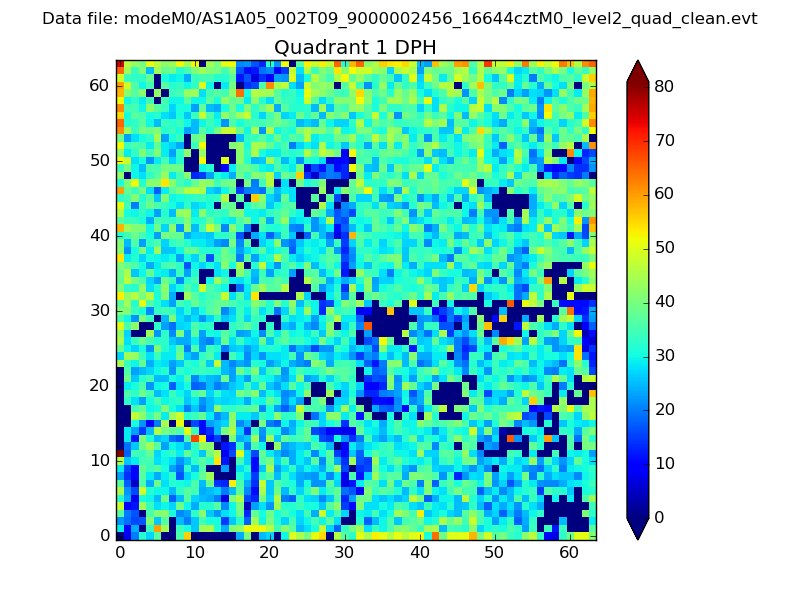 |
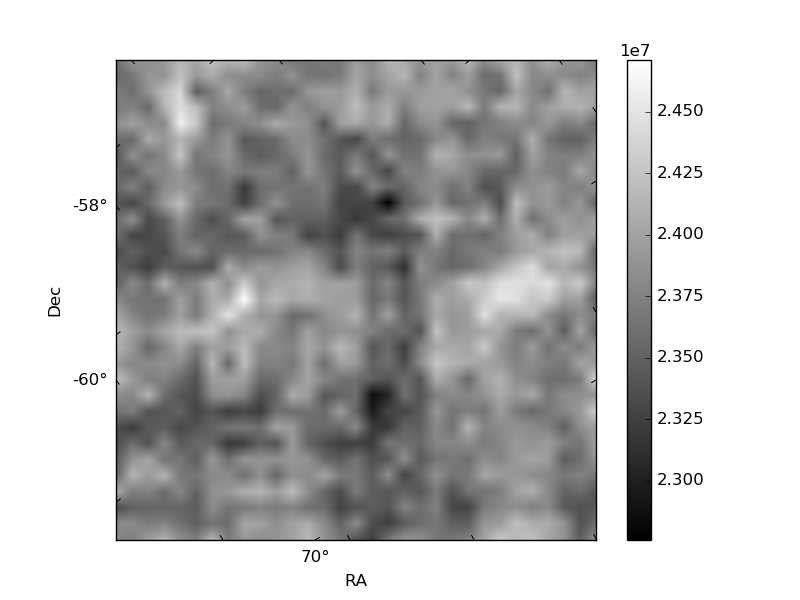
Quadrant B |
|---|---|---|---|
| Quadrant D | 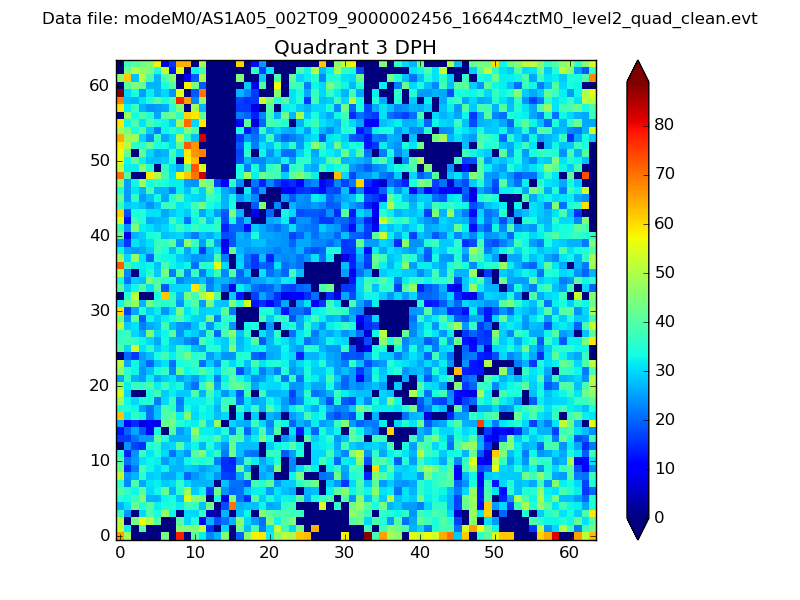 |
 |
Quadrant C |
| Plot type | Count rate plots | Images |
|---|---|---|
| Comparison with Poisson distribution Blue bars denote a histogram of data divided into 1 sec bins. Red curve is a Poisson curve with rate = median count rate of data. |
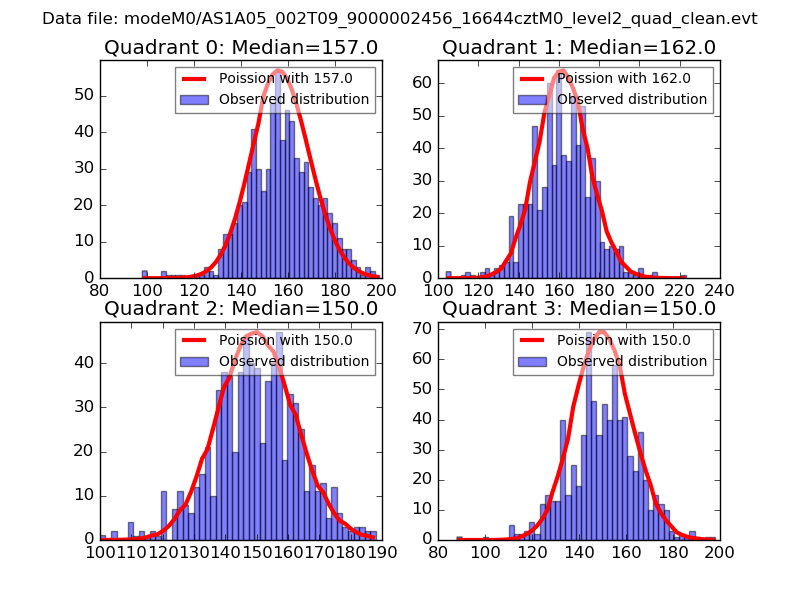 |
 |
| Quadrant-wise count rates Data is divided into 100 sec bins |
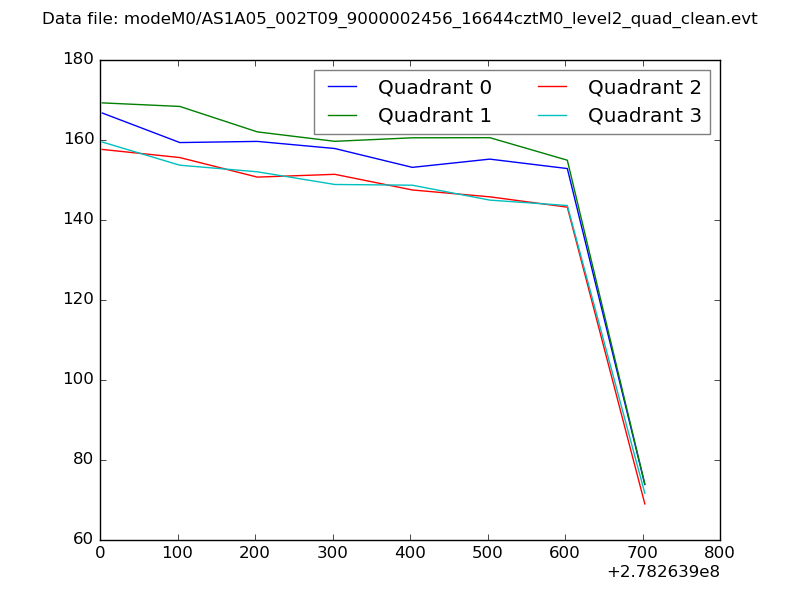 |
|
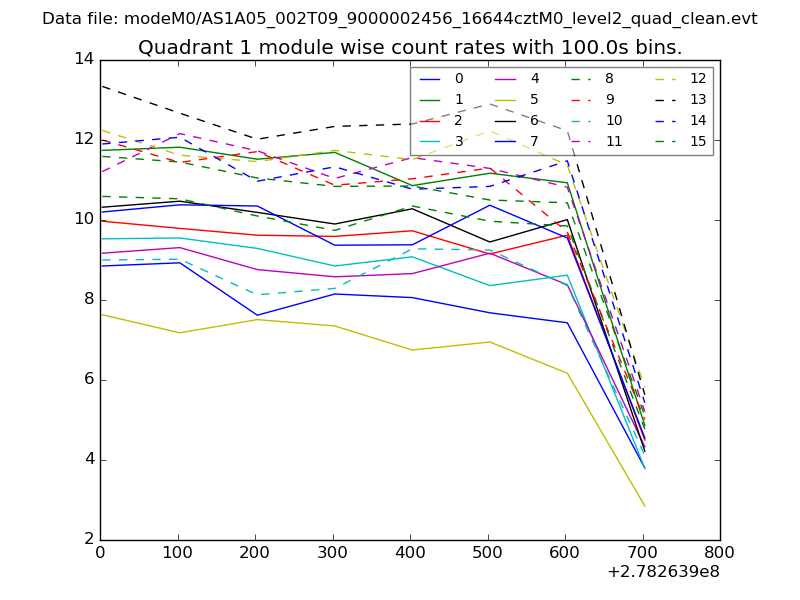
| Module-wise count rates for Quadrant A Data is divided into 100 sec bins |
 |
 |
| Module-wise count rates for Quadrant B Data is divided into 100 sec bins |
 |
 |
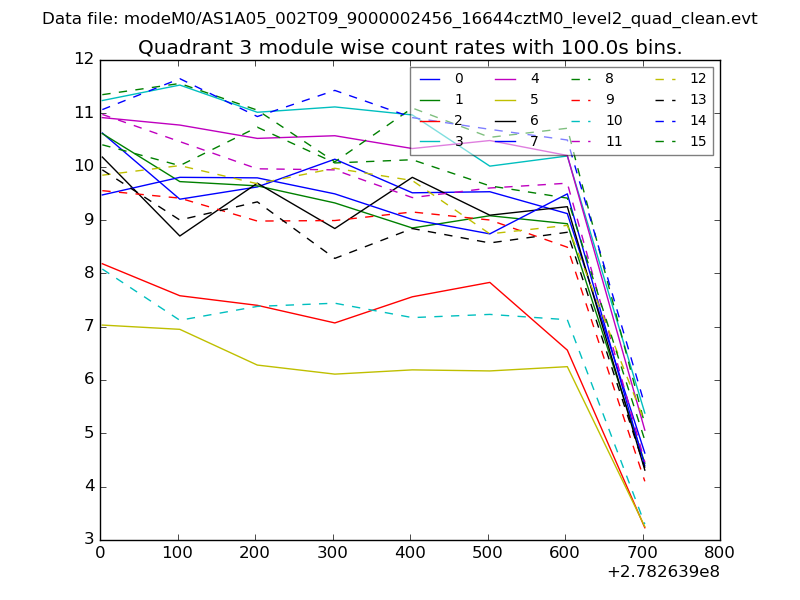
| Module-wise count rates for Quadrant C Data is divided into 100 sec bins |
 |
 |
| Module-wise count rates for Quadrant D Data is divided into 100 sec bins |
 |
 |
| Parameter | Plot |
|---|---|
| CZT HV Monitor | 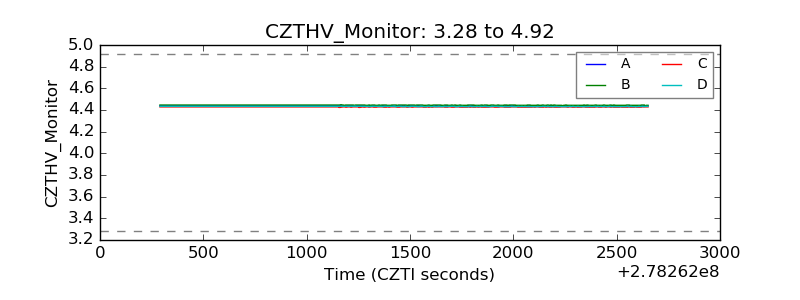 |
| D_VDD | 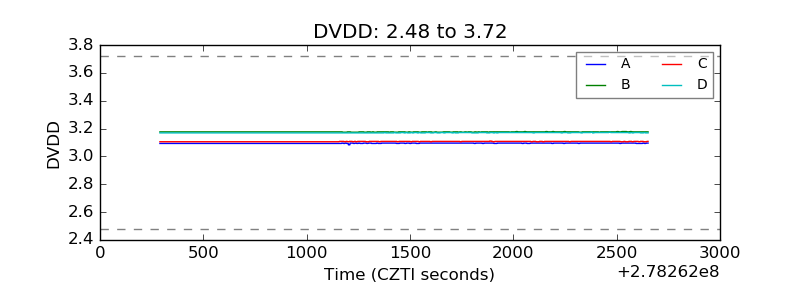 |
| Temperature 1 | 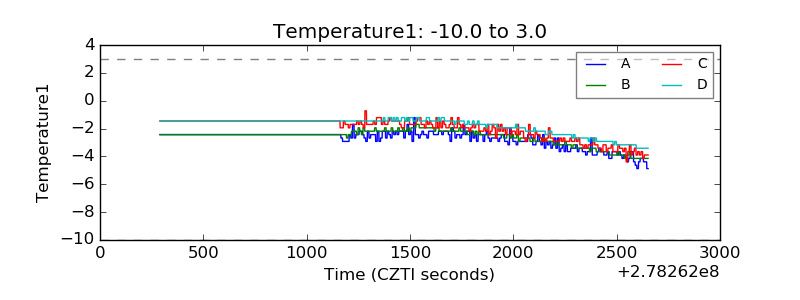 |
| Veto HV Monitor | 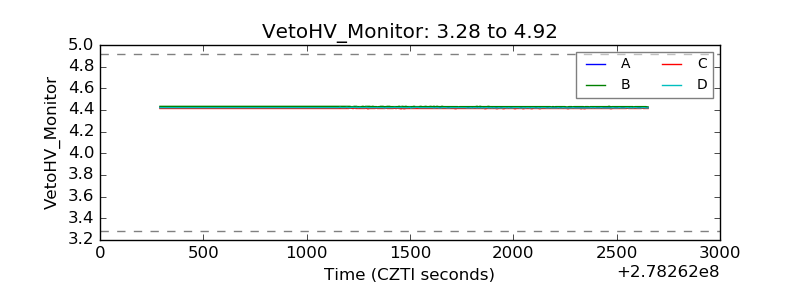 |
| Veto LLD |  |
| Alpha Counter | 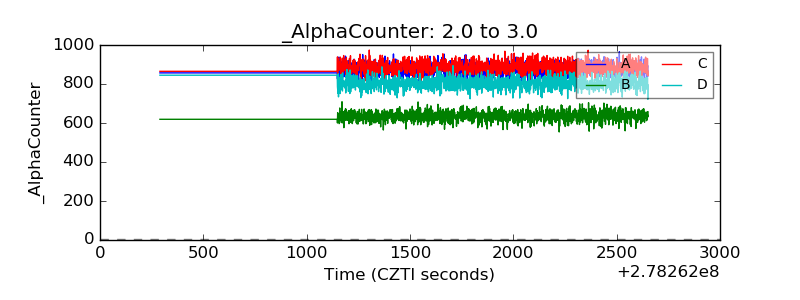 |
| _CPM_Rate | 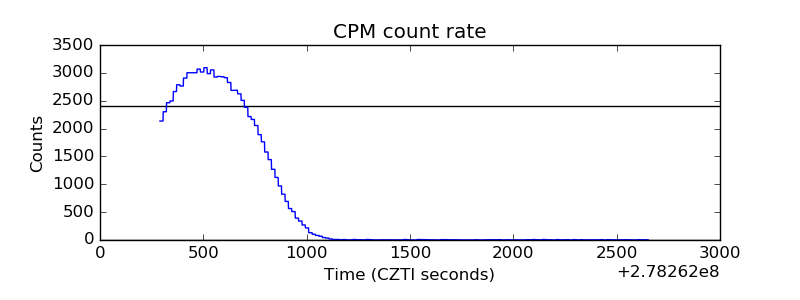 |
| CZT Counter | 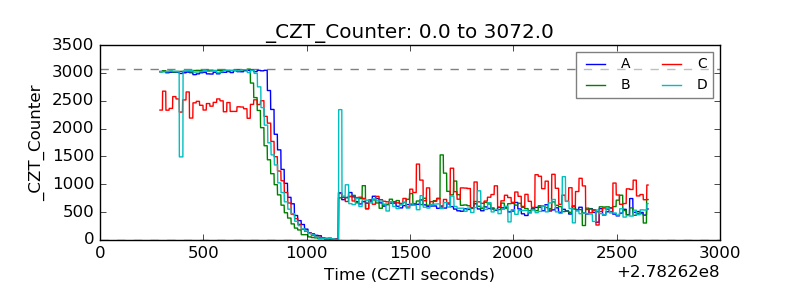 |
| +2.5 Volts monitor |  |
| +5 Volts monitor |  |
| _ROLL_ROT |  |
| _Roll_DEC | 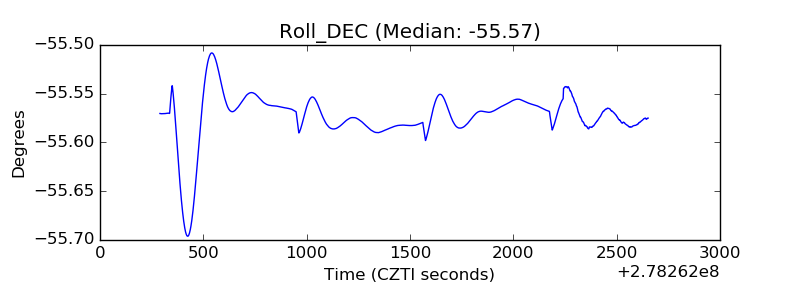 |
| _Roll_RA | 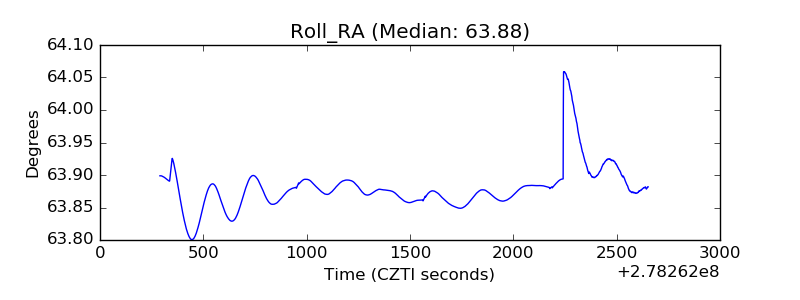 |
| Veto Counter |  |