| Param | Original file | Final file |
|---|---|---|
| Filename | modeM0/AS1A05_002T09_9000002456_16645cztM0_level2.evt | modeM0/AS1A05_002T09_9000002456_16645cztM0_level2_quad_clean.evt |
| Size (bytes) | 481,818,240 | 111,778,560 |
| Size | 459.5 MB | 106.6 MB |
| Events in quadrant A | 3,205,185 | 756,168 |
| Events in quadrant B | 3,759,277 | 771,173 |
| Events in quadrant C | 3,845,660 | 717,506 |
| Events in quadrant D | 3,360,962 | 707,864 |
| Mode M0 | |||
|---|---|---|---|
| Quadrant | BADHDUFLAG | Total packets | Discarded packets |
| A | 0 | 13607 | 2 |
| B | 0 | 15274 | 1 |
| C | 0 | 15502 | 1 |
| D | 0 | 14095 | 1 |
| Mode M9 | |||
|---|---|---|---|
| Quadrant | BADHDUFLAG | Total packets | Discarded packets |
| A | 0 | 13 | 0 |
| B | 0 | 13 | 0 |
| C | 0 | 13 | 0 |
| D | 0 | 13 | 0 |
| Mode SS | |||
|---|---|---|---|
| Quadrant | BADHDUFLAG | Total packets | Discarded packets |
| A | 0 | 126 | 0 |
| B | 0 | 126 | 0 |
| C | 0 | 126 | 0 |
| D | 0 | 126 | 0 |
| Quadrant | Total seconds | Saturated seconds | Saturation percentage |
|---|---|---|---|
| A | 6200 | 85 | 1.370968% |
| B | 6200 | 167 | 2.693548% |
| C | 6200 | 137 | 2.209677% |
| D | 6200 | 84 | 1.354839% |
Noise dominated data is calculated using 1-second bins in cleaned event files. If a bin has >2000 counts, and if more than 50% of those come from <1% of pixels, then it is considered to be noise-dominated and hence unusable.
| Quadrant | # 1 sec bins | Bins with >0 counts | Bins with >2000 counts | High rate bins dominated by noise | Noise dominated (total time) | Noise dominated (detector-on time) | Marked lightcurve |
|---|---|---|---|---|---|---|---|
| A | 7541 | 6202 | 1 | 1 | 0.01% | 0.02% |  |
| B | 7541 | 6202 | 11 | 11 | 0.15% | 0.18% | 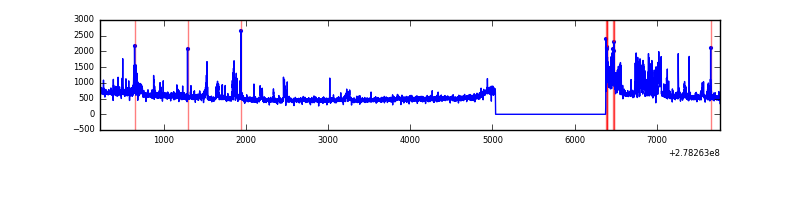 |
| C | 7541 | 6202 | 25 | 25 | 0.33% | 0.40% | 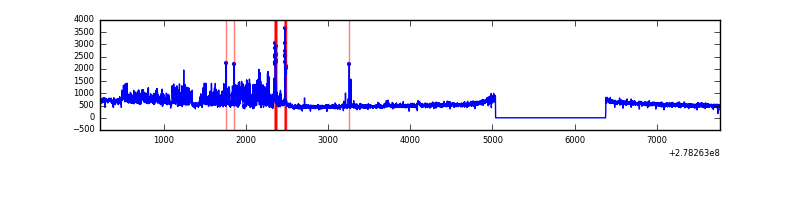 |
| D | 7541 | 6202 | 10 | 10 | 0.13% | 0.16% | 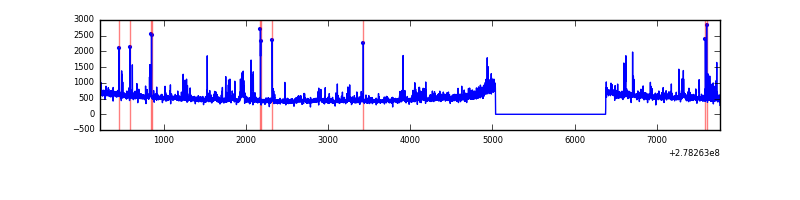 |
Top three noisy pixels from each quadrant. If the there are fewer than three noisy pixels in the level2.evt file, extra rows are filled as -1
| Pixel properties | Quadrant properties | ||||||
|---|---|---|---|---|---|---|---|
| Quadrant | DetID | PixID | Counts | Sigma | Mean | Median | Sigma |
| A | 12 | 96 | 20838 | 122.57 | 825 | 812 | 163.4 |
| A | 0 | 226 | 7399 | 40.32 | 825 | 812 | 163.4 |
| A | 12 | 194 | 6163 | 32.75 | 825 | 812 | 163.4 |
| B | 15 | 35 | 416692 | 2726.92 | 824 | 805 | 152.5 |
| B | 0 | 198 | 44881 | 289.0 | 824 | 805 | 152.5 |
| B | 0 | 189 | 30468 | 194.5 | 824 | 805 | 152.5 |
| C | 7 | 247 | 576542 | 3270.38 | 775 | 781 | 176.1 |
| C | 14 | 238 | 124655 | 703.62 | 775 | 781 | 176.1 |
| C | 3 | 233 | 119864 | 676.4 | 775 | 781 | 176.1 |
| D | 5 | 222 | 160861 | 847.17 | 788 | 764 | 189.0 |
| D | 1 | 52 | 96493 | 506.56 | 788 | 764 | 189.0 |
| D | 2 | 33 | 59076 | 308.56 | 788 | 764 | 189.0 |
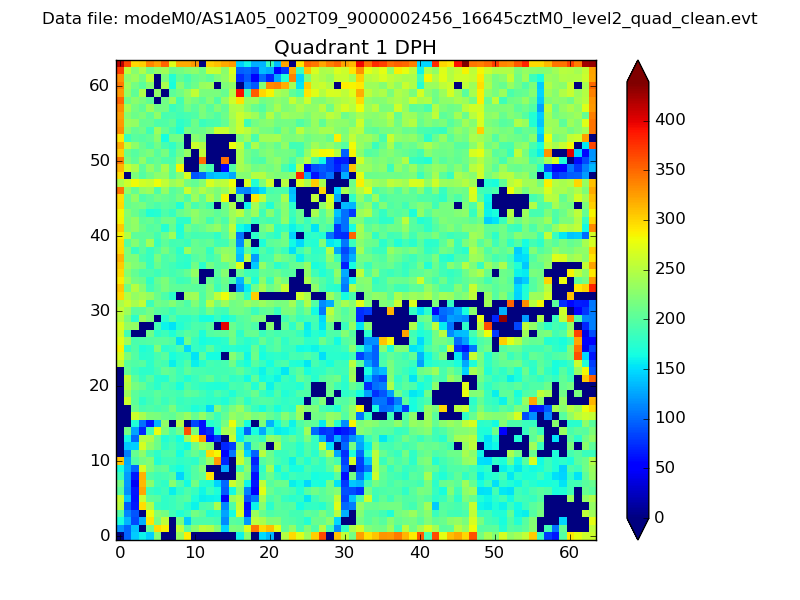
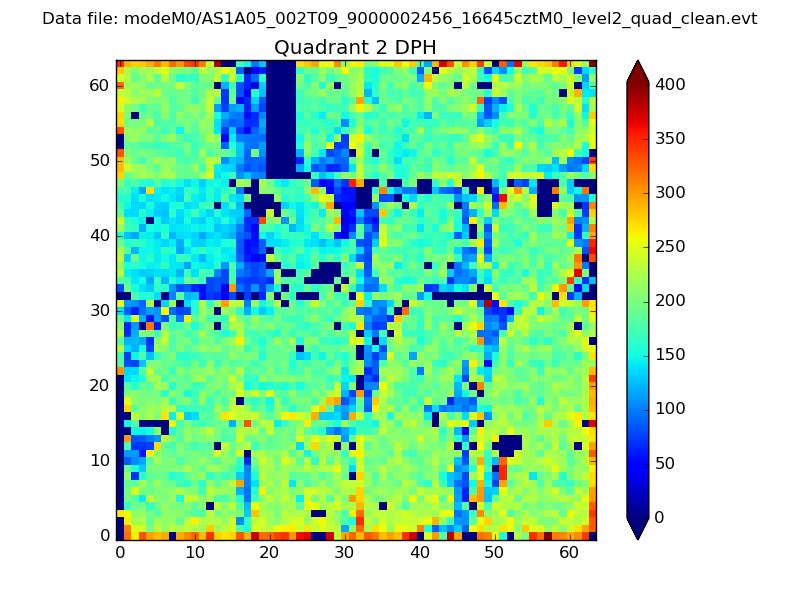
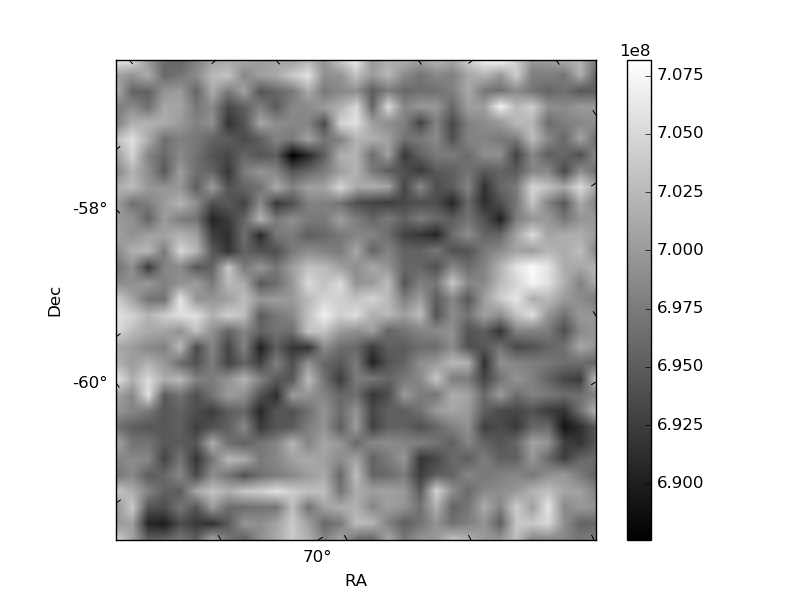
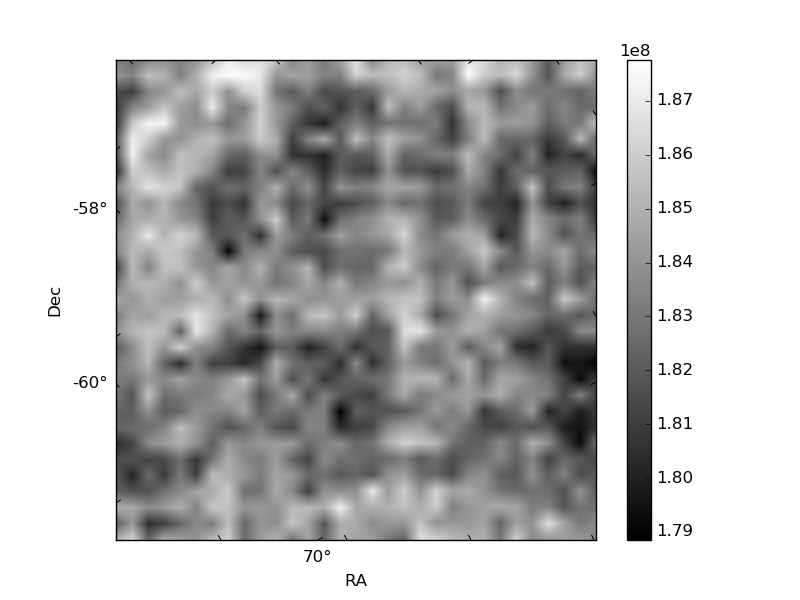
Histogram calculated using DETX and DETY for each event in the final _common_clean file
| Quadrant A | 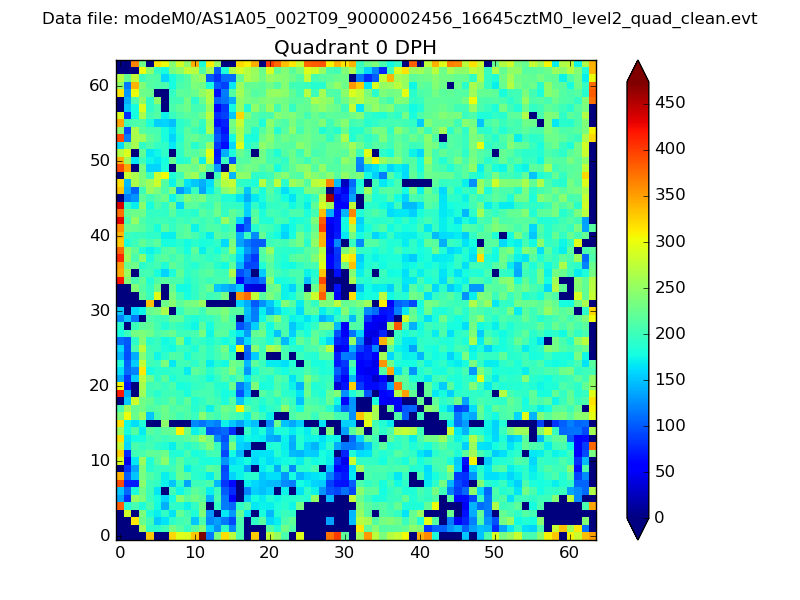 |
 |
Quadrant B |
|---|---|---|---|
| Quadrant D | 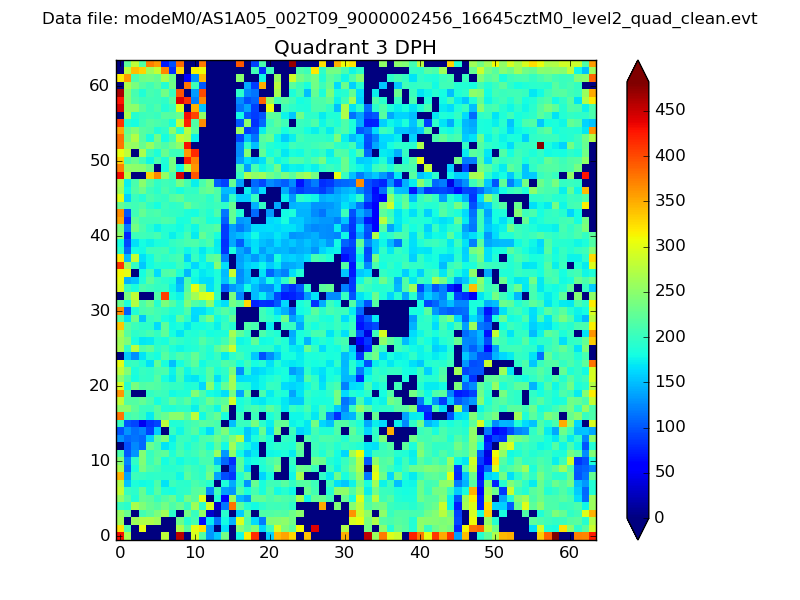 |
 |
Quadrant C |
| Plot type | Count rate plots | Images |
|---|---|---|
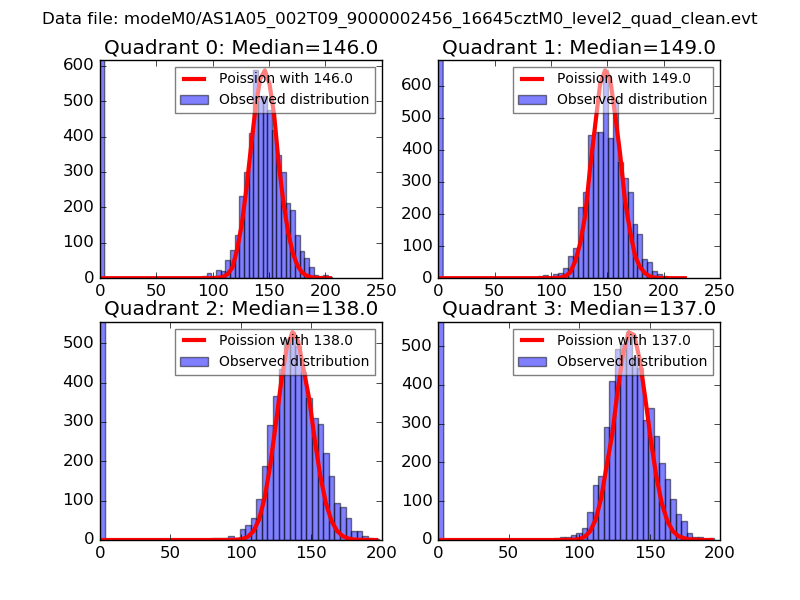
| Comparison with Poisson distribution Blue bars denote a histogram of data divided into 1 sec bins. Red curve is a Poisson curve with rate = median count rate of data. |
 |
 |
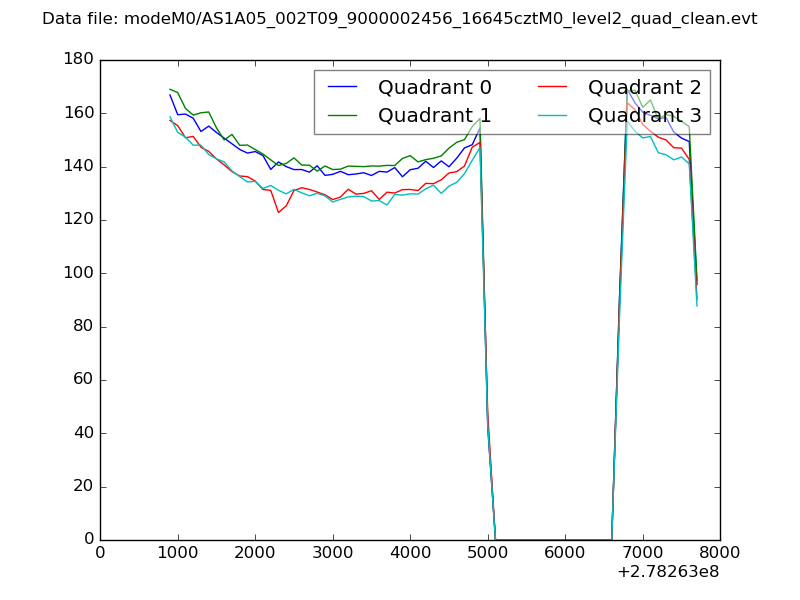
| Quadrant-wise count rates Data is divided into 100 sec bins |
 |
|
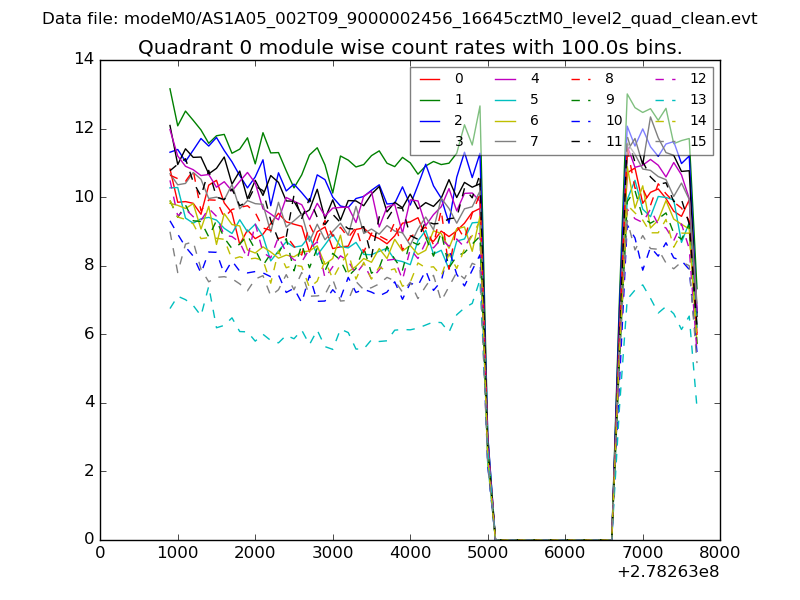
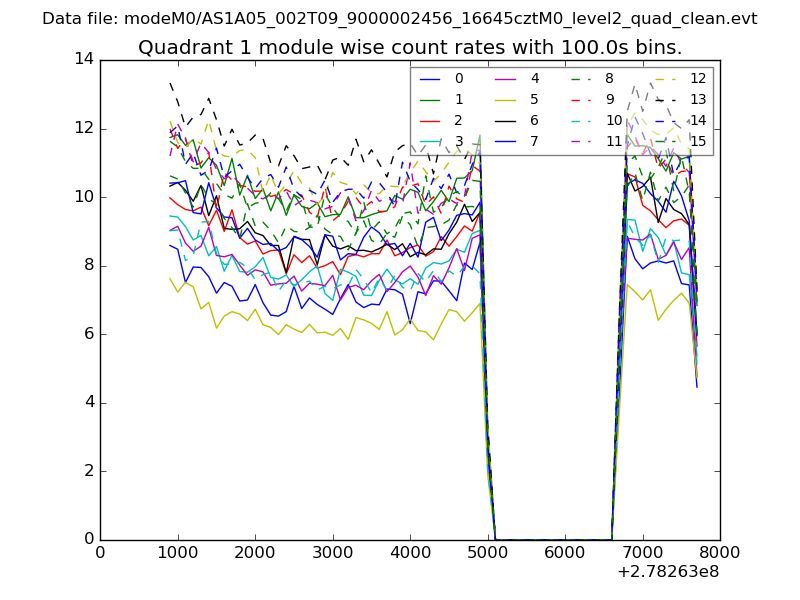
| Module-wise count rates for Quadrant A Data is divided into 100 sec bins |
 |
 |
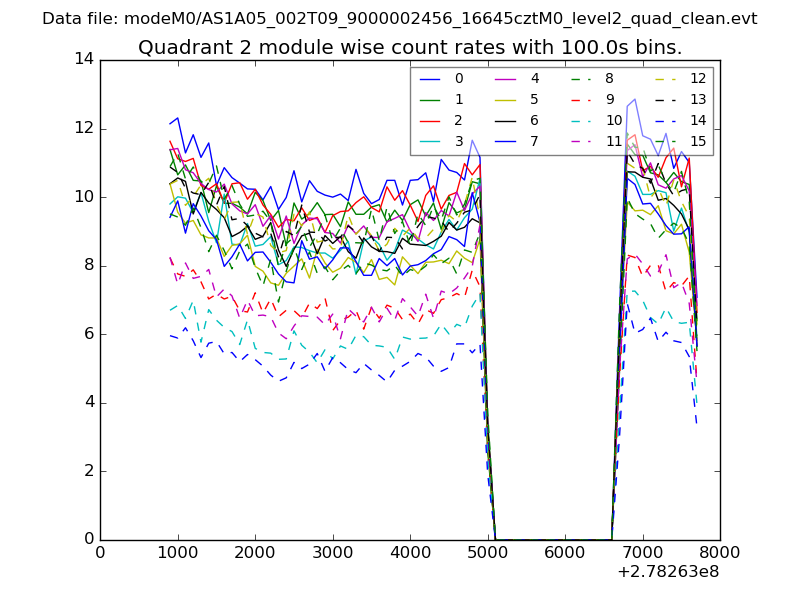
| Module-wise count rates for Quadrant B Data is divided into 100 sec bins |
 |
 |
| Module-wise count rates for Quadrant C Data is divided into 100 sec bins |
 |
 |
| Module-wise count rates for Quadrant D Data is divided into 100 sec bins |
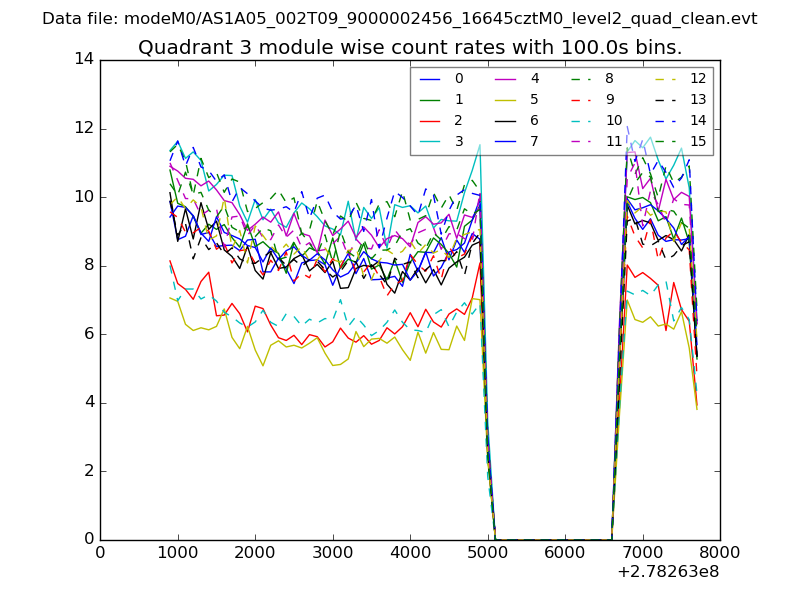 |
 |
| Parameter | Plot |
|---|---|
| CZT HV Monitor | 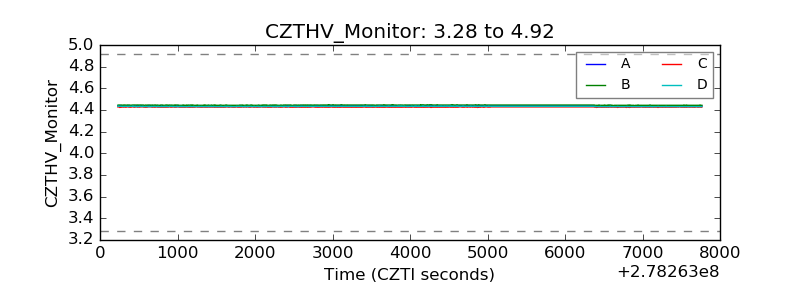 |
| D_VDD |  |
| Temperature 1 | 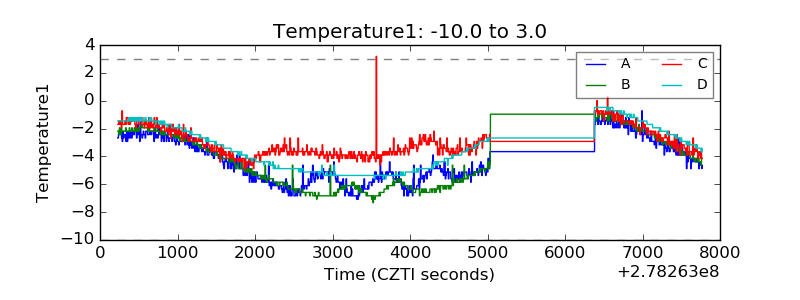 |
| Veto HV Monitor | 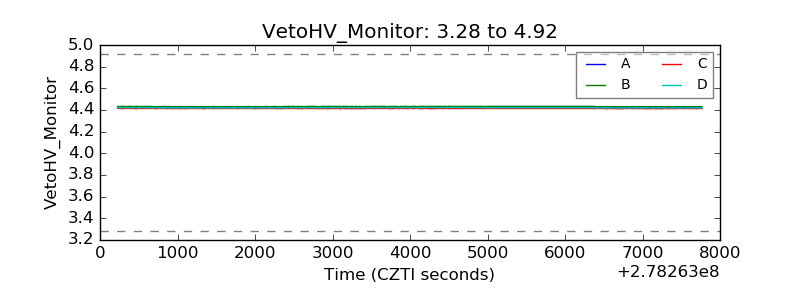 |
| Veto LLD | 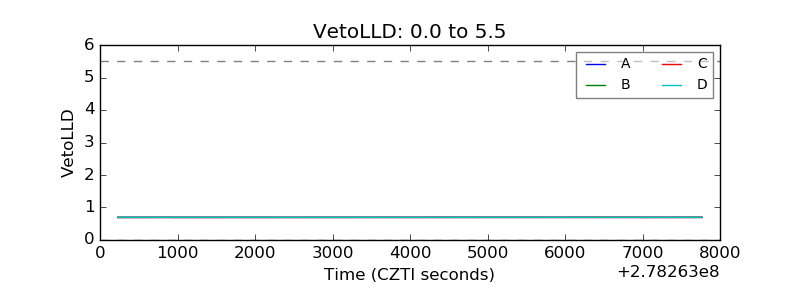 |
| Alpha Counter | 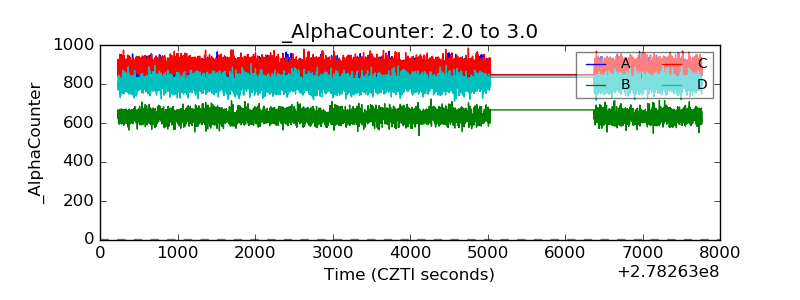 |
| _CPM_Rate | 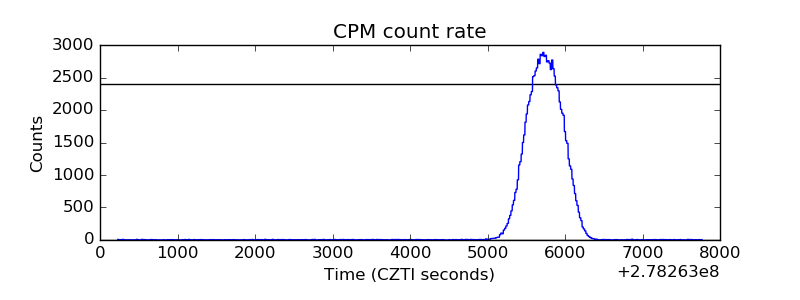 |
| CZT Counter | 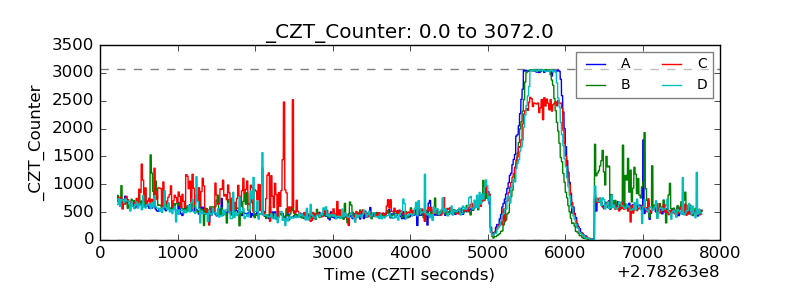 |
| +2.5 Volts monitor |  |
| +5 Volts monitor |  |
| _ROLL_ROT | 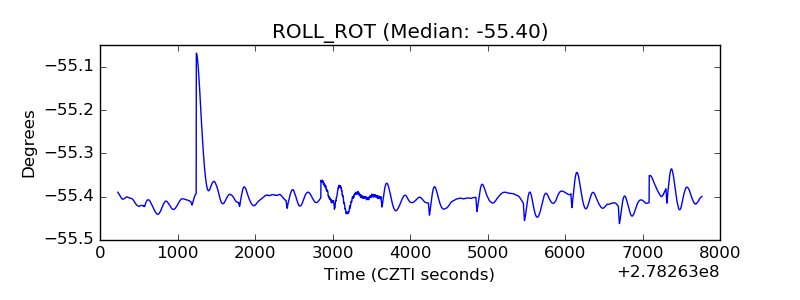 |
| _Roll_DEC | 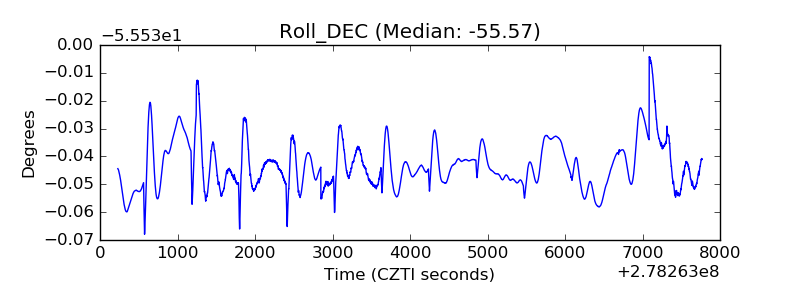 |
| _Roll_RA | 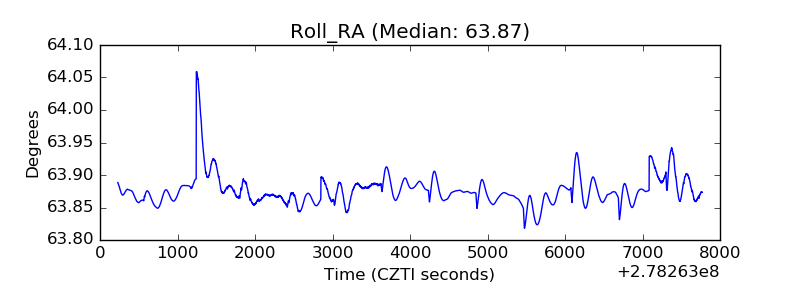 |
| Veto Counter | 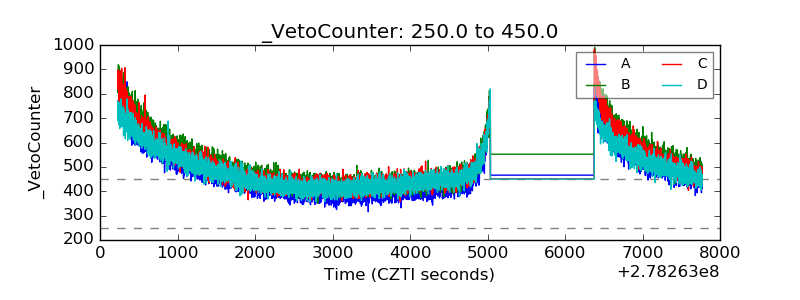 |