| Param | Original file | Final file |
|---|---|---|
| Filename | modeM0/AS1A05_002T09_9000002456_16646cztM0_level2.evt | modeM0/AS1A05_002T09_9000002456_16646cztM0_level2_quad_clean.evt |
| Size (bytes) | 179,665,920 | 51,937,920 |
| Size | 171.3 MB | 49.5 MB |
| Events in quadrant A | 1,250,025 | 355,993 |
| Events in quadrant B | 1,547,931 | 363,265 |
| Events in quadrant C | 1,218,933 | 339,985 |
| Events in quadrant D | 1,250,338 | 331,936 |
| Mode M0 | |||
|---|---|---|---|
| Quadrant | BADHDUFLAG | Total packets | Discarded packets |
| A | 0 | 5365 | 0 |
| B | 0 | 6254 | 0 |
| C | 0 | 5215 | 0 |
| D | 0 | 5470 | 0 |
| Mode SS | |||
|---|---|---|---|
| Quadrant | BADHDUFLAG | Total packets | Discarded packets |
| A | 0 | 50 | 0 |
| B | 0 | 50 | 0 |
| C | 0 | 50 | 0 |
| D | 0 | 50 | 0 |
| Quadrant | Total seconds | Saturated seconds | Saturation percentage |
|---|---|---|---|
| A | 2529 | 4 | 0.158165% |
| B | 2529 | 27 | 1.067616% |
| C | 2529 | 4 | 0.158165% |
| D | 2529 | 5 | 0.197707% |
Noise dominated data is calculated using 1-second bins in cleaned event files. If a bin has >2000 counts, and if more than 50% of those come from <1% of pixels, then it is considered to be noise-dominated and hence unusable.
| Quadrant | # 1 sec bins | Bins with >0 counts | Bins with >2000 counts | High rate bins dominated by noise | Noise dominated (total time) | Noise dominated (detector-on time) | Marked lightcurve |
|---|---|---|---|---|---|---|---|
| A | 2530 | 2530 | 3 | 3 | 0.12% | 0.12% | 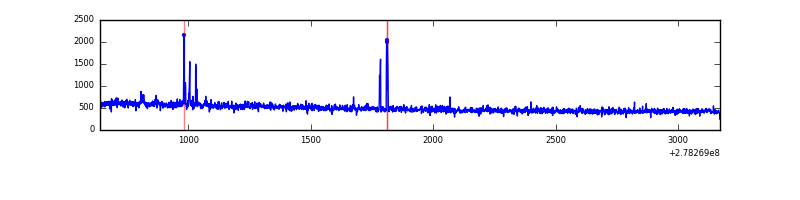 |
| B | 2530 | 2530 | 3 | 3 | 0.12% | 0.12% | 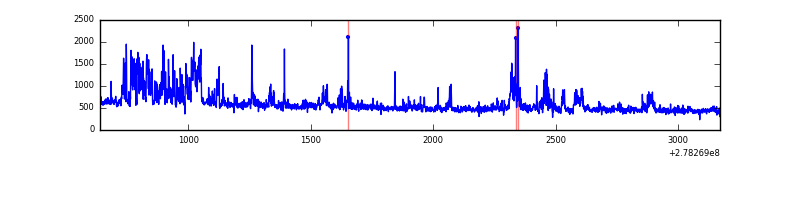 |
| C | 2530 | 2530 | 0 | 0 | 0.00% | 0.00% | 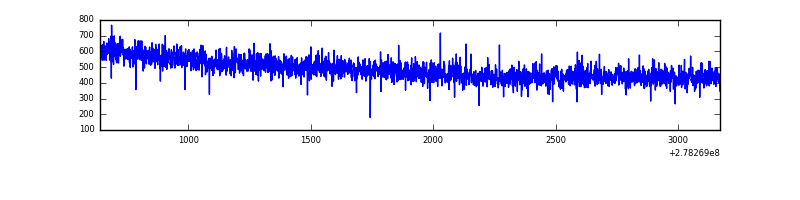 |
| D | 2530 | 2530 | 4 | 4 | 0.16% | 0.16% | 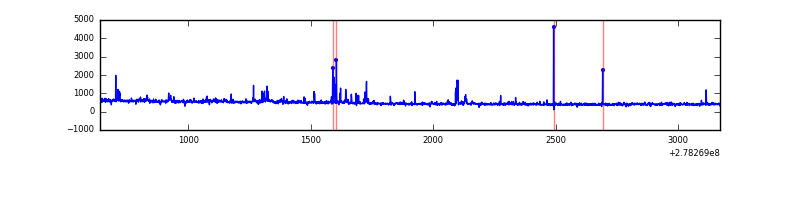 |
Top three noisy pixels from each quadrant. If the there are fewer than three noisy pixels in the level2.evt file, extra rows are filled as -1
| Pixel properties | Quadrant properties | ||||||
|---|---|---|---|---|---|---|---|
| Quadrant | DetID | PixID | Counts | Sigma | Mean | Median | Sigma |
| A | 12 | 96 | 29332 | 449.62 | 315 | 310 | 64.5 |
| A | 15 | 223 | 4263 | 61.24 | 315 | 310 | 64.5 |
| A | 3 | 1 | 2828 | 39.01 | 315 | 310 | 64.5 |
| B | 15 | 35 | 231905 | 3837.5 | 318 | 312 | 60.3 |
| B | 0 | 229 | 25551 | 418.21 | 318 | 312 | 60.3 |
| B | 4 | 48 | 14021 | 227.16 | 318 | 312 | 60.3 |
| C | 14 | 238 | 47185 | 677.35 | 294 | 296 | 69.2 |
| C | 3 | 233 | 21752 | 309.95 | 294 | 296 | 69.2 |
| C | 7 | 247 | 2811 | 36.33 | 294 | 296 | 69.2 |
| D | 1 | 52 | 59654 | 833.04 | 294 | 286 | 71.3 |
| D | 5 | 222 | 20667 | 285.98 | 294 | 286 | 71.3 |
| D | 7 | 38 | 16389 | 225.95 | 294 | 286 | 71.3 |
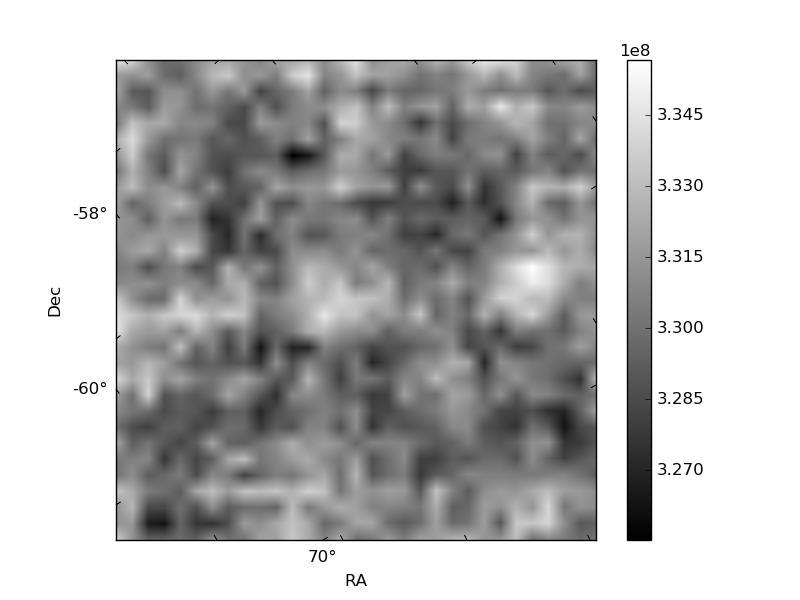
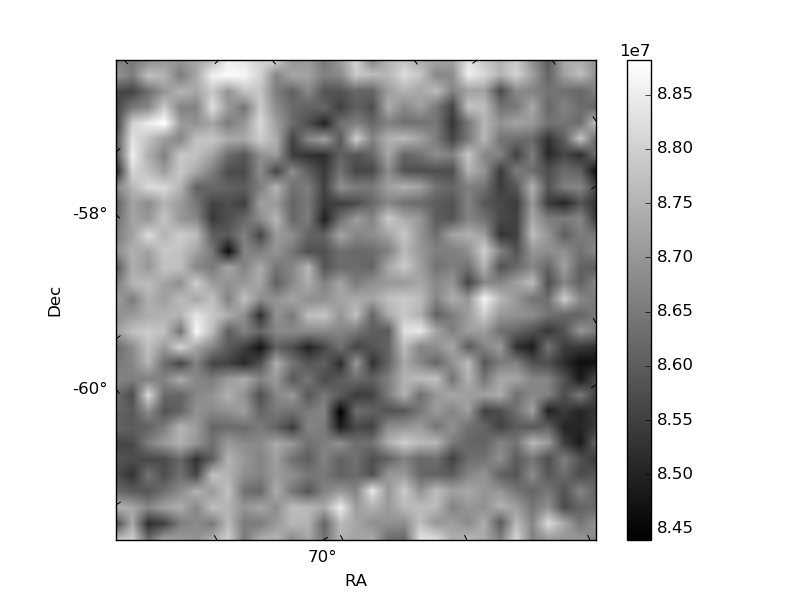
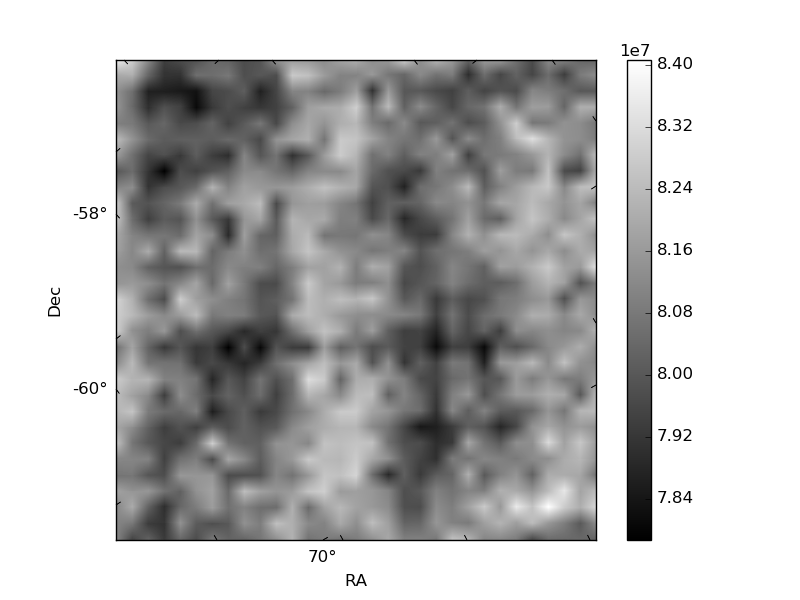
Histogram calculated using DETX and DETY for each event in the final _common_clean file
| Quadrant A | 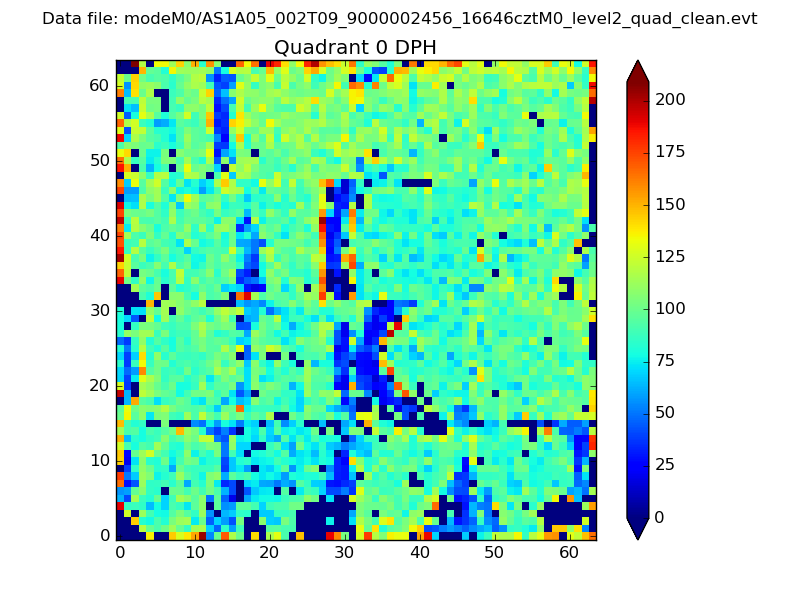 |
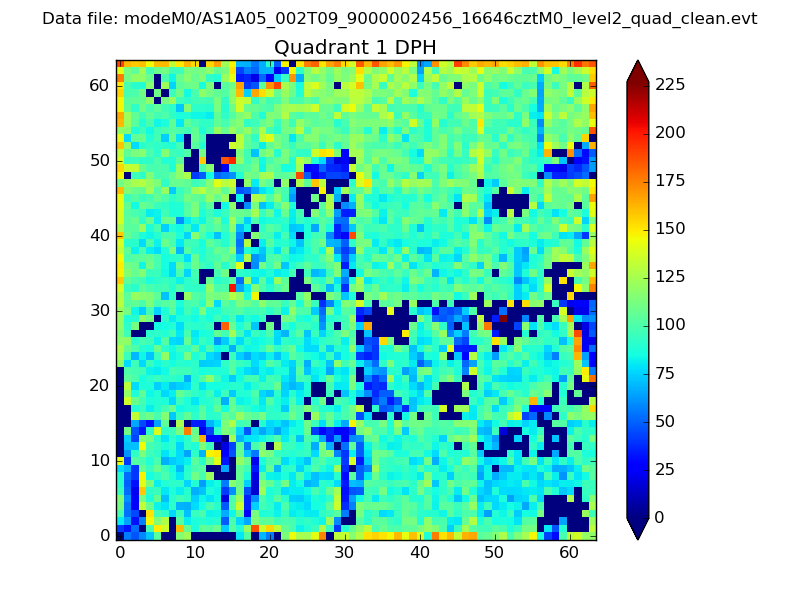 |
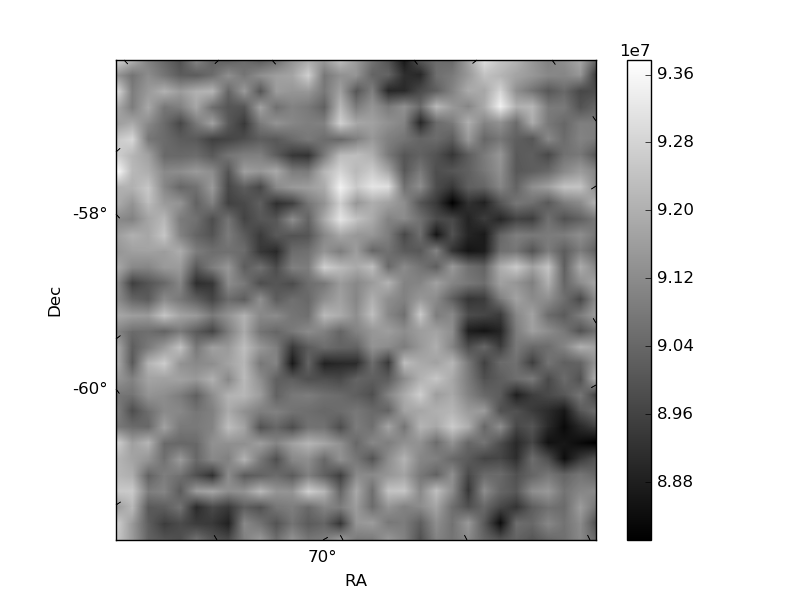
Quadrant B |
|---|---|---|---|
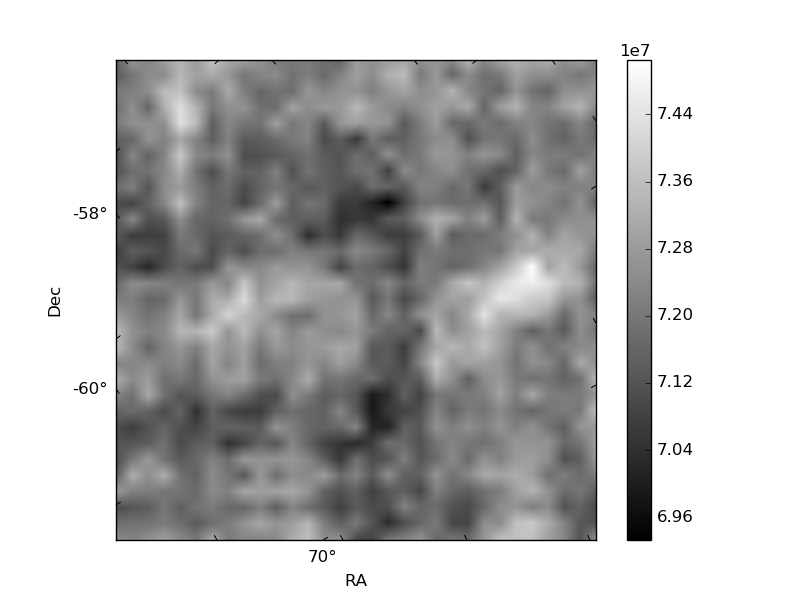
| Quadrant D | 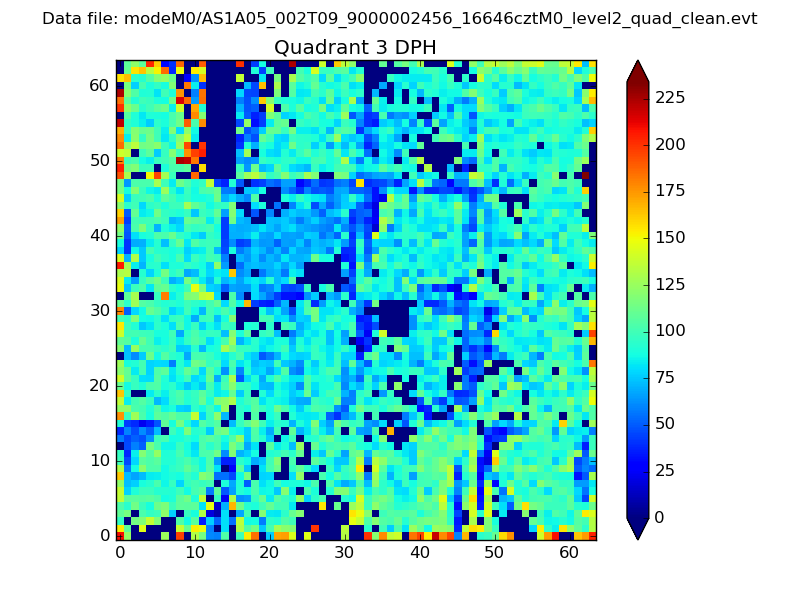 |
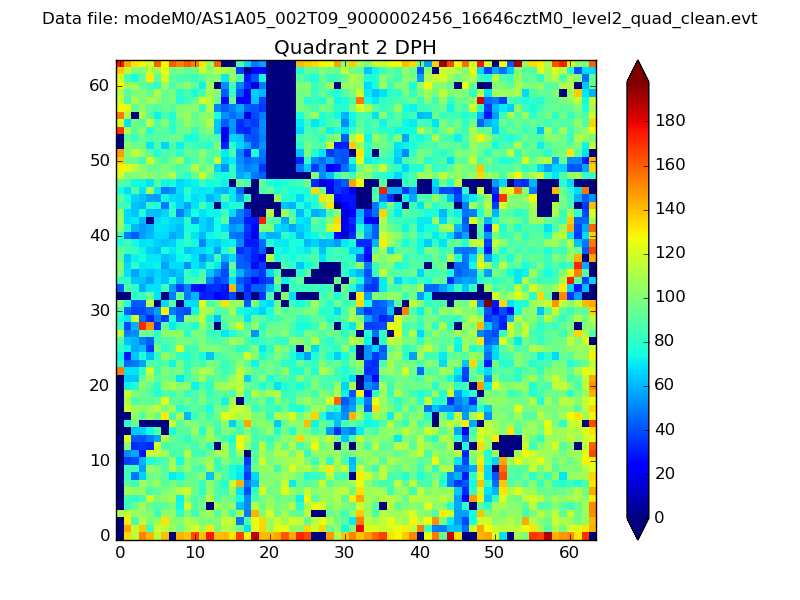 |
Quadrant C |
| Plot type | Count rate plots | Images |
|---|---|---|
| Comparison with Poisson distribution Blue bars denote a histogram of data divided into 1 sec bins. Red curve is a Poisson curve with rate = median count rate of data. |
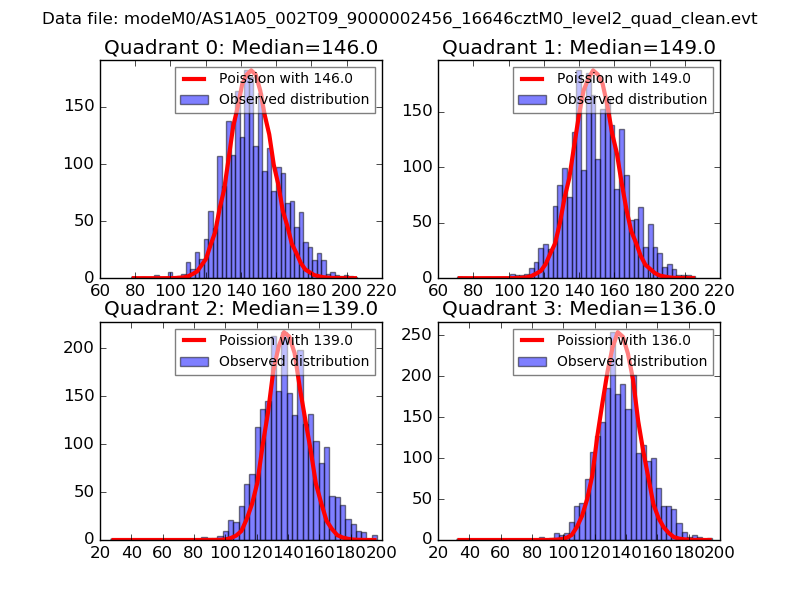 |
 |
| Quadrant-wise count rates Data is divided into 100 sec bins |
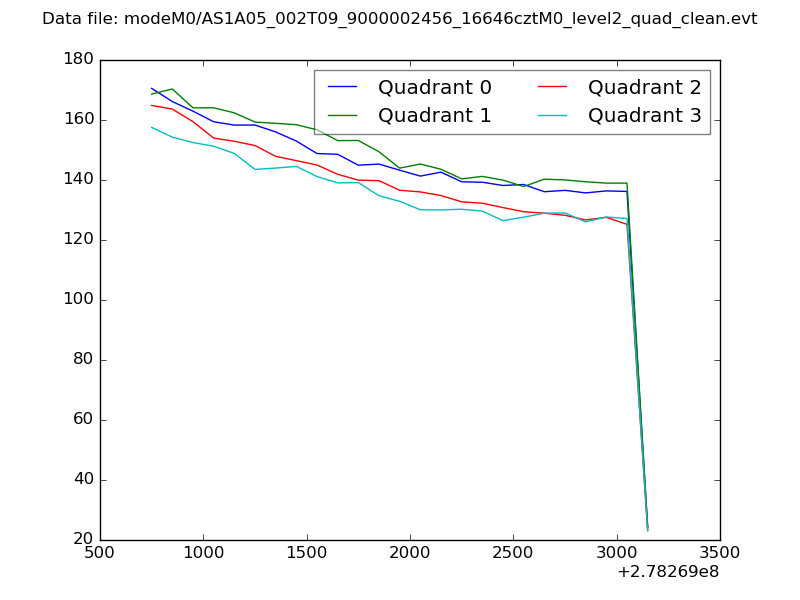 |
|
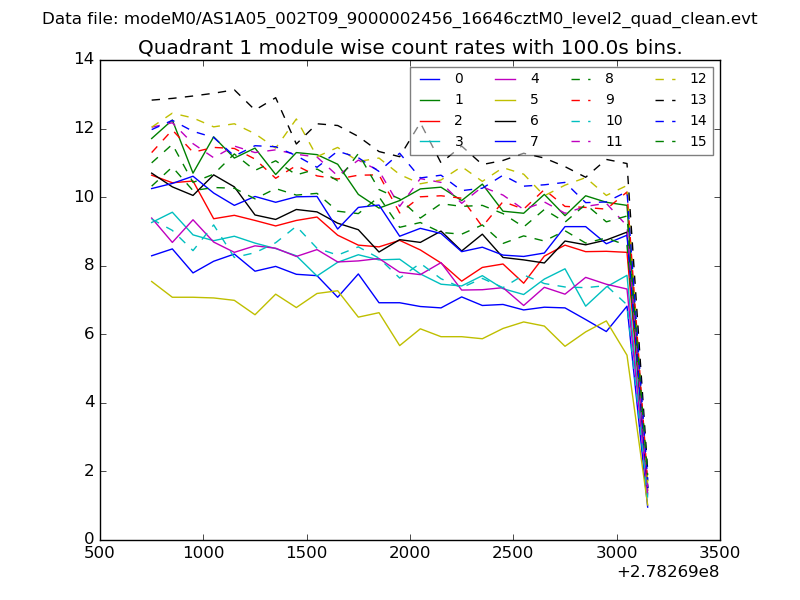
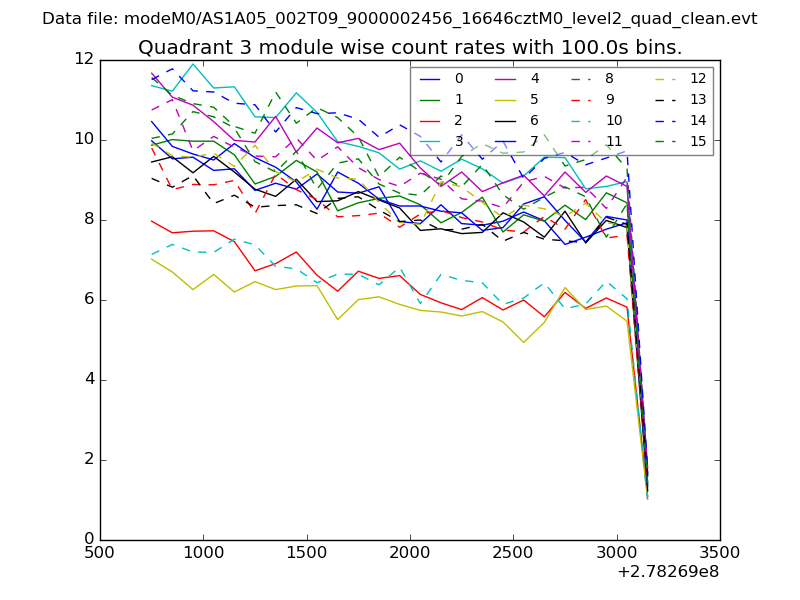
| Module-wise count rates for Quadrant A Data is divided into 100 sec bins |
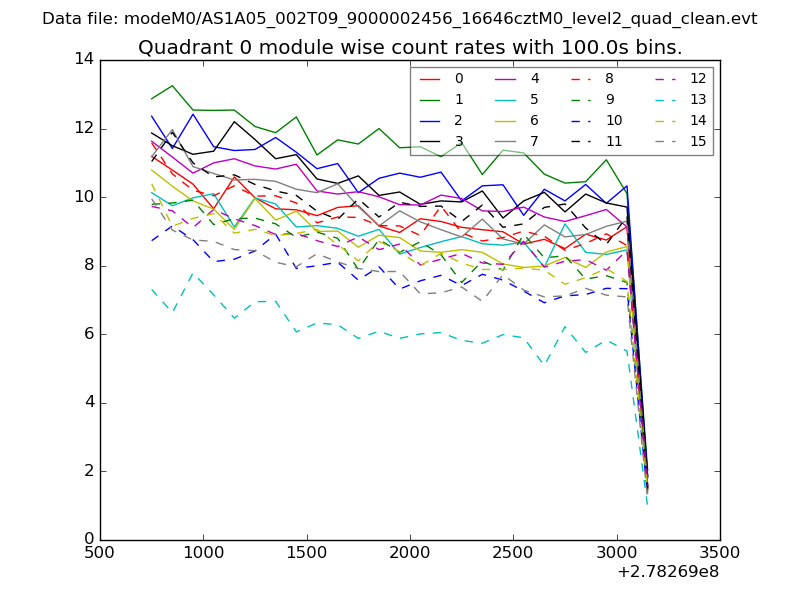 |
 |
| Module-wise count rates for Quadrant B Data is divided into 100 sec bins |
 |
 |
| Module-wise count rates for Quadrant C Data is divided into 100 sec bins |
 |
 |
| Module-wise count rates for Quadrant D Data is divided into 100 sec bins |
 |
 |
| Parameter | Plot |
|---|---|
| CZT HV Monitor | 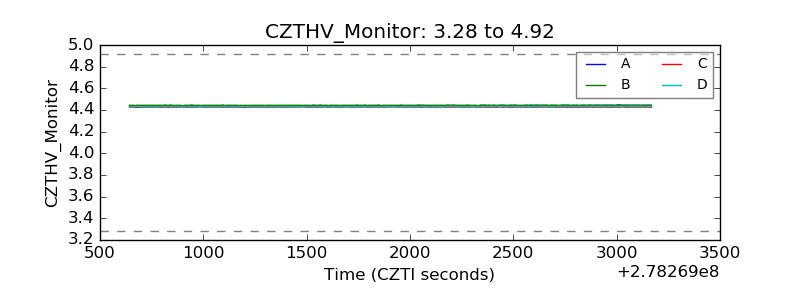 |
| D_VDD |  |
| Temperature 1 | 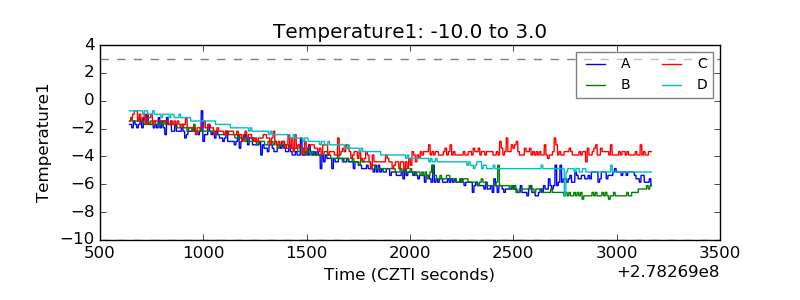 |
| Veto HV Monitor | 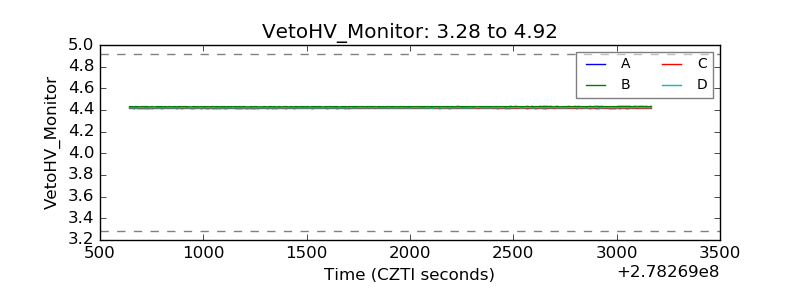 |
| Veto LLD |  |
| Alpha Counter | 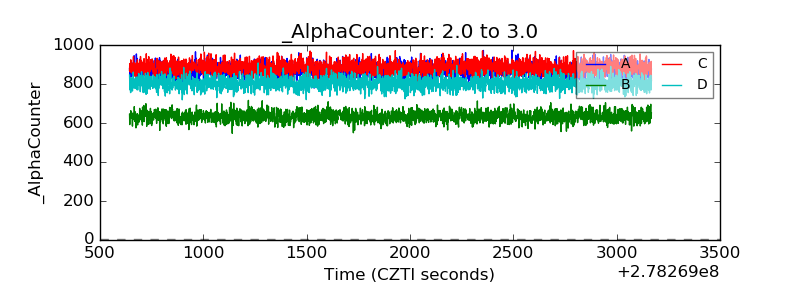 |
| _CPM_Rate | 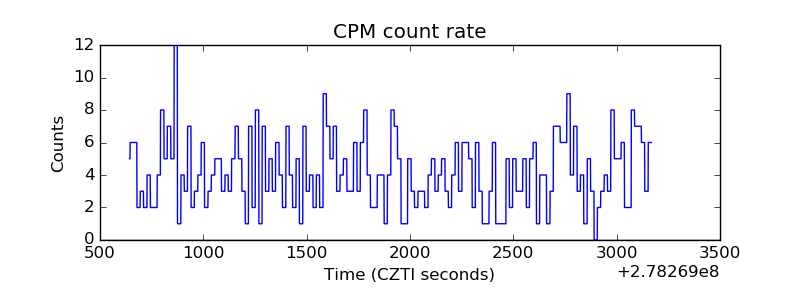 |
| CZT Counter | 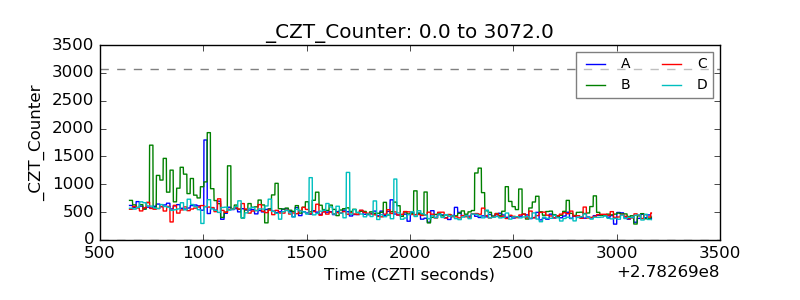 |
| +2.5 Volts monitor |  |
| +5 Volts monitor |  |
| _ROLL_ROT | 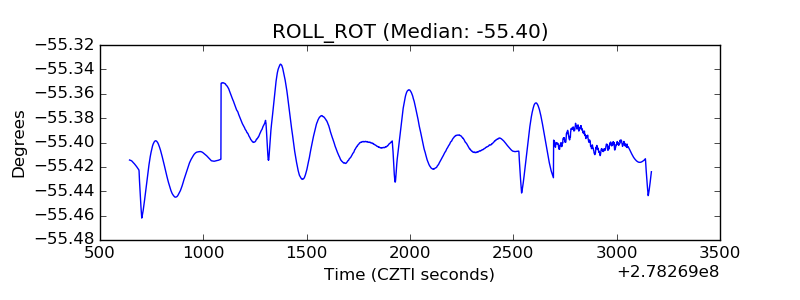 |
| _Roll_DEC | 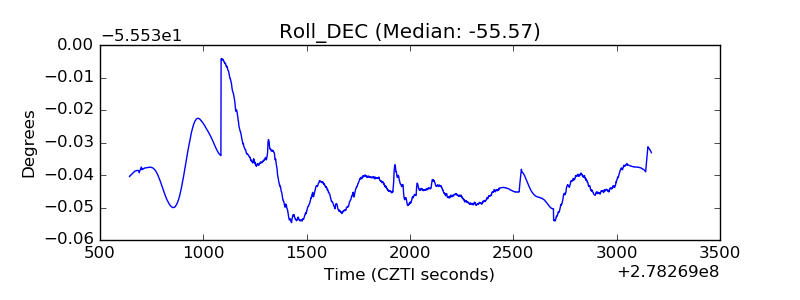 |
| _Roll_RA | 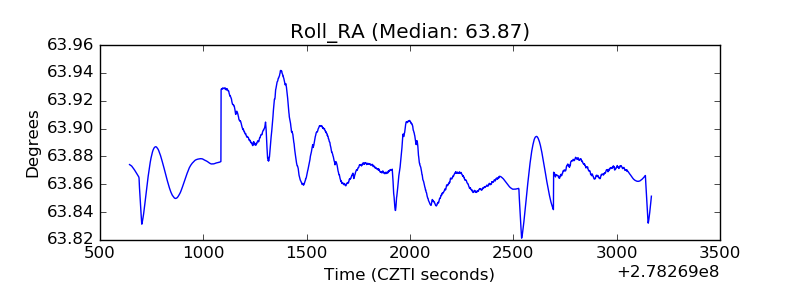 |
| Veto Counter |  |