| Param | Original file | Final file |
|---|---|---|
| Filename | modeM0/AS1A05_002T10_9000002460cztM0_level2.fits | modeM0/AS1A05_002T10_9000002460cztM0_level2_quad_clean.evt |
| Size (bytes) | 246,697,920 | 280,486,080 |
| Size | 235.3 MB | 267.5 MB |
| Events in quadrant A | 1,479,688 | 1,727,805 |
| Events in quadrant B | 1,436,038 | 1,766,278 |
| Events in quadrant C | 1,457,796 | 1,664,556 |
| Events in quadrant D | 1,236,772 | 1,475,248 |
| Mode SS | |||
|---|---|---|---|
| Quadrant | BADHDUFLAG | Total packets | Discarded packets |
| A | 0 | 550 | 0 |
| B | 0 | 550 | 0 |
| C | 0 | 550 | 0 |
| D | 0 | 550 | 0 |
| Mode M0 | |||
|---|---|---|---|
| Quadrant | BADHDUFLAG | Total packets | Discarded packets |
| A | 0 | 58060 | 0 |
| B | 0 | 57858 | 0 |
| C | 0 | 55340 | 0 |
| D | 0 | 76603 | 0 |
| Mode M9 | |||
|---|---|---|---|
| Quadrant | BADHDUFLAG | Total packets | Discarded packets |
| A | 0 | 13 | 0 |
| B | 0 | 13 | 0 |
| C | 0 | 13 | 0 |
| D | 0 | 13 | 0 |
| Quadrant | Total seconds | Saturated seconds | Saturation percentage |
|---|---|---|---|
| A | 27054 | 390 | 1.441561% |
| B | 27054 | 270 | 0.998004% |
| C | 27054 | 295 | 1.090412% |
| D | 27054 | 1359 | 5.023287% |
Noise dominated data is calculated using 1-second bins in cleaned event files. If a bin has >2000 counts, and if more than 50% of those come from <1% of pixels, then it is considered to be noise-dominated and hence unusable.
| Quadrant | # 1 sec bins | Bins with >0 counts | Bins with >2000 counts | High rate bins dominated by noise | Noise dominated (total time) | Noise dominated (detector-on time) | Marked lightcurve |
|---|---|---|---|---|---|---|---|
| A | 28409 | 27053 | 0 | 0 | 0.00% | 0.00% |  |
| B | 28409 | 27054 | 0 | 0 | 0.00% | 0.00% | 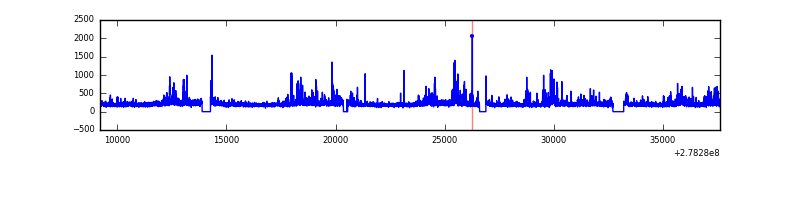 |
| C | 28409 | 27055 | 0 | 0 | 0.00% | 0.00% |  |
| D | 28409 | 27049 | 0 | 0 | 0.00% | 0.00% |  |
Top three noisy pixels from each quadrant. If the there are fewer than three noisy pixels in the level2.evt file, extra rows are filled as -1
| Pixel properties | Quadrant properties | ||||||
|---|---|---|---|---|---|---|---|
| Quadrant | DetID | PixID | Counts | Sigma | Mean | Median | Sigma |
| A | 0 | 29 | 1417 | 10.7 | 385 | 360 | 98.8 |
| A | 7 | 110 | 1137 | 7.87 | 385 | 360 | 98.8 |
| A | 15 | 236 | 1129 | 7.79 | 385 | 360 | 98.8 |
| B | 2 | 9 | 1198 | 10.85 | 379 | 360 | 77.2 |
| B | 3 | 17 | 1014 | 8.47 | 379 | 360 | 77.2 |
| B | 2 | 8 | 992 | 8.18 | 379 | 360 | 77.2 |
| C | 12 | 241 | 1089 | 7.24 | 384 | 358 | 101.0 |
| C | 1 | 81 | 1077 | 7.12 | 384 | 358 | 101.0 |
| C | 1 | 80 | 1004 | 6.4 | 384 | 358 | 101.0 |
| D | 7 | 3 | 913 | 6.14 | 353 | 320 | 96.5 |
| D | 6 | 67 | 883 | 5.83 | 353 | 320 | 96.5 |
| D | 1 | 3 | 876 | 5.76 | 353 | 320 | 96.5 |
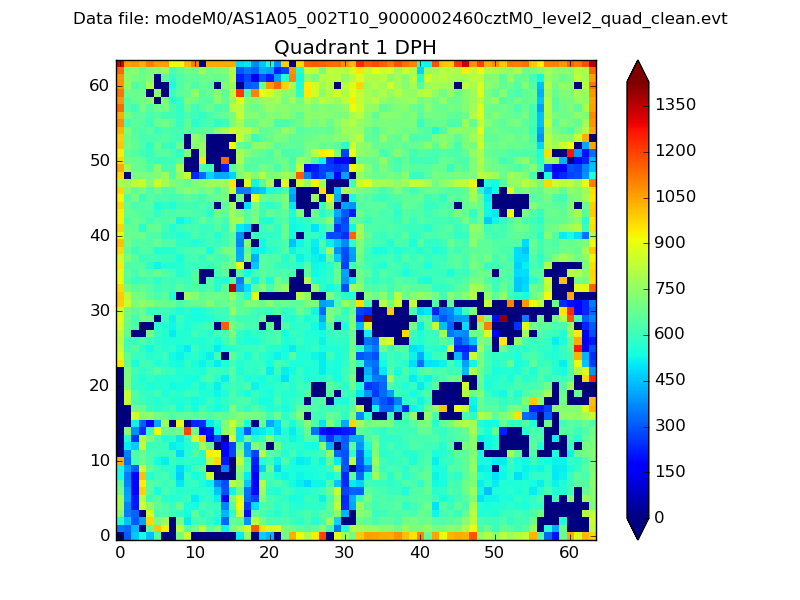
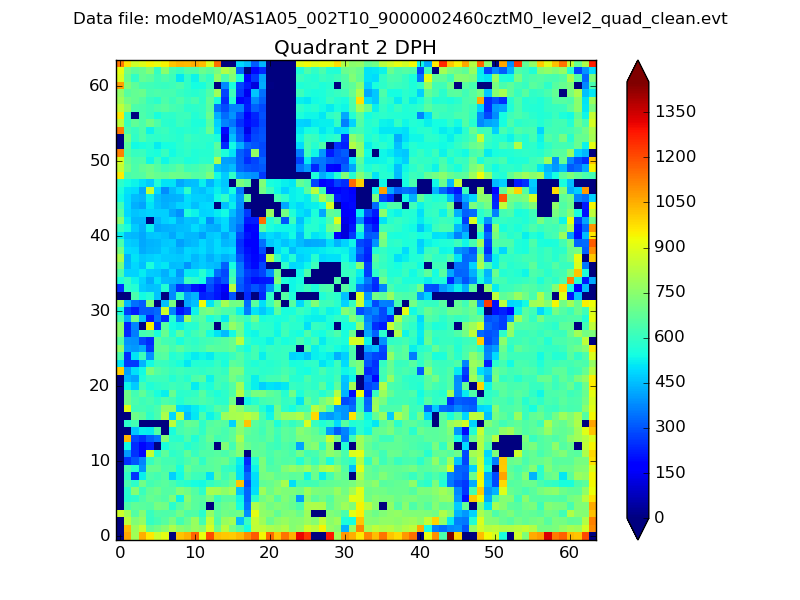
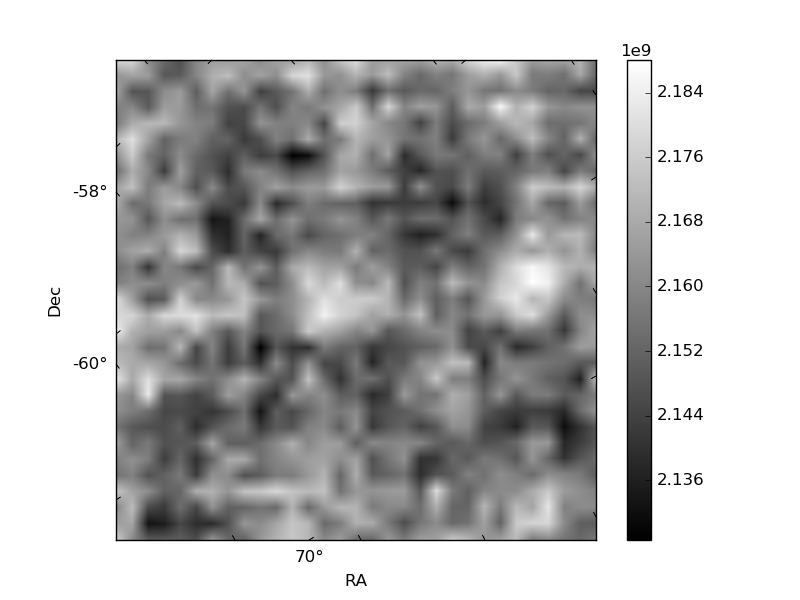
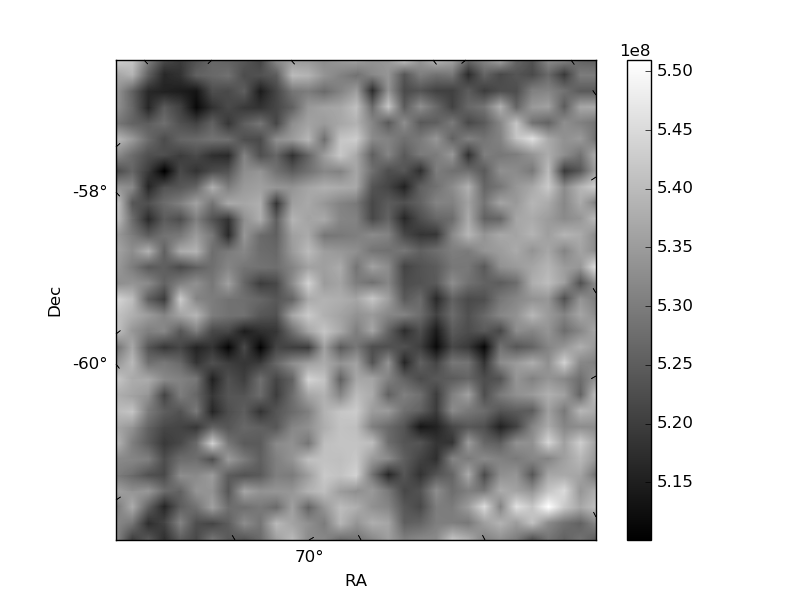
Histogram calculated using DETX and DETY for each event in the final _common_clean file
| Quadrant A |  |
 |
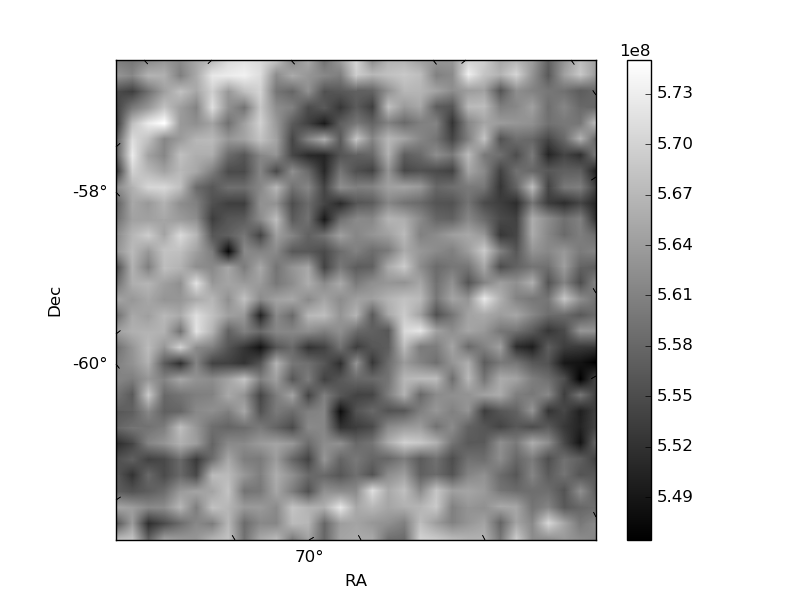
Quadrant B |
|---|---|---|---|
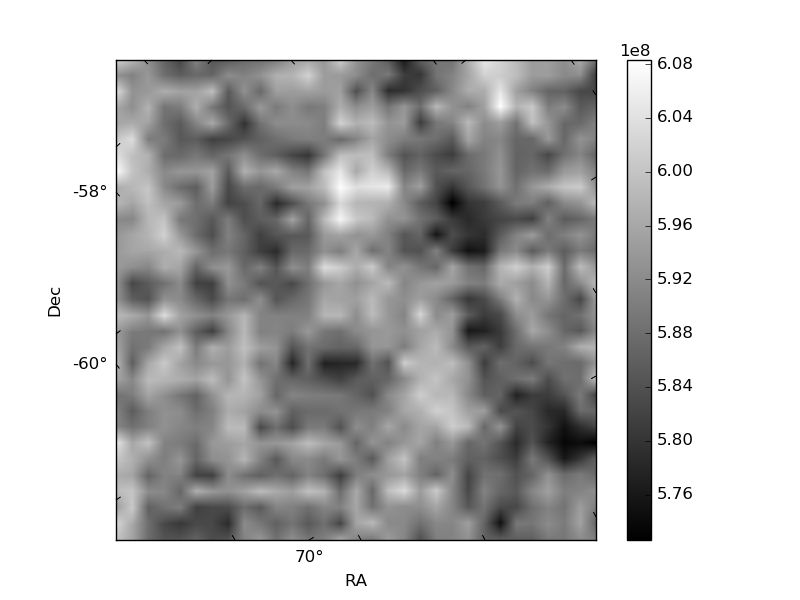
| Quadrant D | 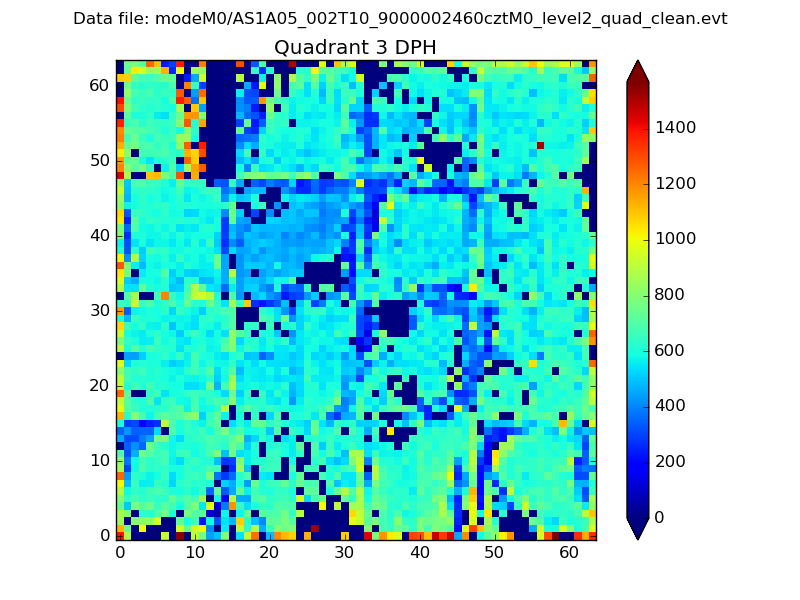 |
 |
Quadrant C |
| Plot type | Count rate plots | Images |
|---|---|---|
| Comparison with Poisson distribution Blue bars denote a histogram of data divided into 1 sec bins. Red curve is a Poisson curve with rate = median count rate of data. |
 |
 |
| Quadrant-wise count rates Data is divided into 100 sec bins |
 |
|
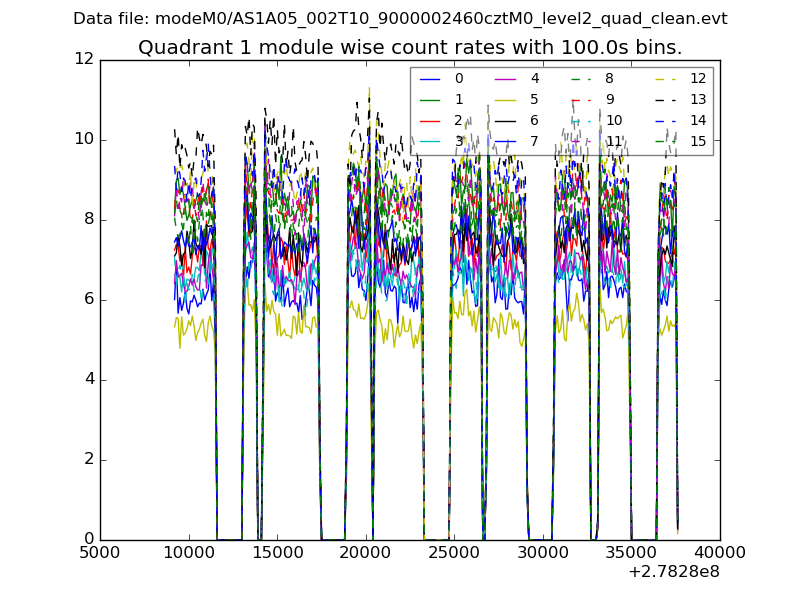
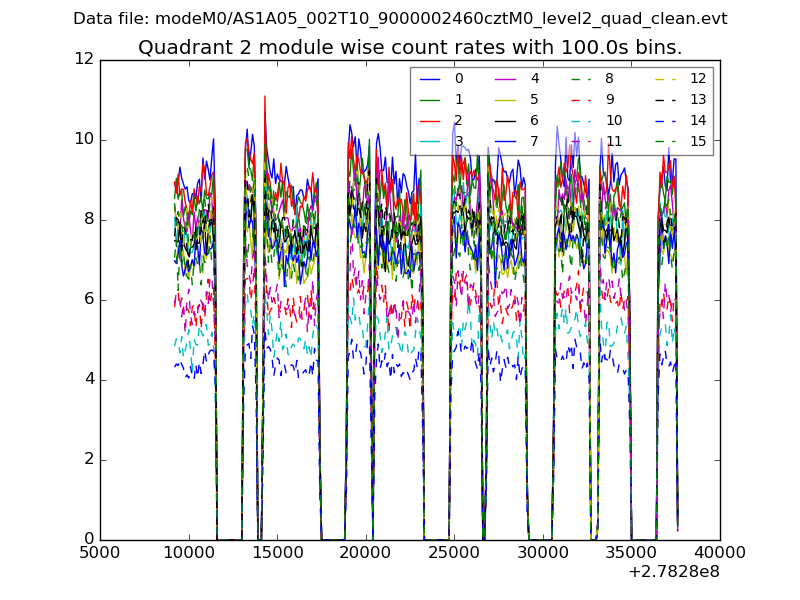
| Module-wise count rates for Quadrant A Data is divided into 100 sec bins |
 |
 |
| Module-wise count rates for Quadrant B Data is divided into 100 sec bins |
 |
 |
| Module-wise count rates for Quadrant C Data is divided into 100 sec bins |
 |
 |
| Module-wise count rates for Quadrant D Data is divided into 100 sec bins |
 |
 |
| Parameter | Plot |
|---|---|
| CZT HV Monitor | 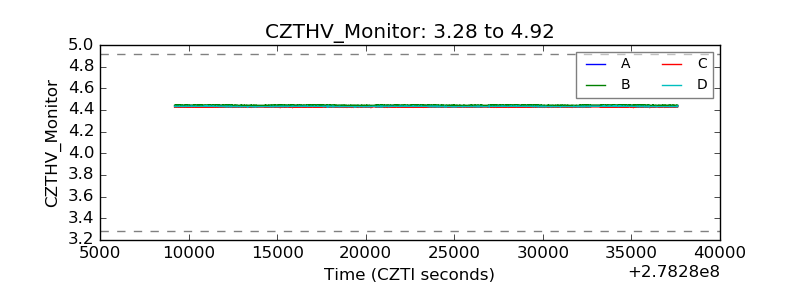 |
| D_VDD |  |
| Temperature 1 |  |
| Veto HV Monitor |  |
| Veto LLD |  |
| Alpha Counter |  |
| _CPM_Rate |  |
| CZT Counter |  |
| +2.5 Volts monitor |  |
| +5 Volts monitor |  |
| _ROLL_ROT |  |
| _Roll_DEC |  |
| _Roll_RA |  |
| Veto Counter |  |