| Param | Original file | Final file |
|---|---|---|
| Filename | modeM0/AS1A05_002T10_9000002460_16648cztM0_level2.evt | modeM0/AS1A05_002T10_9000002460_16648cztM0_level2_quad_clean.evt |
| Size (bytes) | 32,276,160 | 9,377,280 |
| Size | 30.8 MB | 8.9 MB |
| Events in quadrant A | 224,378 | 61,277 |
| Events in quadrant B | 217,692 | 62,680 |
| Events in quadrant C | 218,813 | 58,977 |
| Events in quadrant D | 278,328 | 56,953 |
| Mode SS | |||
|---|---|---|---|
| Quadrant | BADHDUFLAG | Total packets | Discarded packets |
| A | 0 | 10 | 0 |
| B | 0 | 10 | 0 |
| C | 0 | 10 | 0 |
| D | 0 | 10 | 0 |
| Mode M0 | |||
|---|---|---|---|
| Quadrant | BADHDUFLAG | Total packets | Discarded packets |
| A | 0 | 1067 | 1 |
| B | 0 | 1023 | 0 |
| C | 0 | 1021 | 0 |
| D | 0 | 1215 | 0 |
| Quadrant | Total seconds | Saturated seconds | Saturation percentage |
|---|---|---|---|
| A | 510 | 3 | 0.588235% |
| B | 510 | 0 | 0.000000% |
| C | 510 | 0 | 0.000000% |
| D | 510 | 11 | 2.156863% |
Noise dominated data is calculated using 1-second bins in cleaned event files. If a bin has >2000 counts, and if more than 50% of those come from <1% of pixels, then it is considered to be noise-dominated and hence unusable.
| Quadrant | # 1 sec bins | Bins with >0 counts | Bins with >2000 counts | High rate bins dominated by noise | Noise dominated (total time) | Noise dominated (detector-on time) | Marked lightcurve |
|---|---|---|---|---|---|---|---|
| A | 511 | 511 | 2 | 2 | 0.39% | 0.39% | 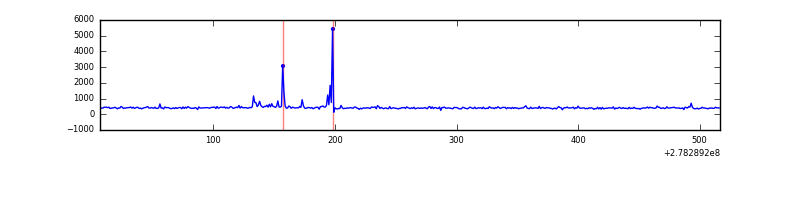 |
| B | 511 | 511 | 0 | 0 | 0.00% | 0.00% | 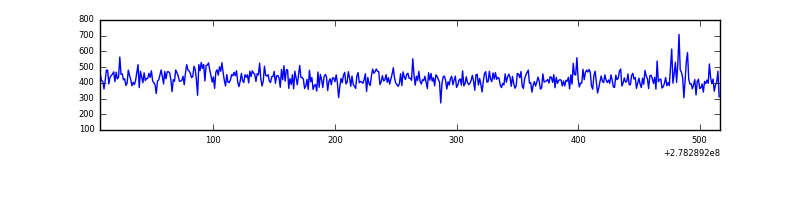 |
| C | 511 | 511 | 0 | 0 | 0.00% | 0.00% | 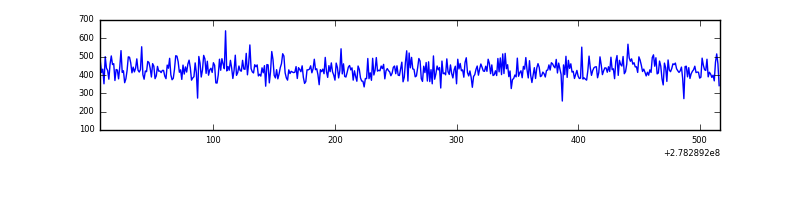 |
| D | 511 | 511 | 16 | 16 | 3.13% | 3.13% | 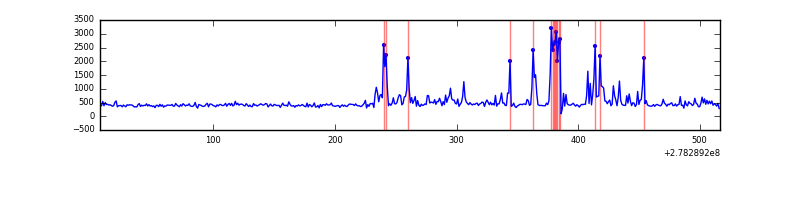 |
Top three noisy pixels from each quadrant. If the there are fewer than three noisy pixels in the level2.evt file, extra rows are filled as -1
| Pixel properties | Quadrant properties | ||||||
|---|---|---|---|---|---|---|---|
| Quadrant | DetID | PixID | Counts | Sigma | Mean | Median | Sigma |
| A | 9 | 143 | 19162 | 1502.54 | 53 | 51 | 12.7 |
| A | 0 | 226 | 433 | 30.03 | 53 | 51 | 12.7 |
| A | 12 | 194 | 381 | 25.95 | 53 | 51 | 12.7 |
| B | 0 | 214 | 2277 | 177.42 | 54 | 52 | 12.5 |
| B | 0 | 229 | 1935 | 150.15 | 54 | 52 | 12.5 |
| B | 3 | 209 | 1731 | 133.88 | 54 | 52 | 12.5 |
| C | 3 | 233 | 7773 | 551.92 | 52 | 52 | 14.0 |
| C | 14 | 238 | 7728 | 548.7 | 52 | 52 | 14.0 |
| C | 13 | 61 | 335 | 20.23 | 52 | 52 | 14.0 |
| D | 1 | 52 | 70348 | 4941.45 | 50 | 48 | 14.2 |
| D | 5 | 222 | 14662 | 1027.23 | 50 | 48 | 14.2 |
| D | 8 | 195 | 2244 | 154.36 | 50 | 48 | 14.2 |
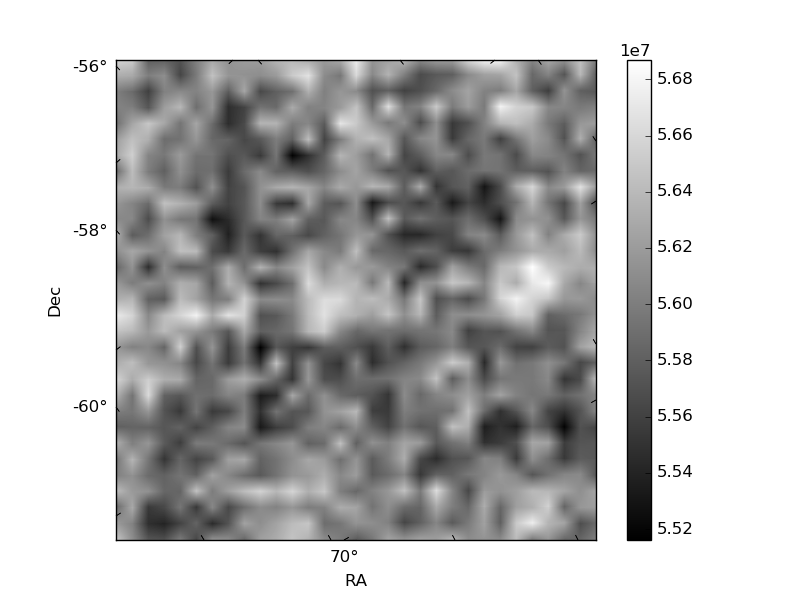
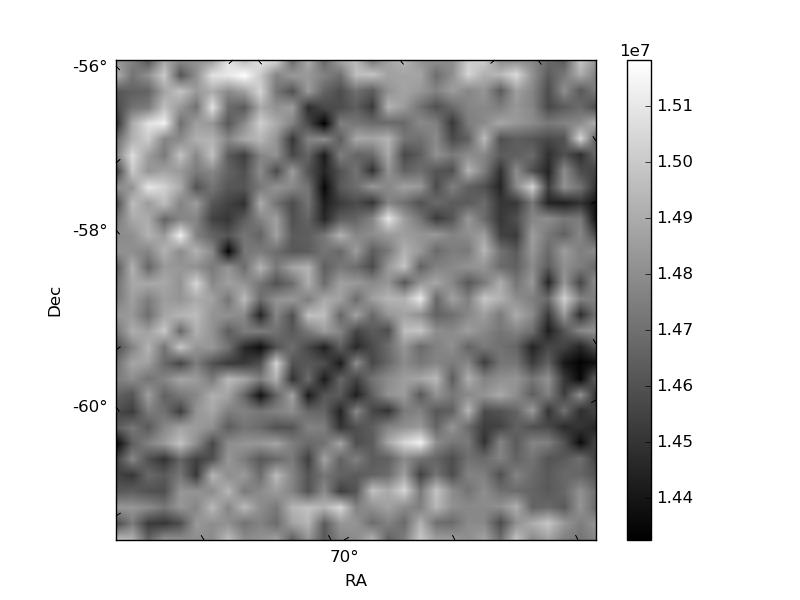
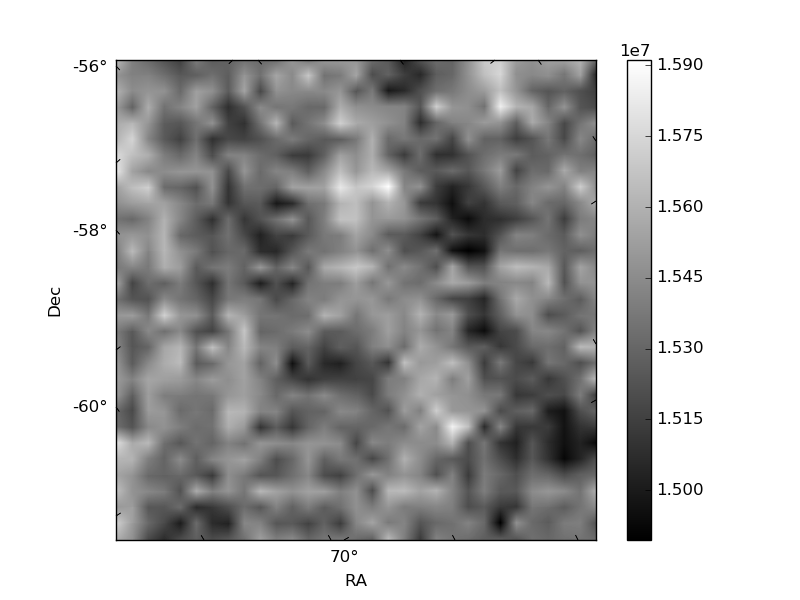
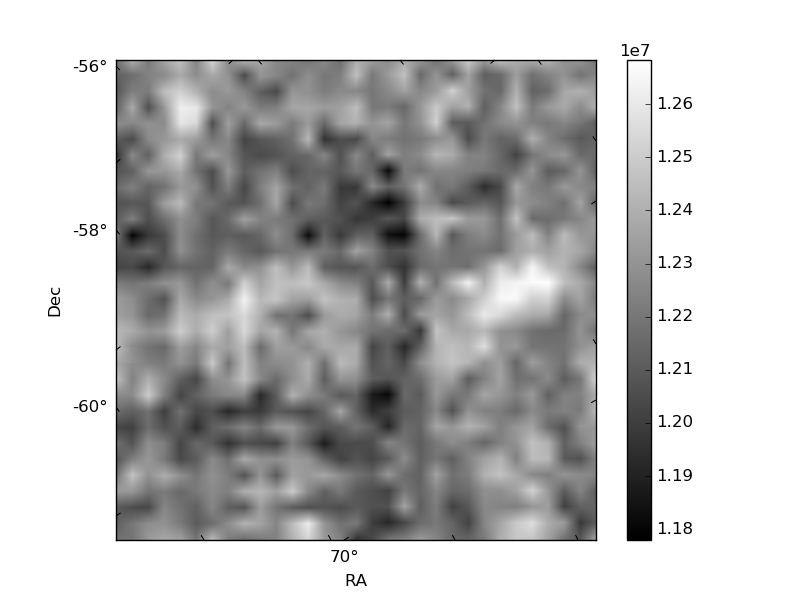
Histogram calculated using DETX and DETY for each event in the final _common_clean file
| Quadrant A | 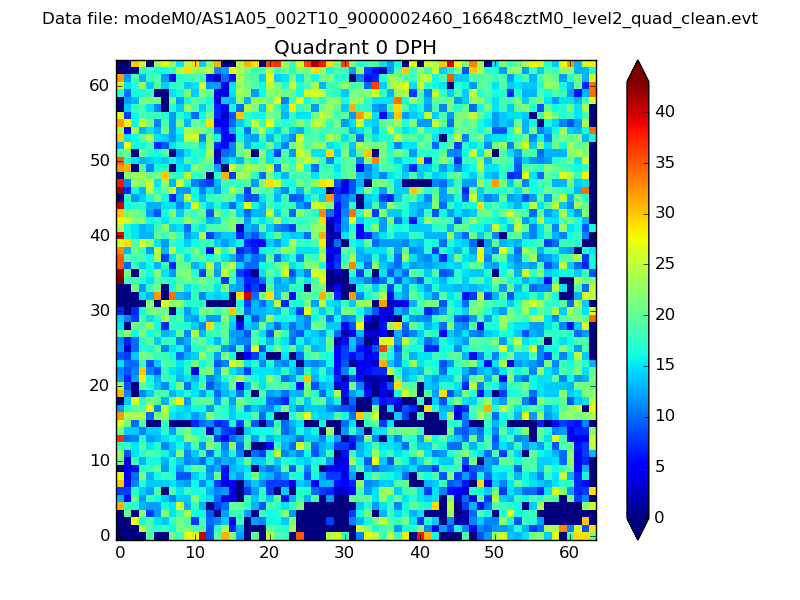 |
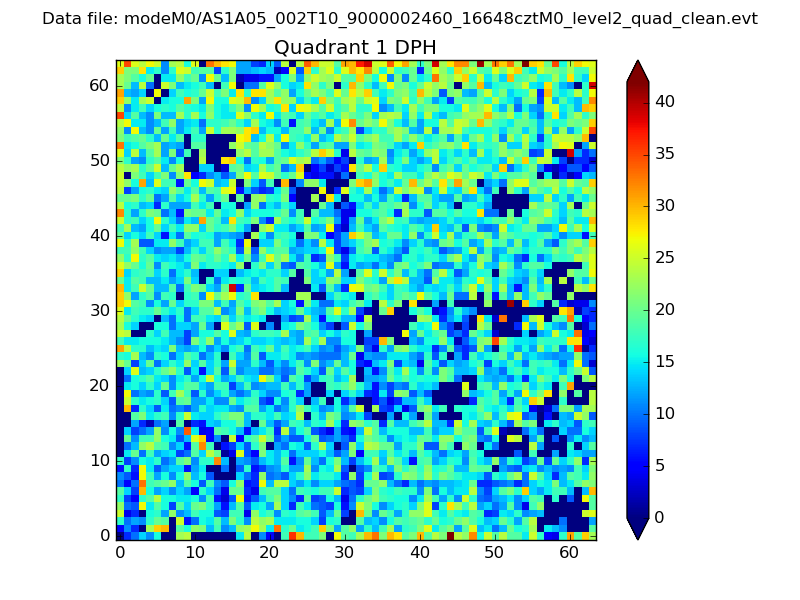 |
Quadrant B |
|---|---|---|---|
| Quadrant D | 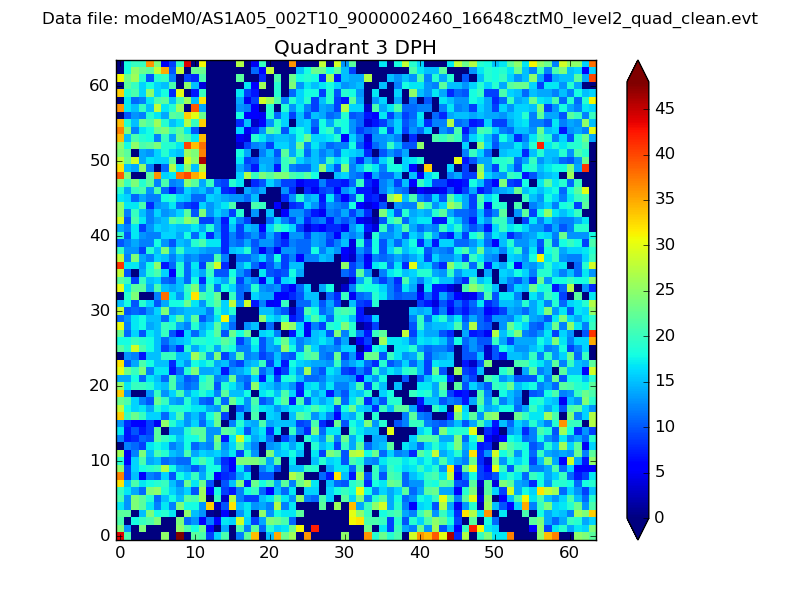 |
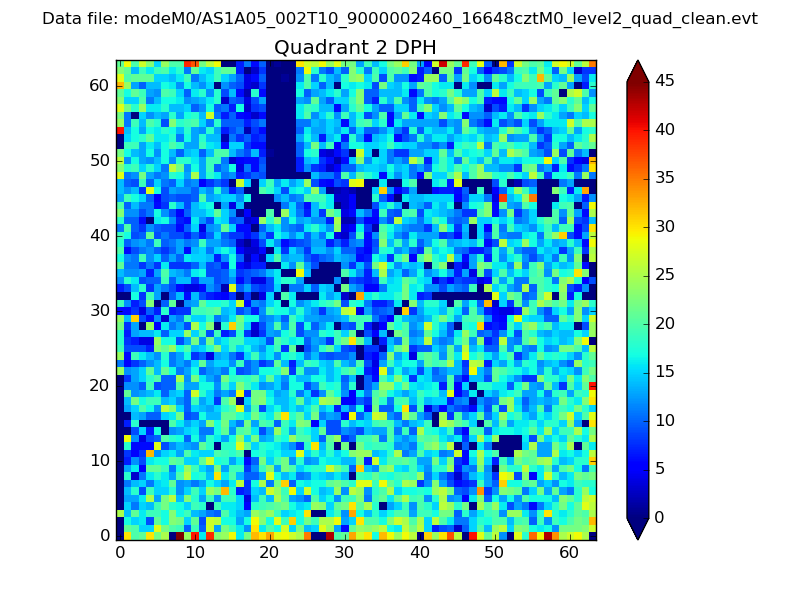 |
Quadrant C |
| Plot type | Count rate plots | Images |
|---|---|---|
| Comparison with Poisson distribution Blue bars denote a histogram of data divided into 1 sec bins. Red curve is a Poisson curve with rate = median count rate of data. |
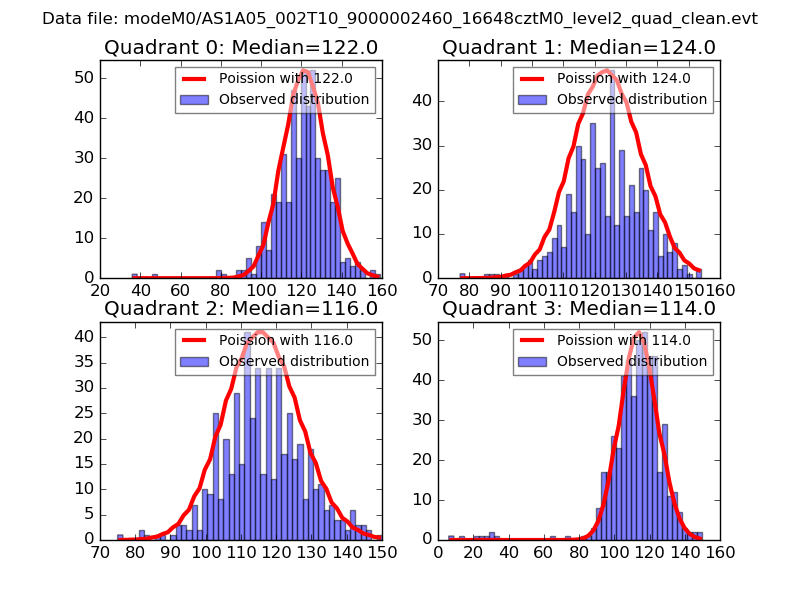 |
 |
| Quadrant-wise count rates Data is divided into 100 sec bins |
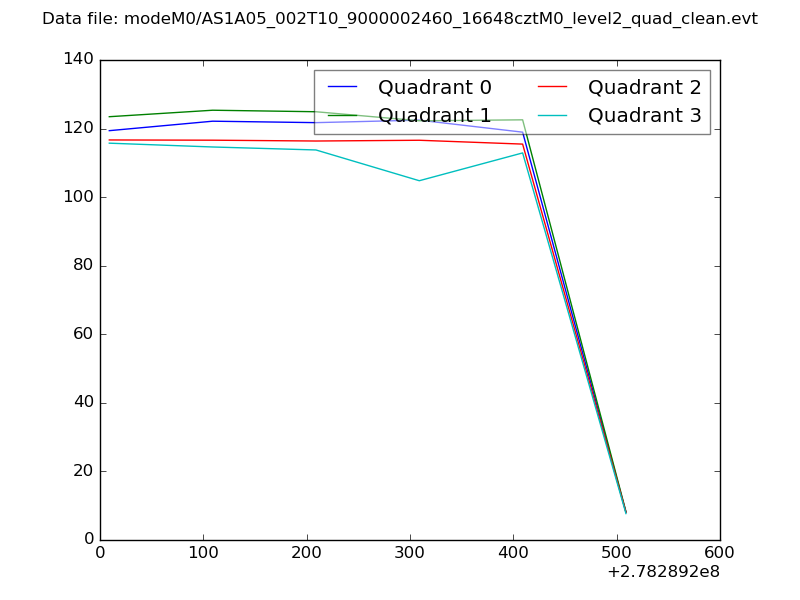 |
|
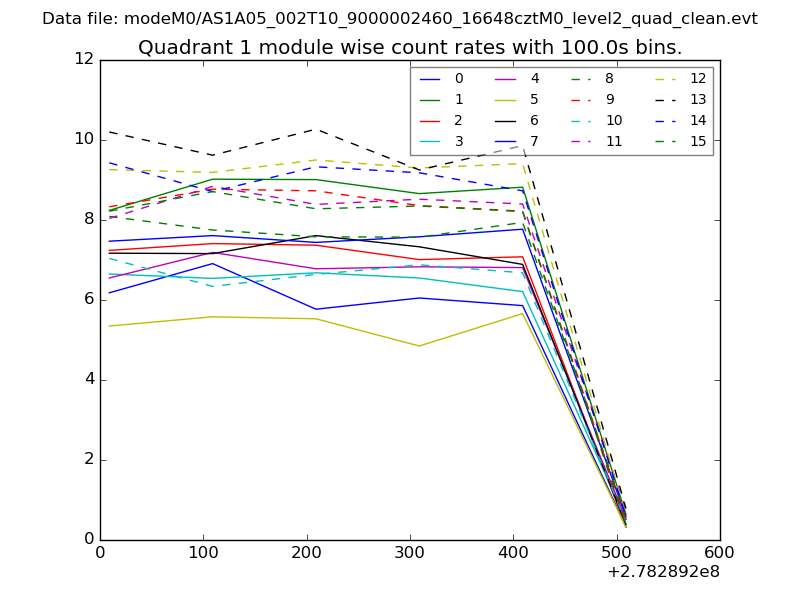
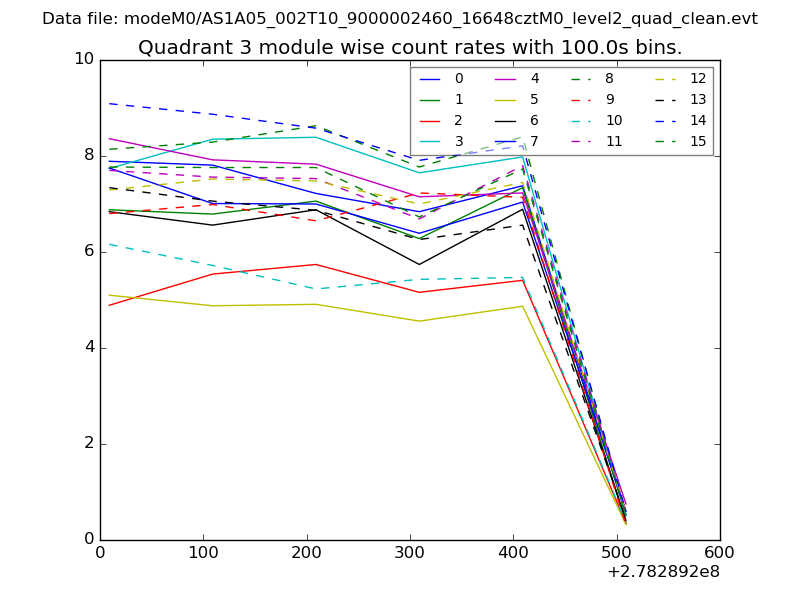
| Module-wise count rates for Quadrant A Data is divided into 100 sec bins |
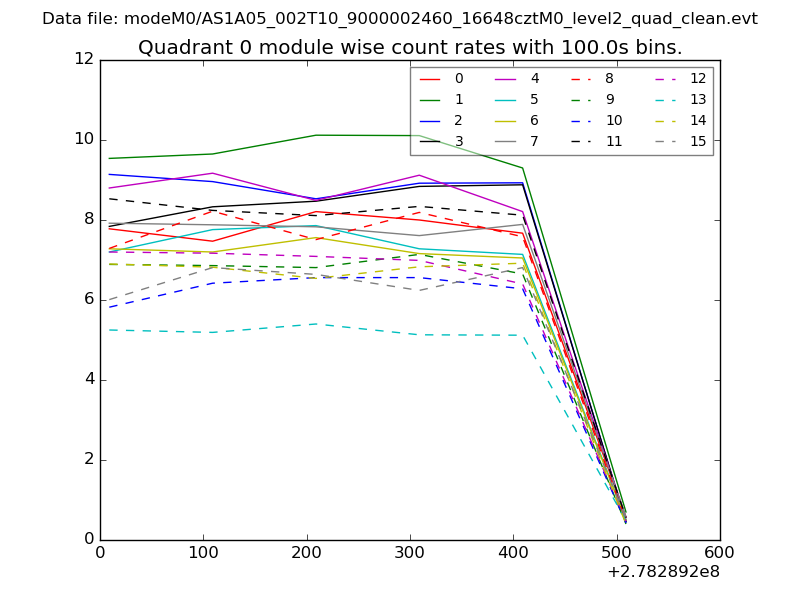 |
 |
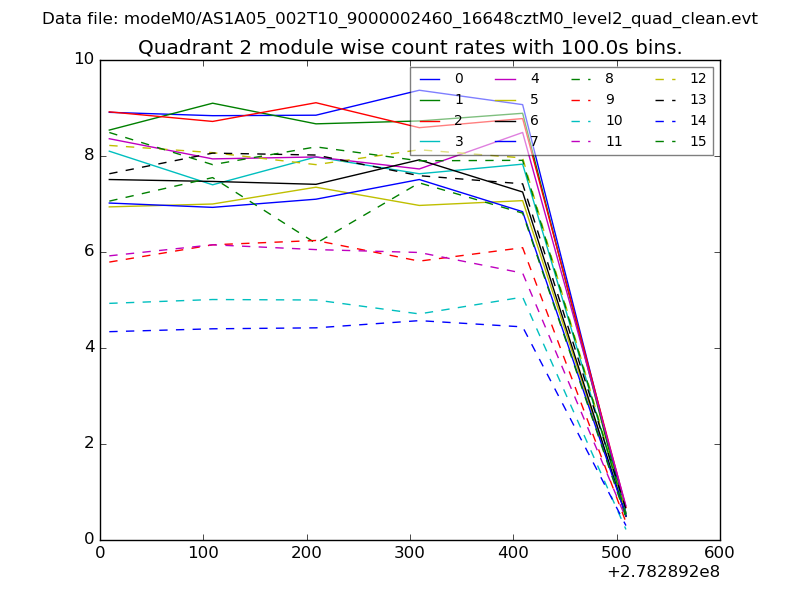
| Module-wise count rates for Quadrant B Data is divided into 100 sec bins |
 |
 |
| Module-wise count rates for Quadrant C Data is divided into 100 sec bins |
 |
 |
| Module-wise count rates for Quadrant D Data is divided into 100 sec bins |
 |
 |
| Parameter | Plot |
|---|---|
| CZT HV Monitor | 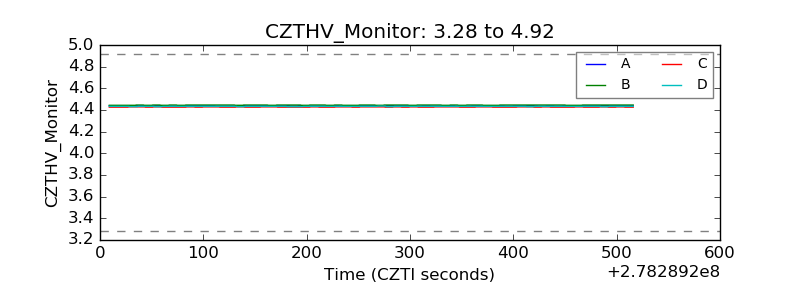 |
| D_VDD | 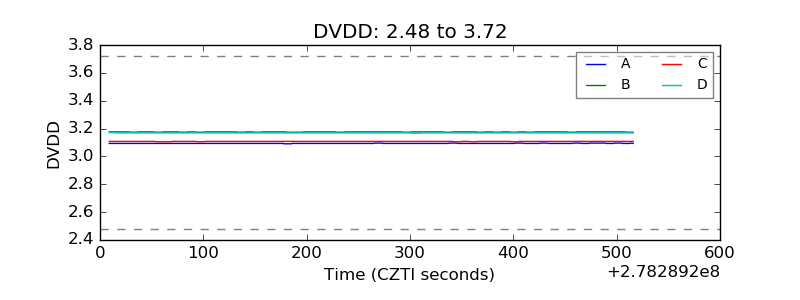 |
| Temperature 1 |  |
| Veto HV Monitor | 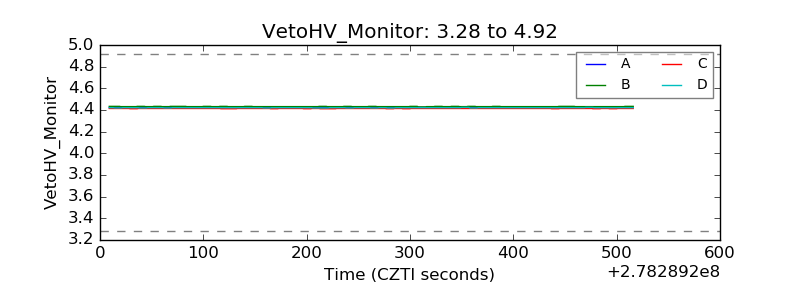 |
| Veto LLD | 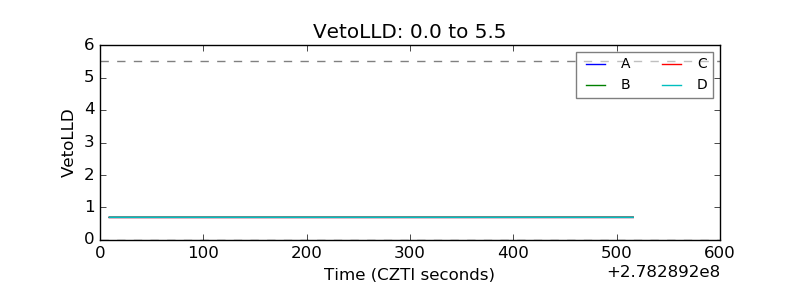 |
| Alpha Counter | 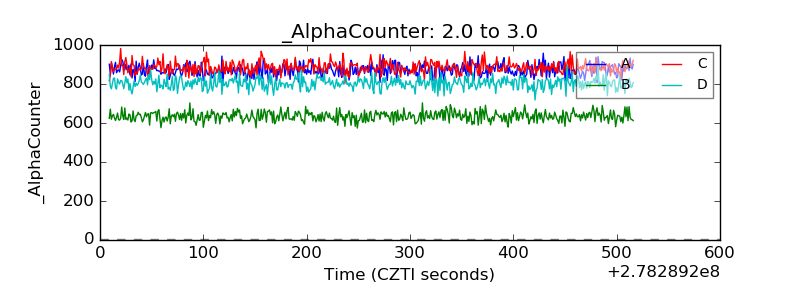 |
| _CPM_Rate | 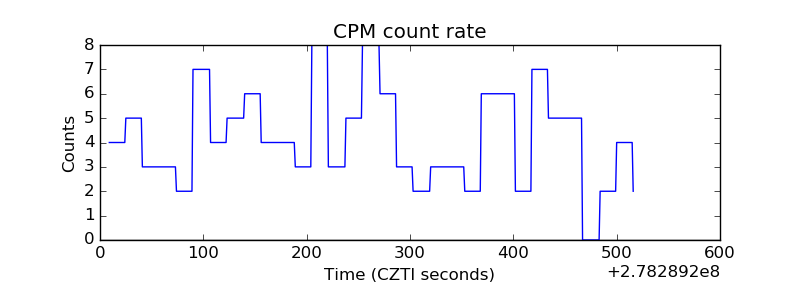 |
| CZT Counter | 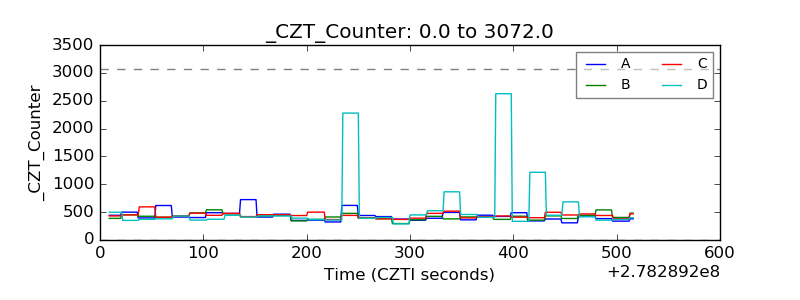 |
| +2.5 Volts monitor |  |
| +5 Volts monitor | 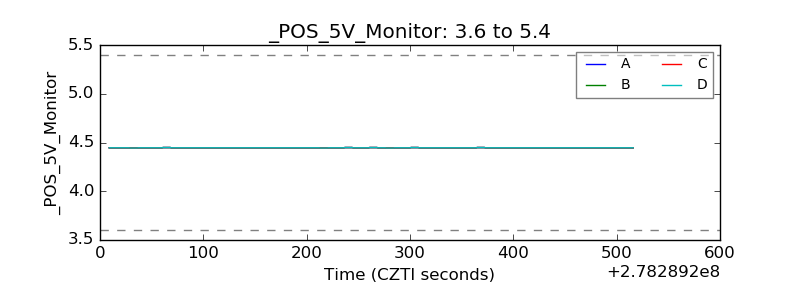 |
| _ROLL_ROT | 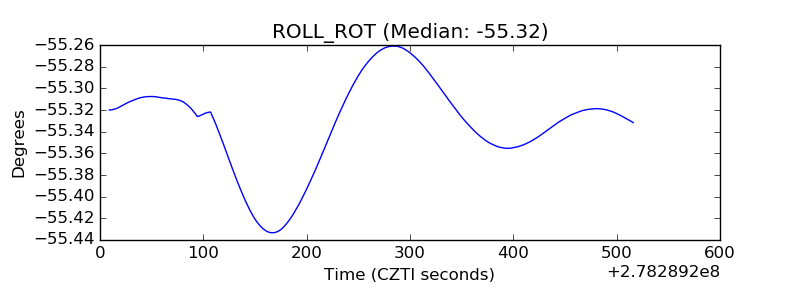 |
| _Roll_DEC | 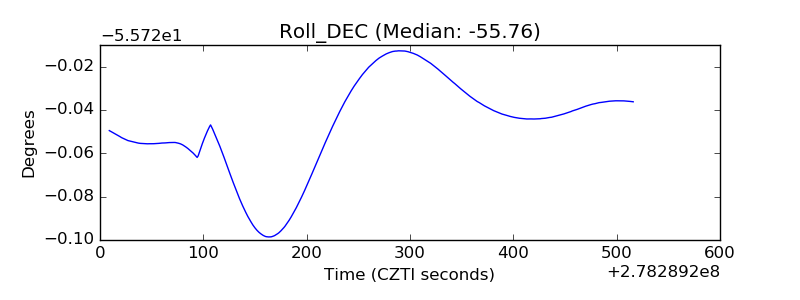 |
| _Roll_RA | 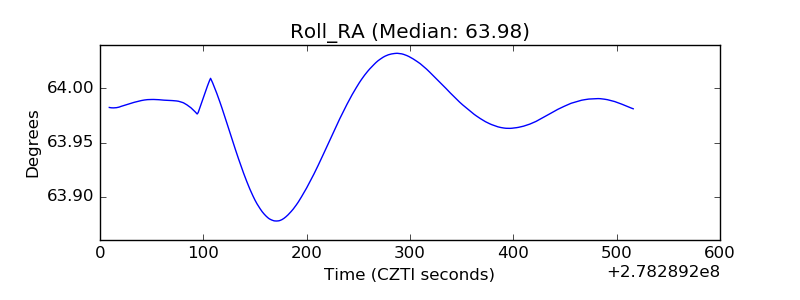 |
| Veto Counter | 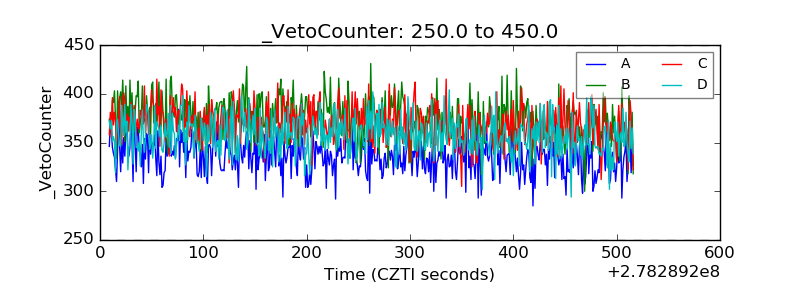 |