| Param | Original file | Final file |
|---|---|---|
| Filename | modeM0/AS1A05_002T10_9000002460_16649cztM0_level2.evt | modeM0/AS1A05_002T10_9000002460_16649cztM0_level2_quad_clean.evt |
| Size (bytes) | 441,368,640 | 90,823,680 |
| Size | 420.9 MB | 86.6 MB |
| Events in quadrant A | 2,977,792 | 587,124 |
| Events in quadrant B | 3,078,585 | 602,149 |
| Events in quadrant C | 2,953,130 | 569,710 |
| Events in quadrant D | 3,926,226 | 549,106 |
| Mode SS | |||
|---|---|---|---|
| Quadrant | BADHDUFLAG | Total packets | Discarded packets |
| A | 0 | 128 | 0 |
| B | 0 | 128 | 0 |
| C | 0 | 128 | 0 |
| D | 0 | 128 | 0 |
| Mode M0 | |||
|---|---|---|---|
| Quadrant | BADHDUFLAG | Total packets | Discarded packets |
| A | 0 | 13233 | 2 |
| B | 0 | 13404 | 1 |
| C | 0 | 12915 | 1 |
| D | 0 | 16244 | 1 |
| Mode M9 | |||
|---|---|---|---|
| Quadrant | BADHDUFLAG | Total packets | Discarded packets |
| A | 0 | 4 | 0 |
| B | 0 | 4 | 0 |
| C | 0 | 4 | 0 |
| D | 0 | 4 | 0 |
| Quadrant | Total seconds | Saturated seconds | Saturation percentage |
|---|---|---|---|
| A | 6343 | 30 | 0.472962% |
| B | 6343 | 44 | 0.693678% |
| C | 6343 | 53 | 0.835567% |
| D | 6343 | 210 | 3.310736% |
Noise dominated data is calculated using 1-second bins in cleaned event files. If a bin has >2000 counts, and if more than 50% of those come from <1% of pixels, then it is considered to be noise-dominated and hence unusable.
| Quadrant | # 1 sec bins | Bins with >0 counts | Bins with >2000 counts | High rate bins dominated by noise | Noise dominated (total time) | Noise dominated (detector-on time) | Marked lightcurve |
|---|---|---|---|---|---|---|---|
| A | 6729 | 6345 | 15 | 15 | 0.22% | 0.24% | 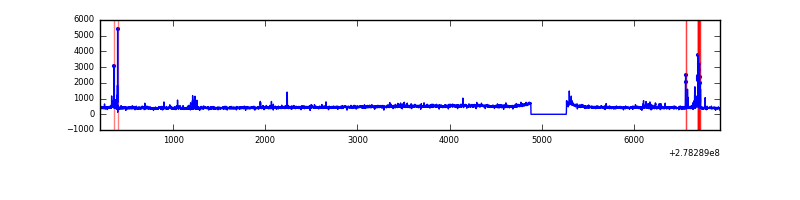 |
| B | 6729 | 6345 | 1 | 1 | 0.01% | 0.02% | 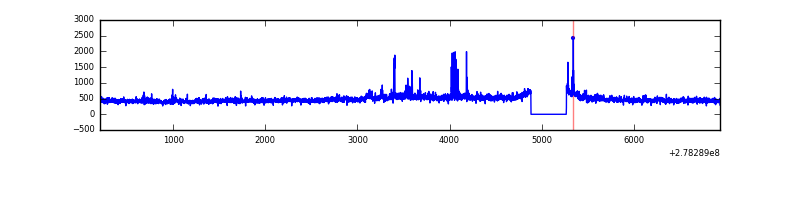 |
| C | 6729 | 6345 | 0 | 0 | 0.00% | 0.00% | 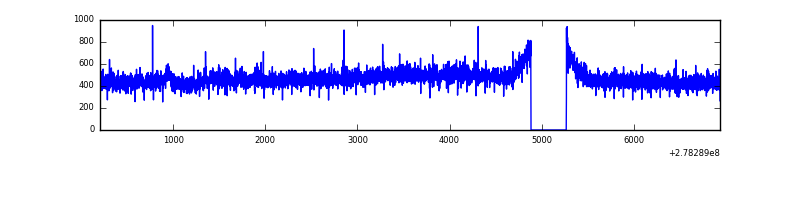 |
| D | 6729 | 6345 | 128 | 128 | 1.90% | 2.02% | 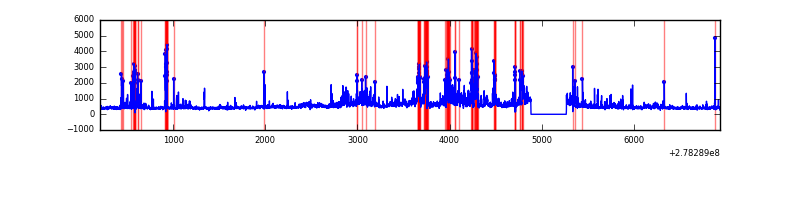 |
Top three noisy pixels from each quadrant. If the there are fewer than three noisy pixels in the level2.evt file, extra rows are filled as -1
| Pixel properties | Quadrant properties | ||||||
|---|---|---|---|---|---|---|---|
| Quadrant | DetID | PixID | Counts | Sigma | Mean | Median | Sigma |
| A | 9 | 143 | 118299 | 799.25 | 734 | 719 | 147.1 |
| A | 15 | 223 | 18035 | 117.71 | 734 | 719 | 147.1 |
| A | 3 | 1 | 15059 | 97.48 | 734 | 719 | 147.1 |
| B | 15 | 35 | 72114 | 501.75 | 740 | 720 | 142.3 |
| B | 0 | 198 | 29219 | 200.29 | 740 | 720 | 142.3 |
| B | 0 | 189 | 24921 | 170.08 | 740 | 720 | 142.3 |
| C | 14 | 238 | 109154 | 654.59 | 712 | 716 | 165.7 |
| C | 3 | 233 | 64094 | 382.58 | 712 | 716 | 165.7 |
| C | 13 | 61 | 5045 | 26.13 | 712 | 716 | 165.7 |
| D | 1 | 52 | 1075858 | 6270.55 | 706 | 685 | 171.5 |
| D | 10 | 70 | 87678 | 507.35 | 706 | 685 | 171.5 |
| D | 5 | 222 | 47121 | 270.82 | 706 | 685 | 171.5 |
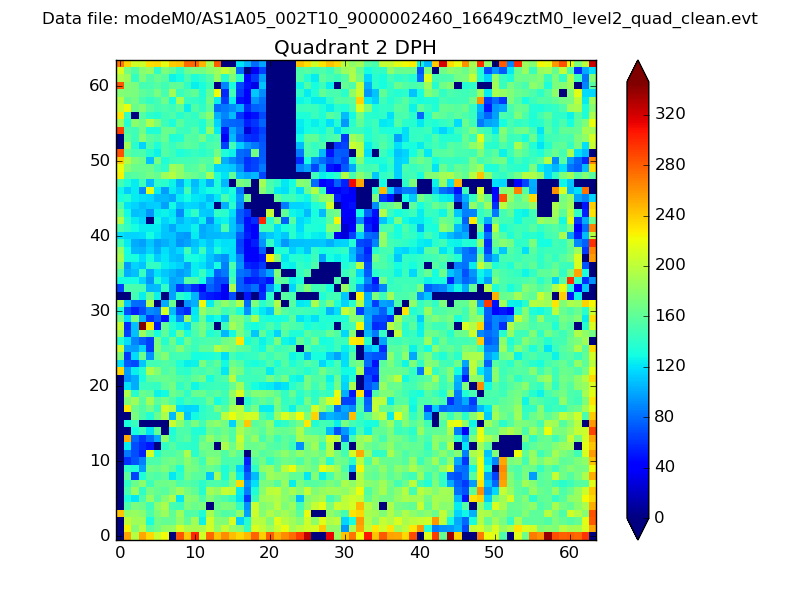
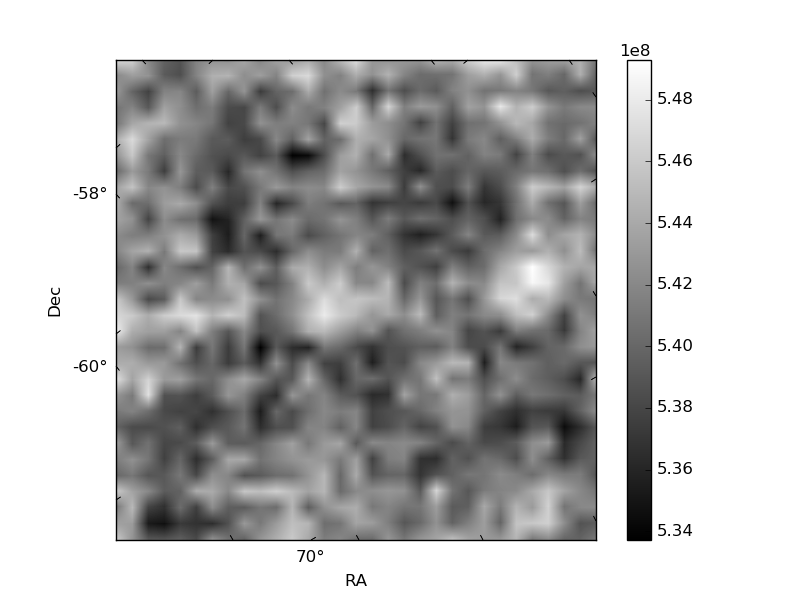
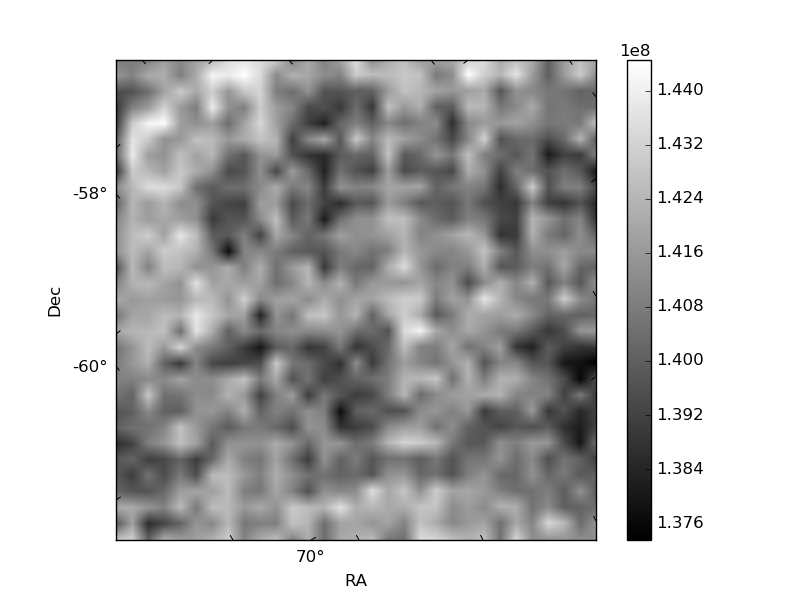
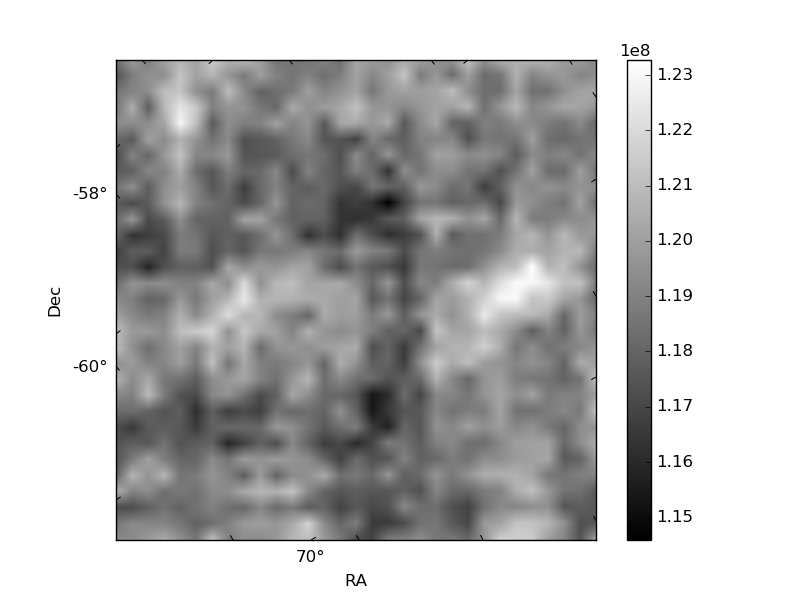
Histogram calculated using DETX and DETY for each event in the final _common_clean file
| Quadrant A | 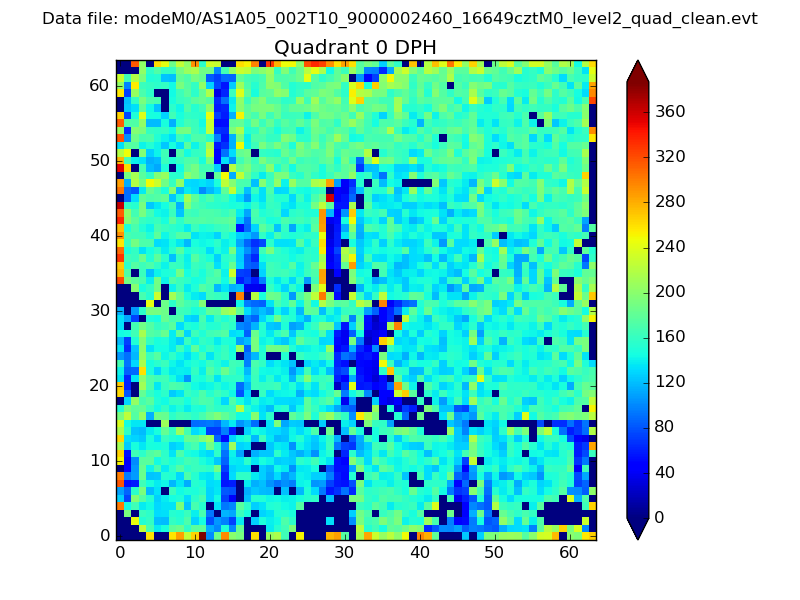 |
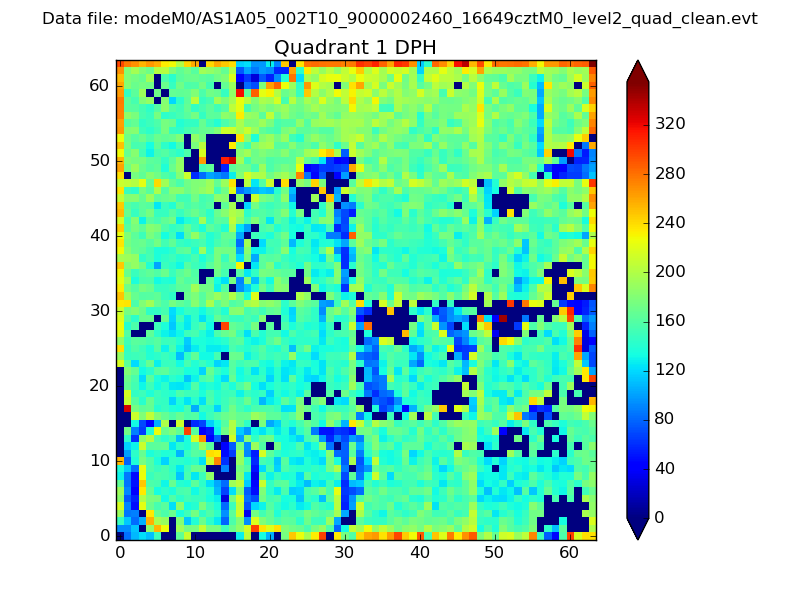 |
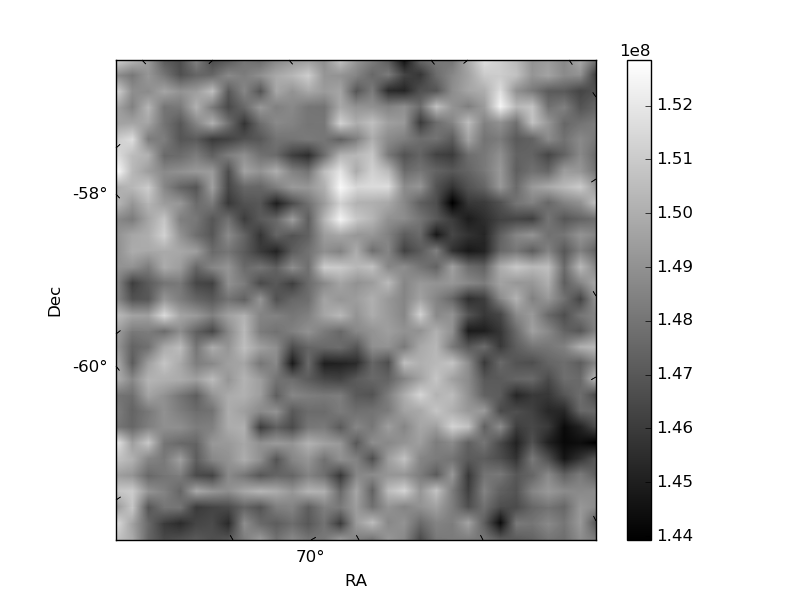
Quadrant B |
|---|---|---|---|
| Quadrant D | 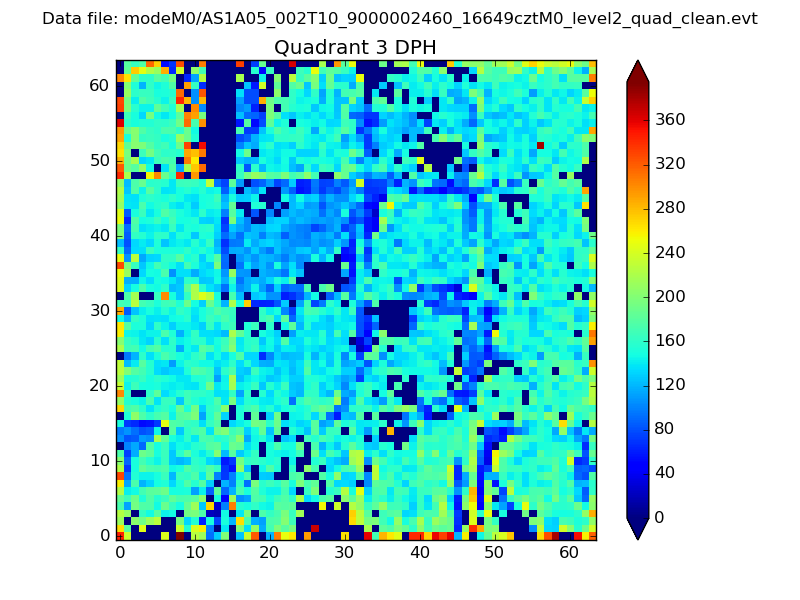 |
 |
Quadrant C |
| Plot type | Count rate plots | Images |
|---|---|---|
| Comparison with Poisson distribution Blue bars denote a histogram of data divided into 1 sec bins. Red curve is a Poisson curve with rate = median count rate of data. |
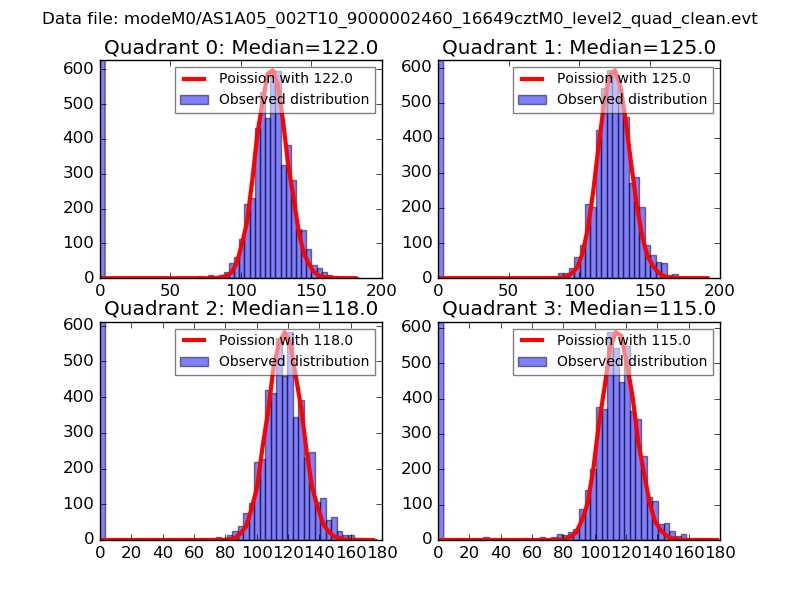 |
 |
| Quadrant-wise count rates Data is divided into 100 sec bins |
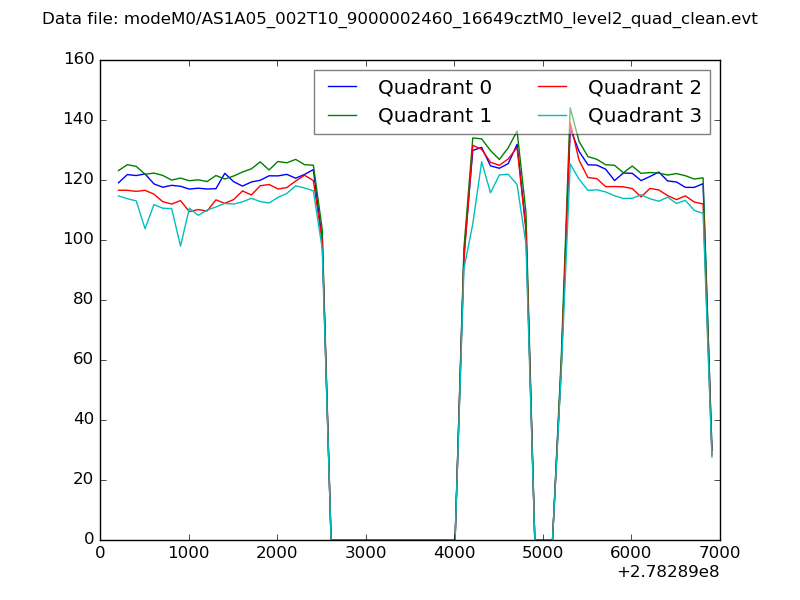 |
|
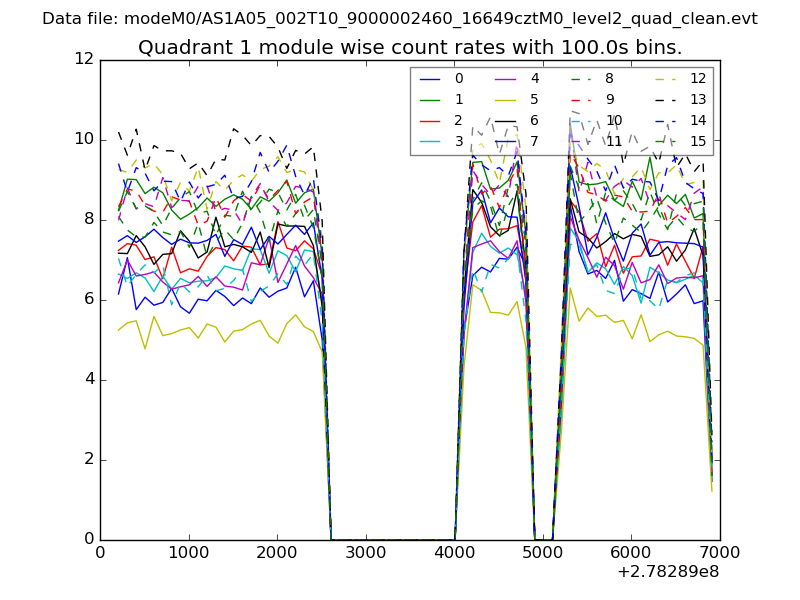
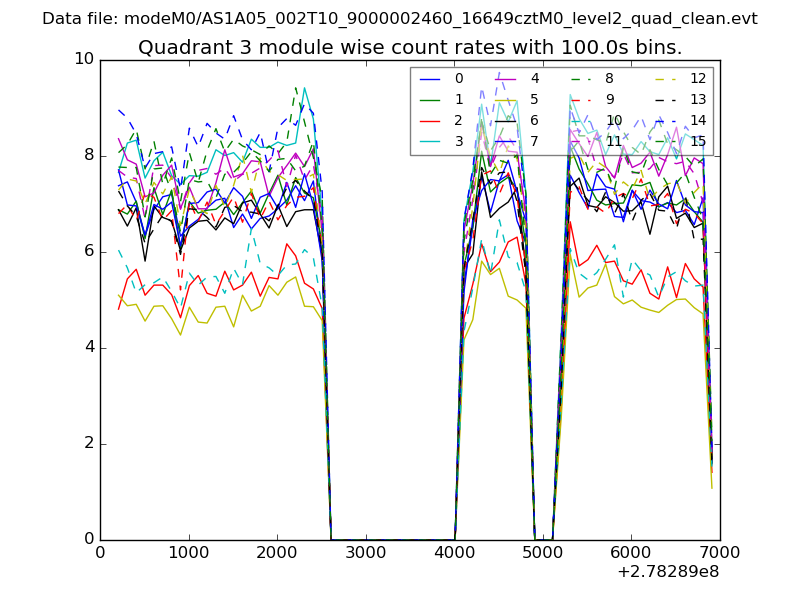
| Module-wise count rates for Quadrant A Data is divided into 100 sec bins |
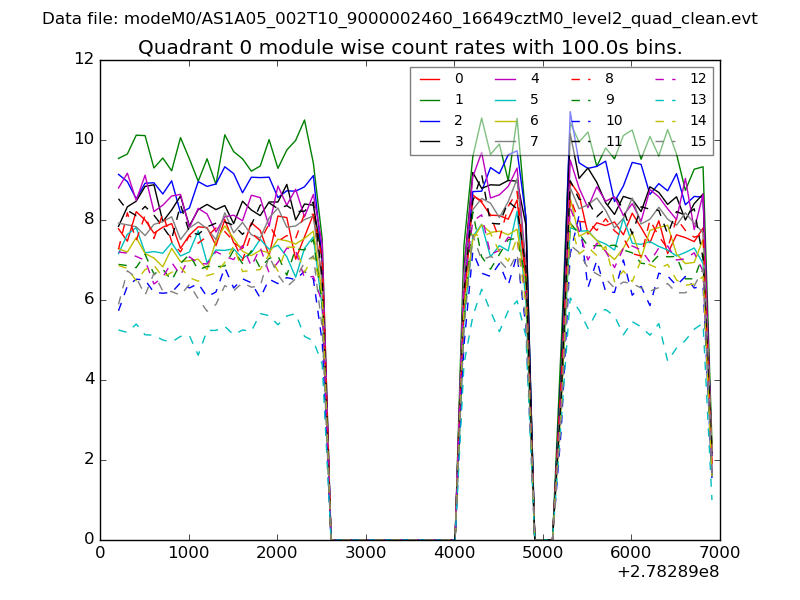 |
 |
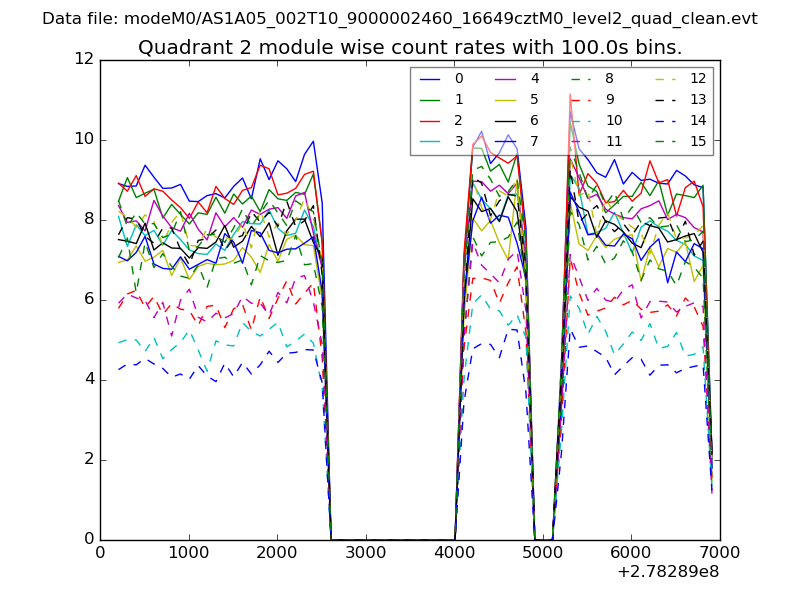
| Module-wise count rates for Quadrant B Data is divided into 100 sec bins |
 |
 |
| Module-wise count rates for Quadrant C Data is divided into 100 sec bins |
 |
 |
| Module-wise count rates for Quadrant D Data is divided into 100 sec bins |
 |
 |
| Parameter | Plot |
|---|---|
| CZT HV Monitor | 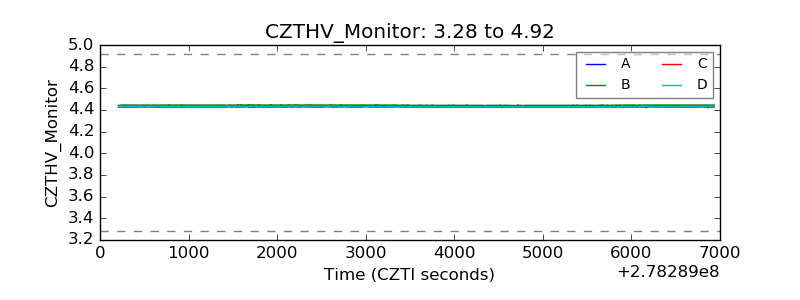 |
| D_VDD | 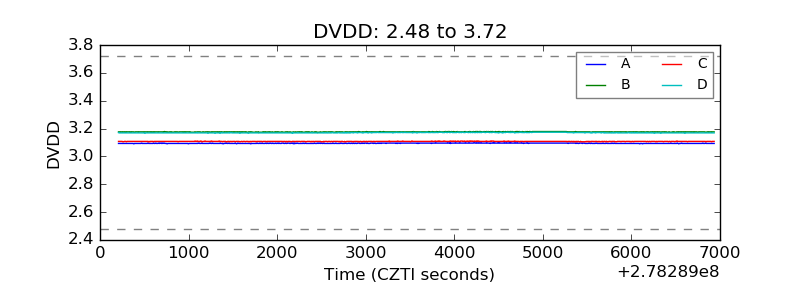 |
| Temperature 1 |  |
| Veto HV Monitor | 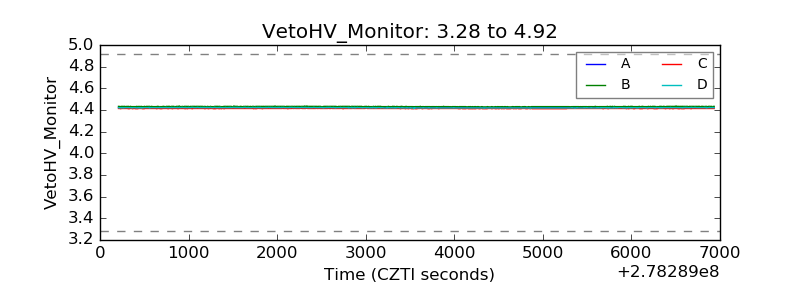 |
| Veto LLD | 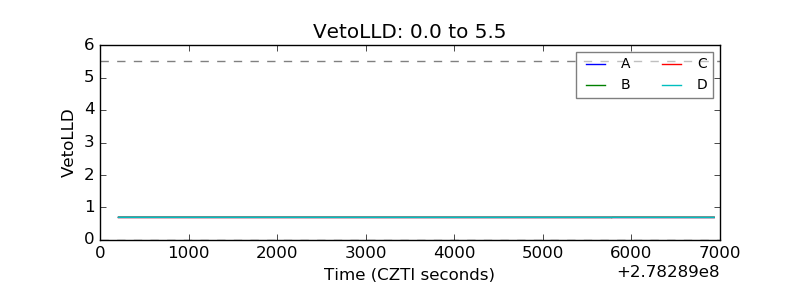 |
| Alpha Counter | 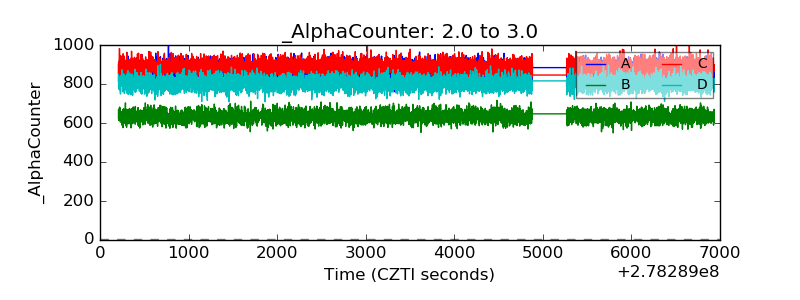 |
| _CPM_Rate | 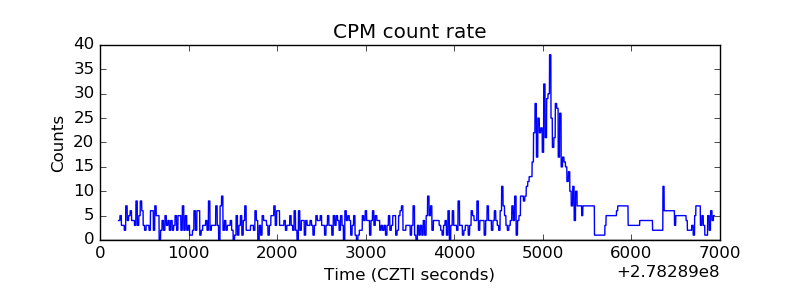 |
| CZT Counter | 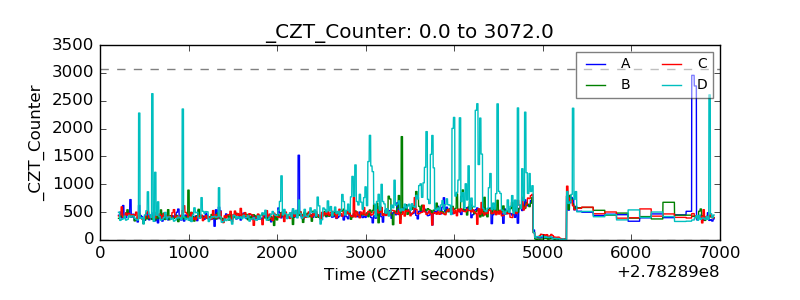 |
| +2.5 Volts monitor |  |
| +5 Volts monitor |  |
| _ROLL_ROT | 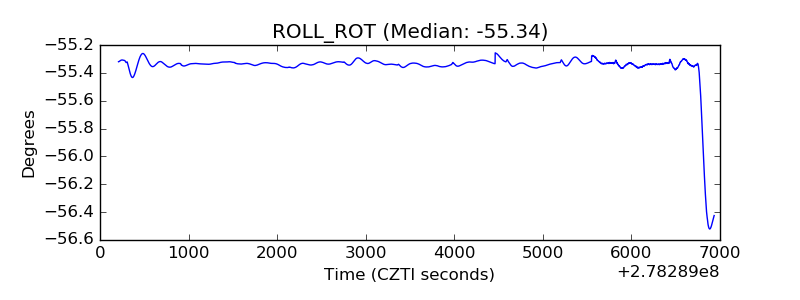 |
| _Roll_DEC | 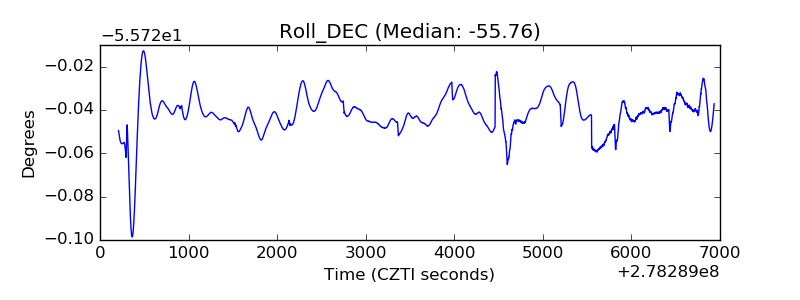 |
| _Roll_RA |  |
| Veto Counter | 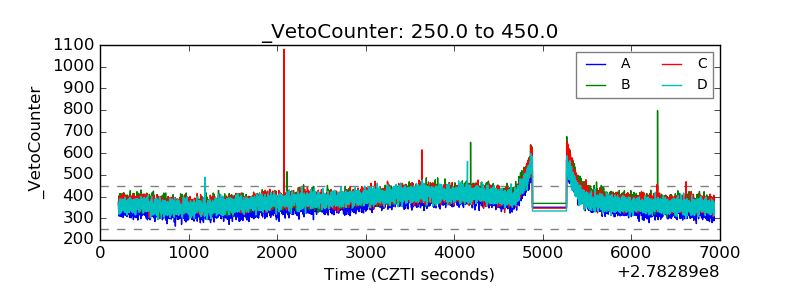 |