| Param | Original file | Final file |
|---|---|---|
| Filename | modeM0/AS1A05_002T10_9000002460_16650cztM0_level2.evt | modeM0/AS1A05_002T10_9000002460_16650cztM0_level2_quad_clean.evt |
| Size (bytes) | 585,979,200 | 126,406,080 |
| Size | 558.8 MB | 120.6 MB |
| Events in quadrant A | 4,746,750 | 816,168 |
| Events in quadrant B | 4,096,802 | 848,021 |
| Events in quadrant C | 3,941,422 | 804,790 |
| Events in quadrant D | 4,399,939 | 784,501 |
| Mode SS | |||
|---|---|---|---|
| Quadrant | BADHDUFLAG | Total packets | Discarded packets |
| A | 0 | 168 | 0 |
| B | 0 | 168 | 0 |
| C | 0 | 168 | 0 |
| D | 0 | 168 | 0 |
| Mode M0 | |||
|---|---|---|---|
| Quadrant | BADHDUFLAG | Total packets | Discarded packets |
| A | 0 | 19685 | 3 |
| B | 0 | 17748 | 2 |
| C | 0 | 17046 | 2 |
| D | 0 | 18862 | 2 |
| Mode M9 | |||
|---|---|---|---|
| Quadrant | BADHDUFLAG | Total packets | Discarded packets |
| A | 0 | 6 | 0 |
| B | 0 | 6 | 0 |
| C | 0 | 6 | 0 |
| D | 0 | 6 | 0 |
| Quadrant | Total seconds | Saturated seconds | Saturation percentage |
|---|---|---|---|
| A | 8282 | 265 | 3.199710% |
| B | 8282 | 76 | 0.917653% |
| C | 8282 | 98 | 1.183289% |
| D | 8282 | 106 | 1.279884% |
Noise dominated data is calculated using 1-second bins in cleaned event files. If a bin has >2000 counts, and if more than 50% of those come from <1% of pixels, then it is considered to be noise-dominated and hence unusable.
| Quadrant | # 1 sec bins | Bins with >0 counts | Bins with >2000 counts | High rate bins dominated by noise | Noise dominated (total time) | Noise dominated (detector-on time) | Marked lightcurve |
|---|---|---|---|---|---|---|---|
| A | 8848 | 8286 | 195 | 195 | 2.20% | 2.35% | 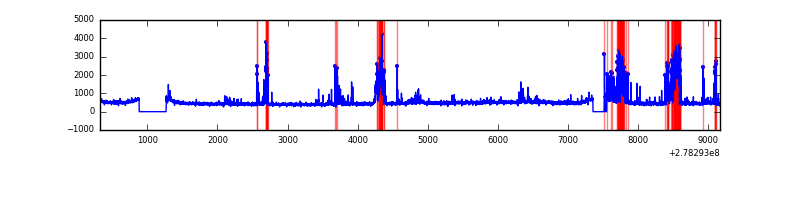 |
| B | 8848 | 8286 | 7 | 7 | 0.08% | 0.08% | 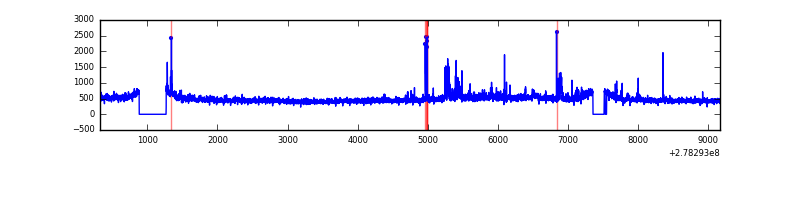 |
| C | 8848 | 8286 | 0 | 0 | 0.00% | 0.00% | 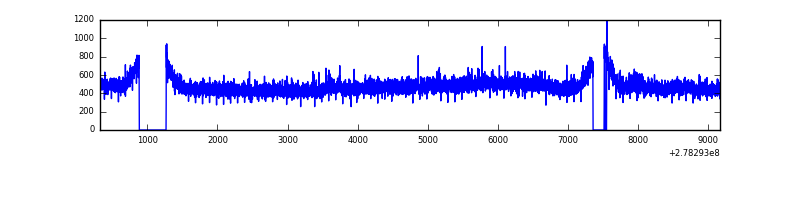 |
| D | 8848 | 8286 | 41 | 41 | 0.46% | 0.49% | 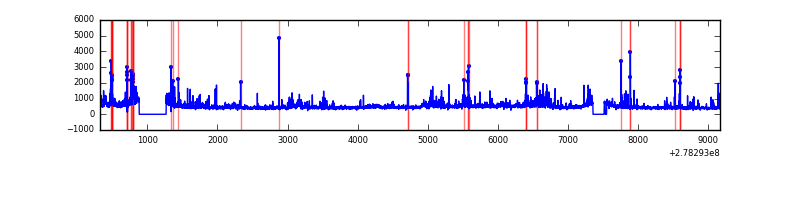 |
Top three noisy pixels from each quadrant. If the there are fewer than three noisy pixels in the level2.evt file, extra rows are filled as -1
| Pixel properties | Quadrant properties | ||||||
|---|---|---|---|---|---|---|---|
| Quadrant | DetID | PixID | Counts | Sigma | Mean | Median | Sigma |
| A | 9 | 143 | 879502 | 4577.86 | 961 | 941 | 191.9 |
| A | 12 | 96 | 161913 | 838.77 | 961 | 941 | 191.9 |
| A | 15 | 223 | 10975 | 52.28 | 961 | 941 | 191.9 |
| B | 15 | 35 | 126975 | 669.42 | 979 | 951 | 188.3 |
| B | 0 | 198 | 44063 | 229.0 | 979 | 951 | 188.3 |
| B | 12 | 111 | 21805 | 110.77 | 979 | 951 | 188.3 |
| C | 14 | 238 | 143265 | 651.43 | 937 | 943 | 218.5 |
| C | 3 | 233 | 128458 | 583.65 | 937 | 943 | 218.5 |
| C | 14 | 67 | 11329 | 47.54 | 937 | 943 | 218.5 |
| D | 1 | 52 | 627805 | 2745.96 | 941 | 911 | 228.3 |
| D | 5 | 222 | 66727 | 288.29 | 941 | 911 | 228.3 |
| D | 10 | 70 | 61914 | 267.21 | 941 | 911 | 228.3 |
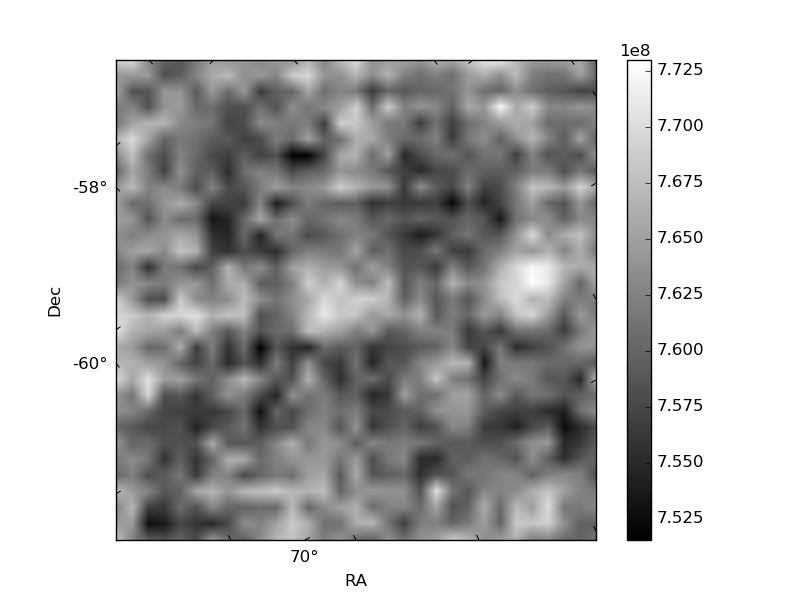
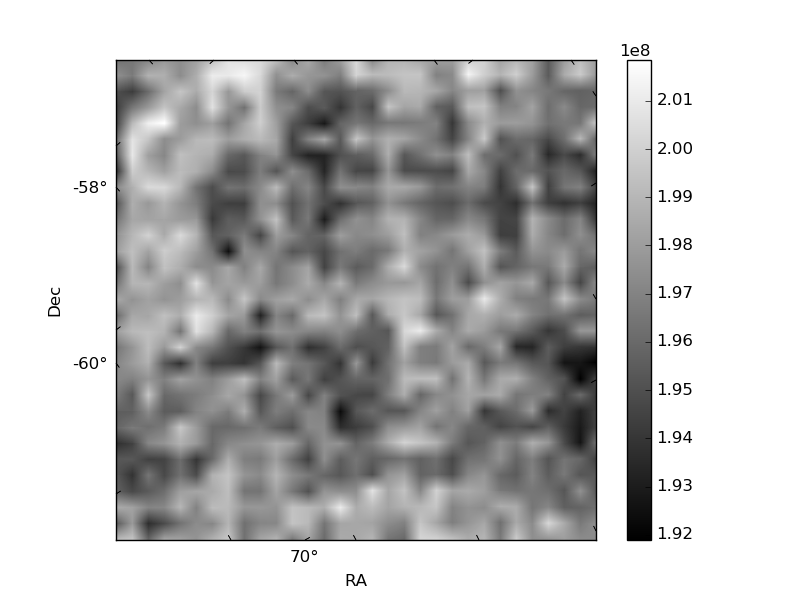
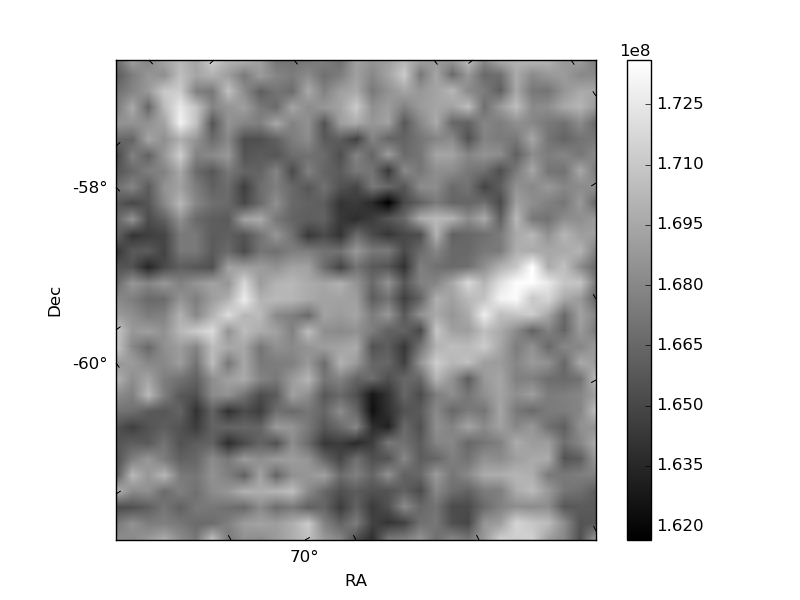
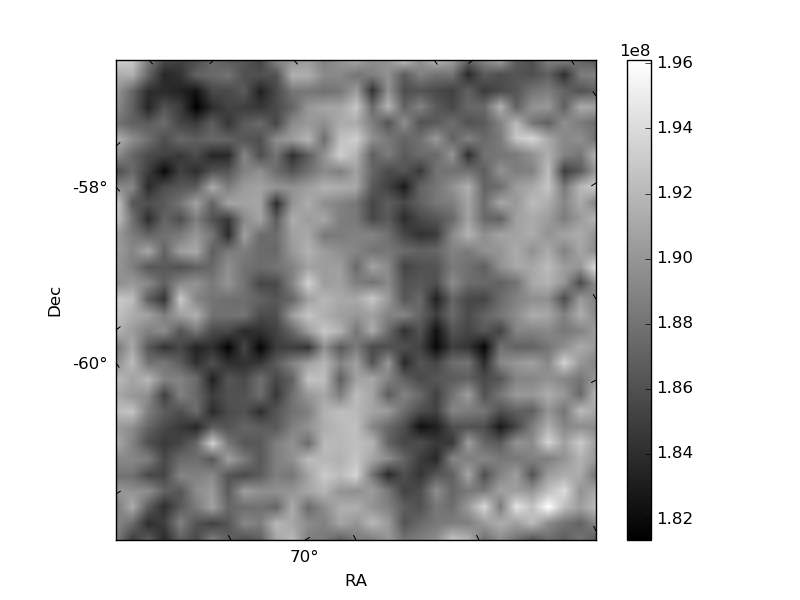
Histogram calculated using DETX and DETY for each event in the final _common_clean file
| Quadrant A | 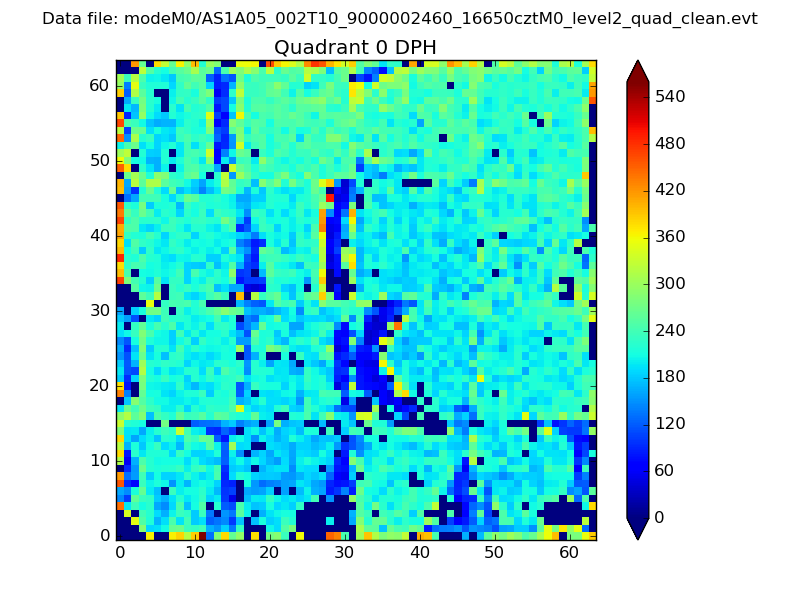 |
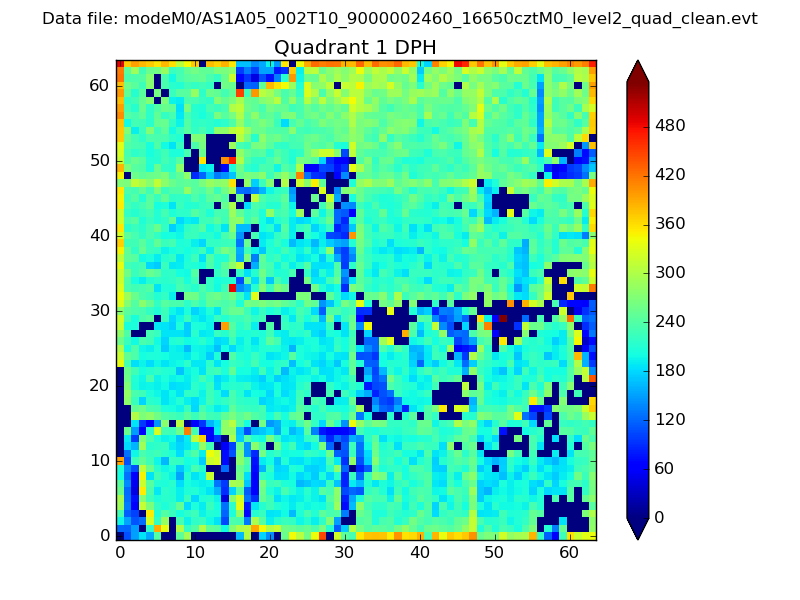 |
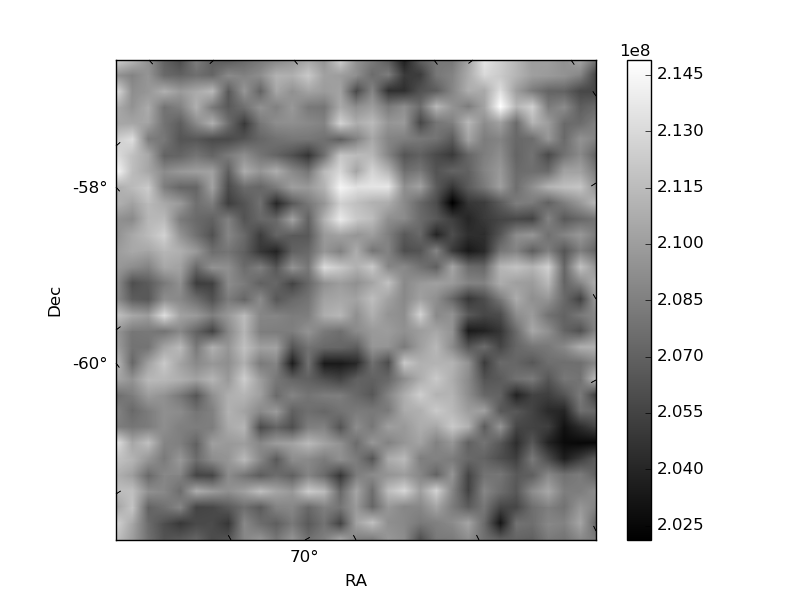
Quadrant B |
|---|---|---|---|
| Quadrant D | 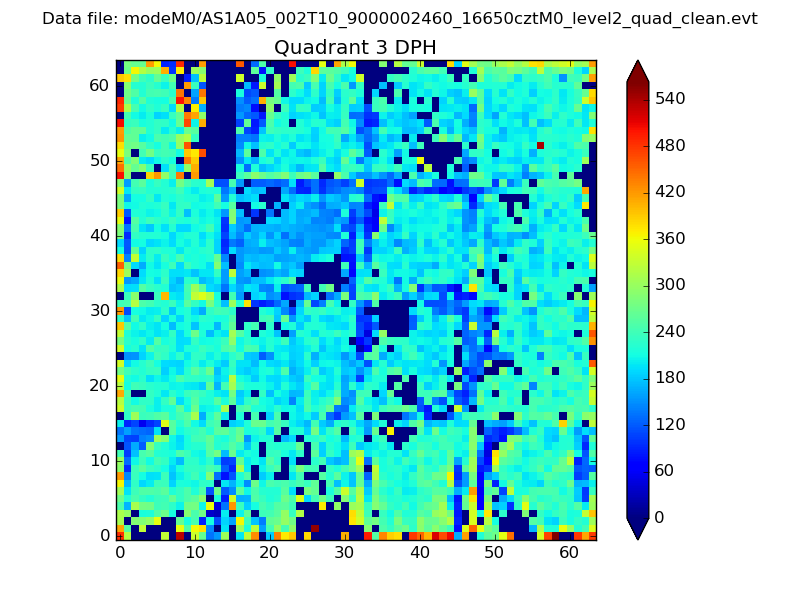 |
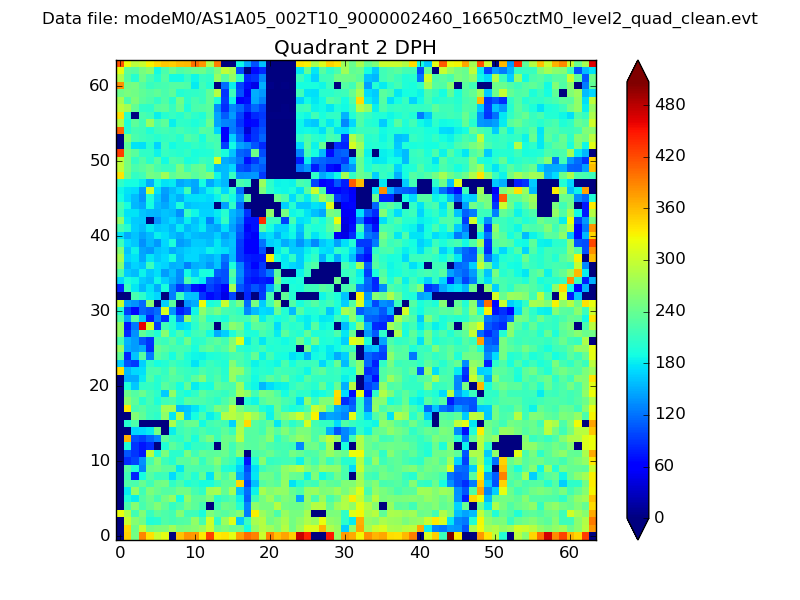 |
Quadrant C |
| Plot type | Count rate plots | Images |
|---|---|---|
| Comparison with Poisson distribution Blue bars denote a histogram of data divided into 1 sec bins. Red curve is a Poisson curve with rate = median count rate of data. |
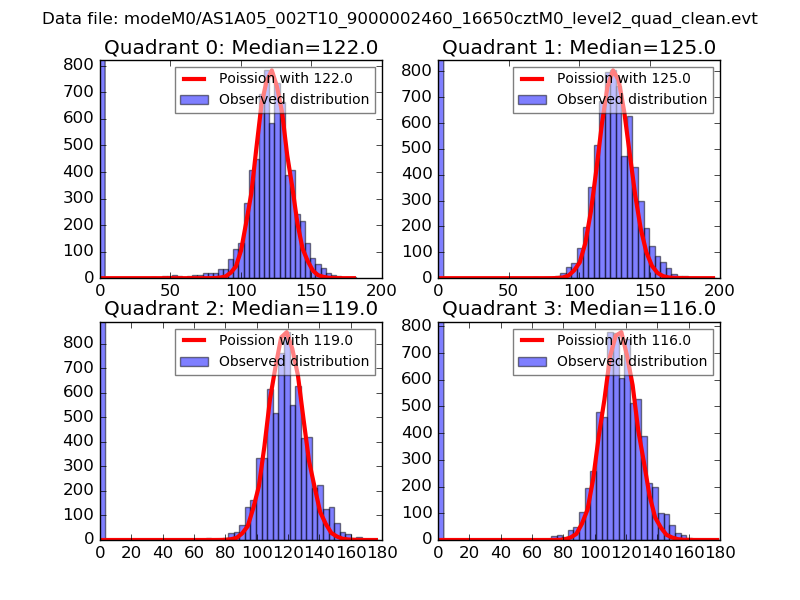 |
 |
| Quadrant-wise count rates Data is divided into 100 sec bins |
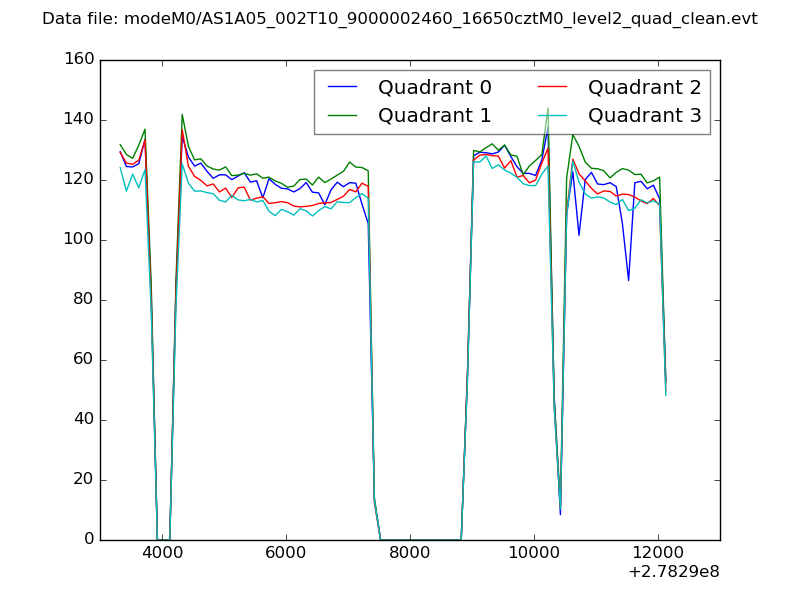 |
|
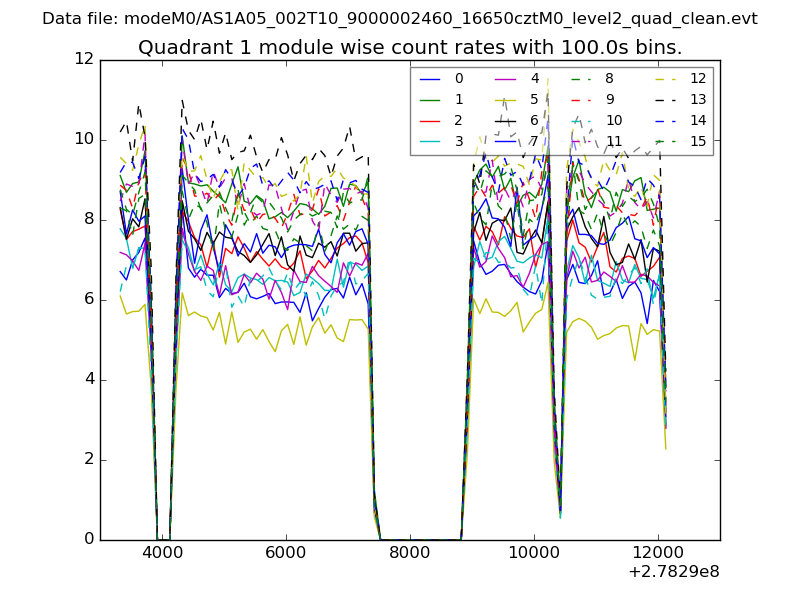
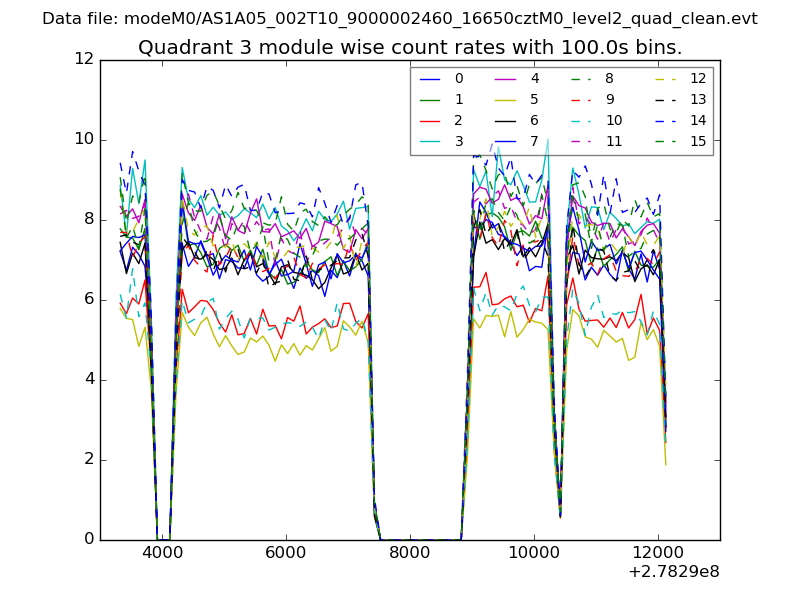
| Module-wise count rates for Quadrant A Data is divided into 100 sec bins |
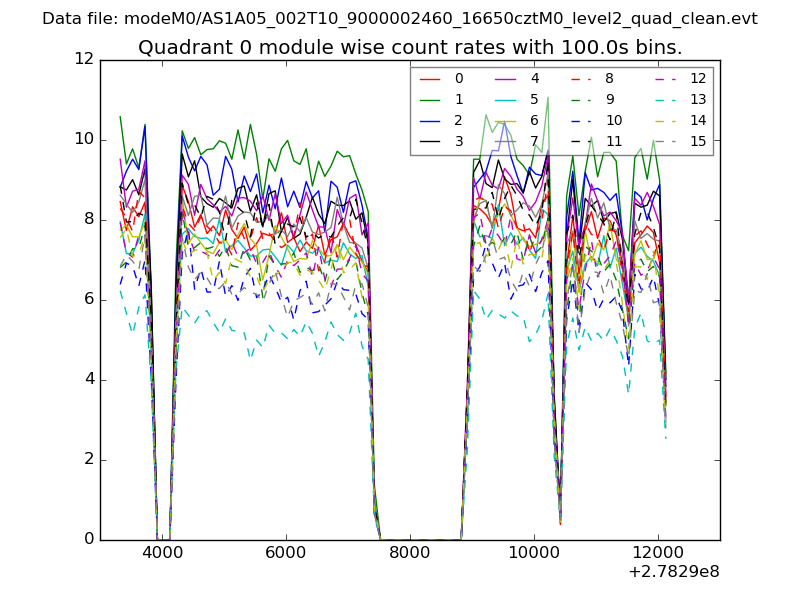 |
 |
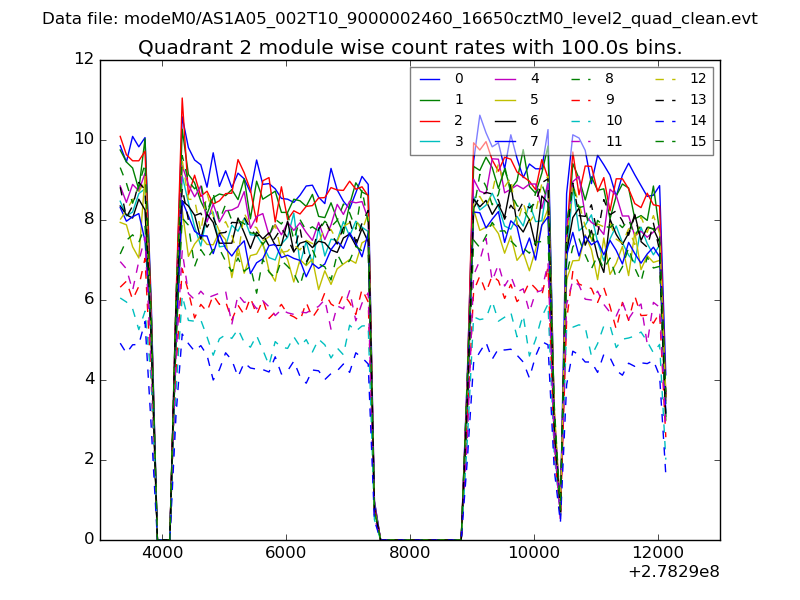
| Module-wise count rates for Quadrant B Data is divided into 100 sec bins |
 |
 |
| Module-wise count rates for Quadrant C Data is divided into 100 sec bins |
 |
 |
| Module-wise count rates for Quadrant D Data is divided into 100 sec bins |
 |
 |
| Parameter | Plot |
|---|---|
| CZT HV Monitor | 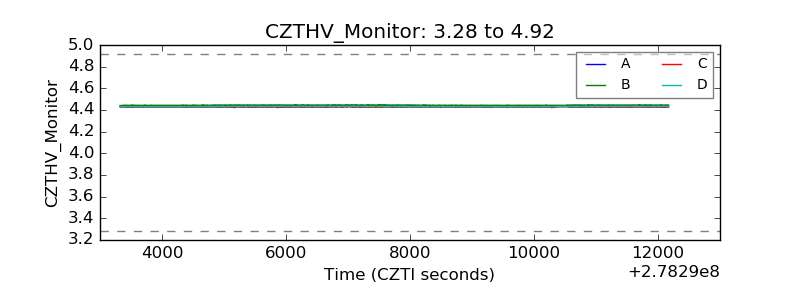 |
| D_VDD | 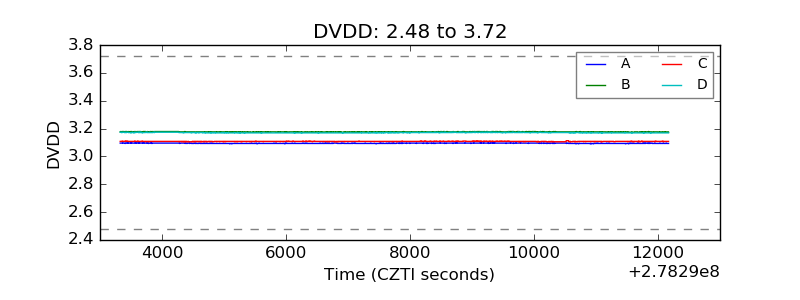 |
| Temperature 1 | 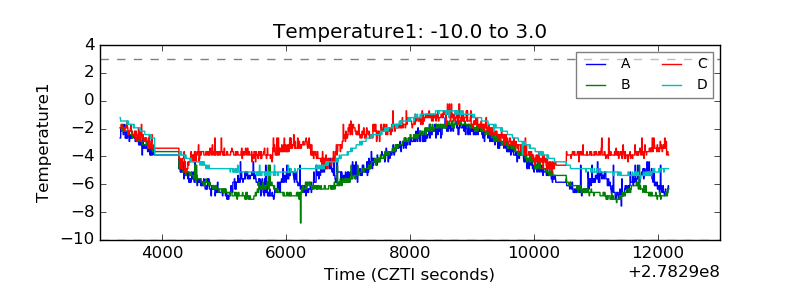 |
| Veto HV Monitor | 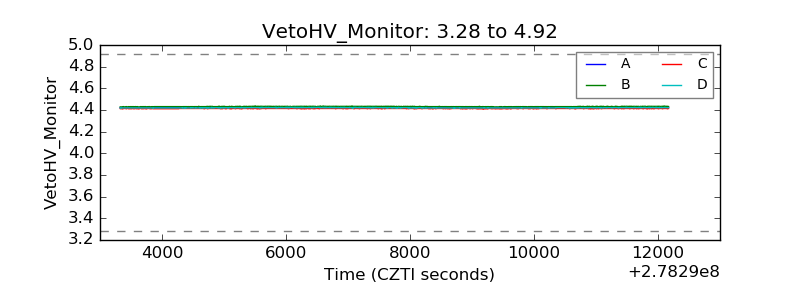 |
| Veto LLD | 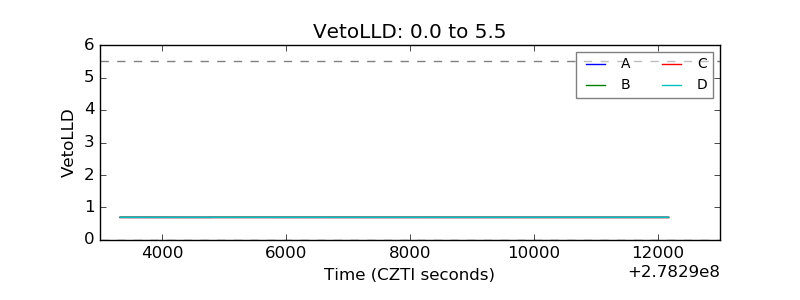 |
| Alpha Counter | 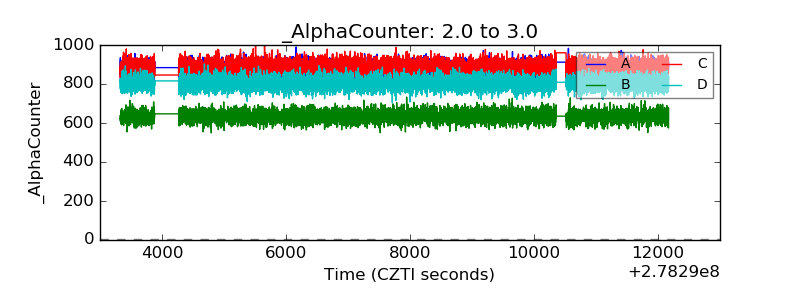 |
| _CPM_Rate | 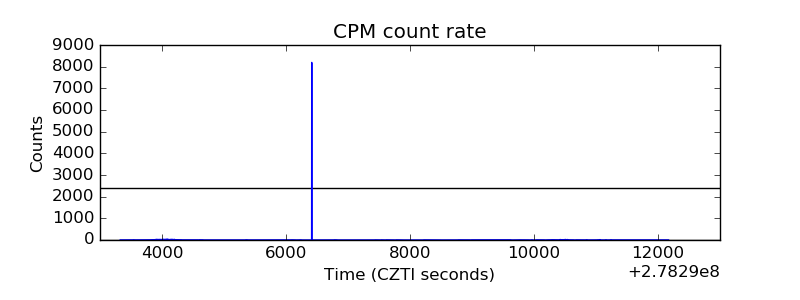 |
| CZT Counter | 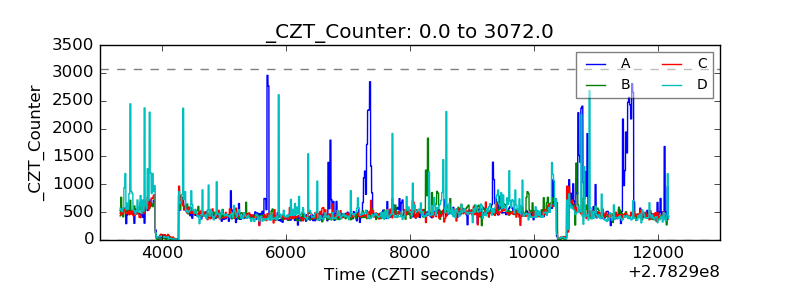 |
| +2.5 Volts monitor |  |
| +5 Volts monitor |  |
| _ROLL_ROT | 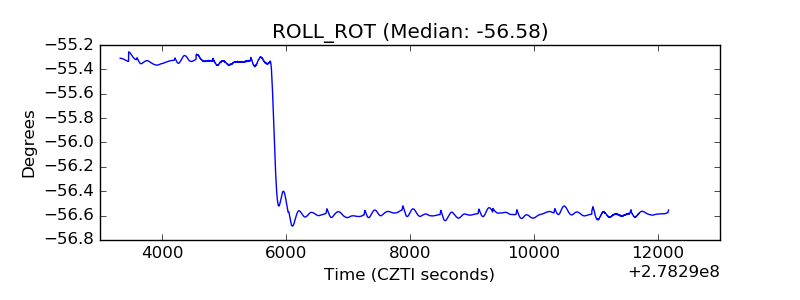 |
| _Roll_DEC | 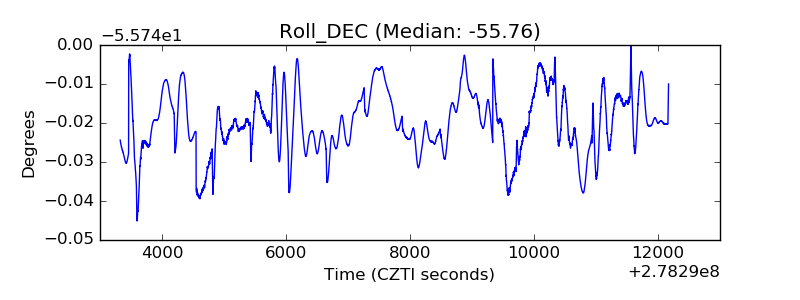 |
| _Roll_RA | 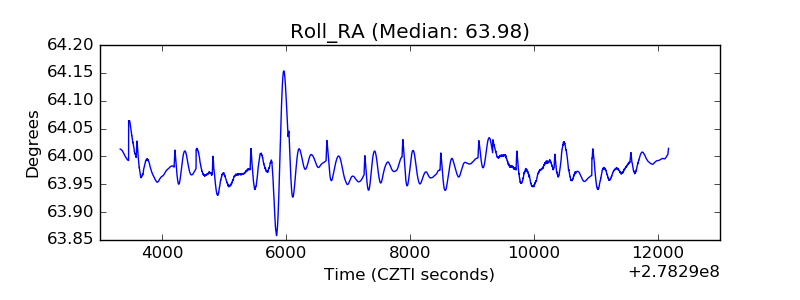 |
| Veto Counter | 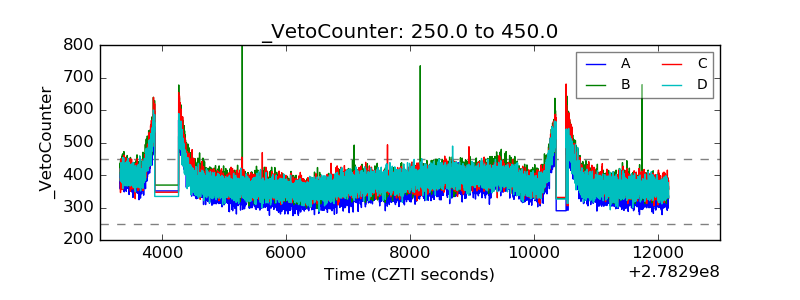 |