| Param | Original file | Final file |
|---|---|---|
| Filename | modeM0/AS1A05_002T10_9000002460_16651cztM0_level2.evt | modeM0/AS1A05_002T10_9000002460_16651cztM0_level2_quad_clean.evt |
| Size (bytes) | 649,316,160 | 131,083,200 |
| Size | 619.2 MB | 125.0 MB |
| Events in quadrant A | 4,521,117 | 853,679 |
| Events in quadrant B | 4,294,918 | 882,730 |
| Events in quadrant C | 4,022,338 | 837,245 |
| Events in quadrant D | 6,243,815 | 799,592 |
| Mode SS | |||
|---|---|---|---|
| Quadrant | BADHDUFLAG | Total packets | Discarded packets |
| A | 0 | 176 | 0 |
| B | 0 | 176 | 0 |
| C | 0 | 176 | 0 |
| D | 0 | 176 | 0 |
| Mode M0 | |||
|---|---|---|---|
| Quadrant | BADHDUFLAG | Total packets | Discarded packets |
| A | 0 | 19300 | 3 |
| B | 0 | 18499 | 2 |
| C | 0 | 17590 | 2 |
| D | 0 | 24550 | 2 |
| Mode M9 | |||
|---|---|---|---|
| Quadrant | BADHDUFLAG | Total packets | Discarded packets |
| A | 0 | 4 | 0 |
| B | 0 | 4 | 0 |
| C | 0 | 4 | 0 |
| D | 0 | 4 | 0 |
| Quadrant | Total seconds | Saturated seconds | Saturation percentage |
|---|---|---|---|
| A | 8591 | 255 | 2.968223% |
| B | 8591 | 135 | 1.571412% |
| C | 8591 | 150 | 1.746013% |
| D | 8591 | 603 | 7.018973% |
Noise dominated data is calculated using 1-second bins in cleaned event files. If a bin has >2000 counts, and if more than 50% of those come from <1% of pixels, then it is considered to be noise-dominated and hence unusable.
| Quadrant | # 1 sec bins | Bins with >0 counts | Bins with >2000 counts | High rate bins dominated by noise | Noise dominated (total time) | Noise dominated (detector-on time) | Marked lightcurve |
|---|---|---|---|---|---|---|---|
| A | 9062 | 8594 | 148 | 148 | 1.63% | 1.72% | 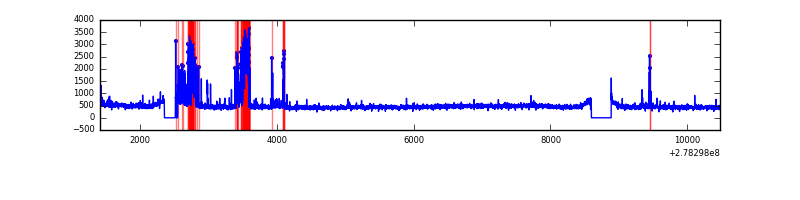 |
| B | 9062 | 8594 | 6 | 6 | 0.07% | 0.07% | 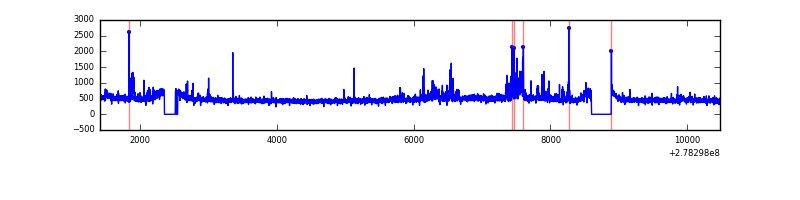 |
| C | 9062 | 8594 | 0 | 0 | 0.00% | 0.00% | 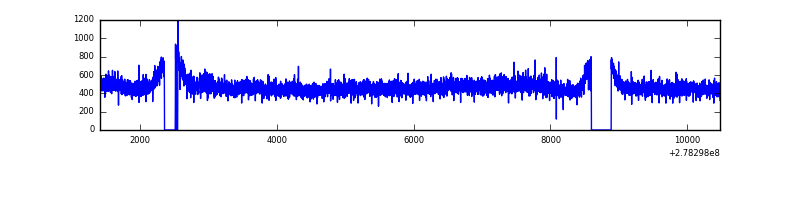 |
| D | 9062 | 8594 | 526 | 526 | 5.80% | 6.12% | 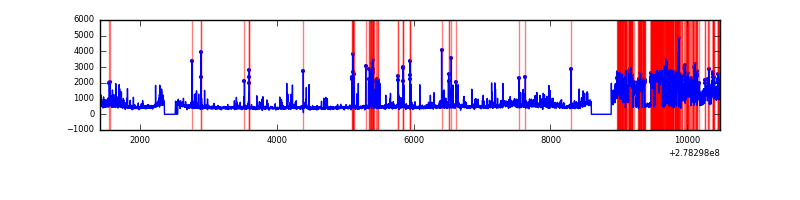 |
Top three noisy pixels from each quadrant. If the there are fewer than three noisy pixels in the level2.evt file, extra rows are filled as -1
| Pixel properties | Quadrant properties | ||||||
|---|---|---|---|---|---|---|---|
| Quadrant | DetID | PixID | Counts | Sigma | Mean | Median | Sigma |
| A | 9 | 143 | 586800 | 2920.88 | 996 | 973 | 200.6 |
| A | 12 | 96 | 96656 | 477.07 | 996 | 973 | 200.6 |
| A | 0 | 226 | 8491 | 37.48 | 996 | 973 | 200.6 |
| B | 15 | 35 | 109692 | 557.33 | 1012 | 982 | 195.1 |
| B | 0 | 189 | 86123 | 436.5 | 1012 | 982 | 195.1 |
| B | 0 | 198 | 47999 | 241.05 | 1012 | 982 | 195.1 |
| C | 14 | 238 | 148457 | 651.23 | 967 | 970 | 226.5 |
| C | 3 | 233 | 79619 | 347.28 | 967 | 970 | 226.5 |
| C | 7 | 247 | 15459 | 63.97 | 967 | 970 | 226.5 |
| D | 2 | 16 | 1660543 | 7121.32 | 961 | 932 | 233.0 |
| D | 1 | 52 | 714140 | 3060.34 | 961 | 932 | 233.0 |
| D | 5 | 222 | 76523 | 324.36 | 961 | 932 | 233.0 |
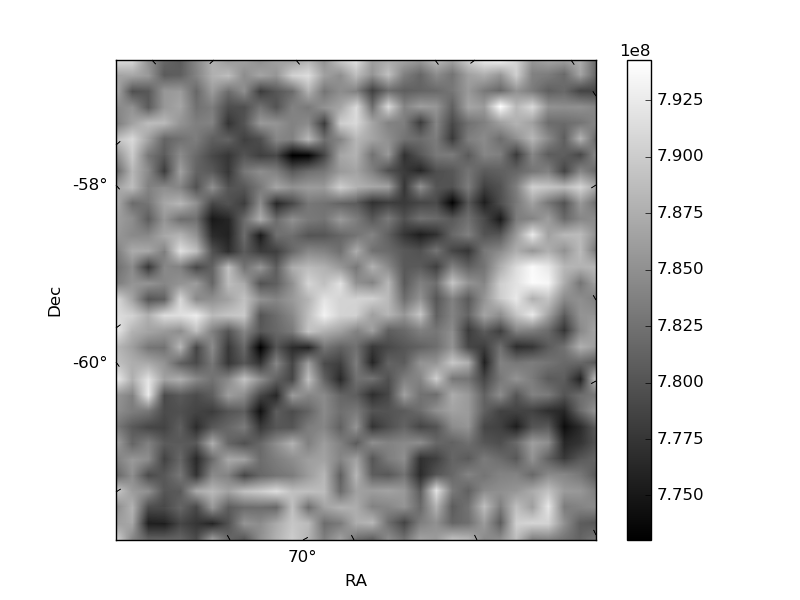
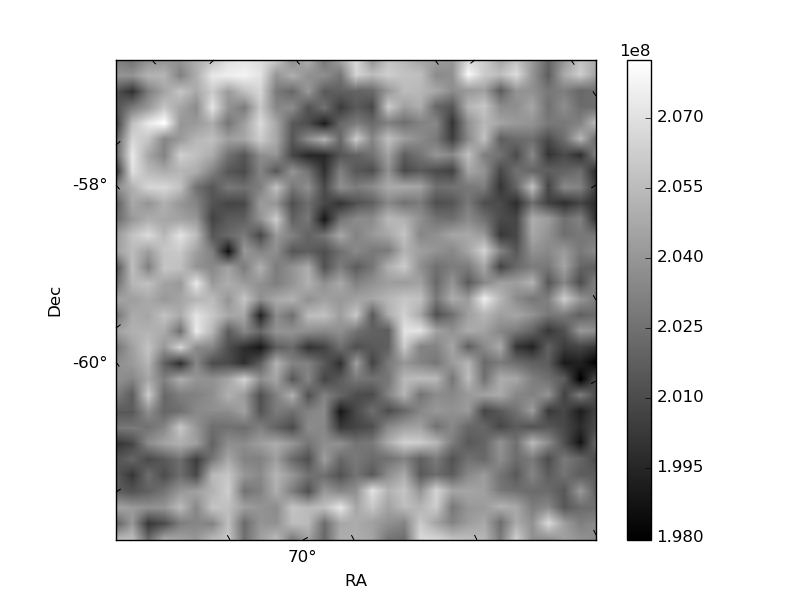
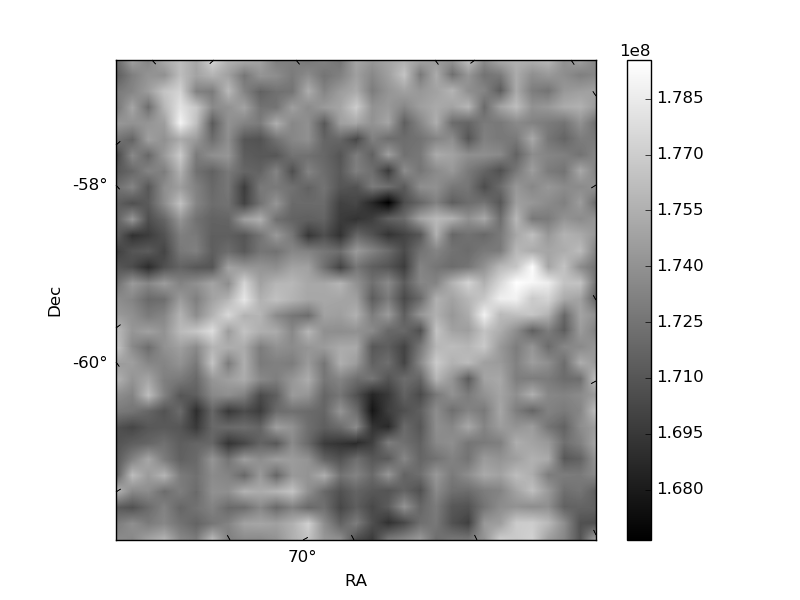
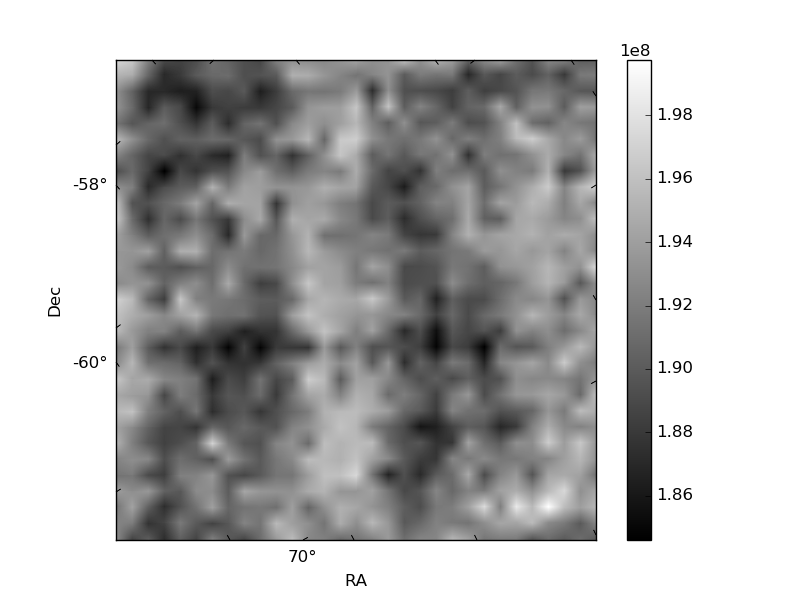
Histogram calculated using DETX and DETY for each event in the final _common_clean file
| Quadrant A | 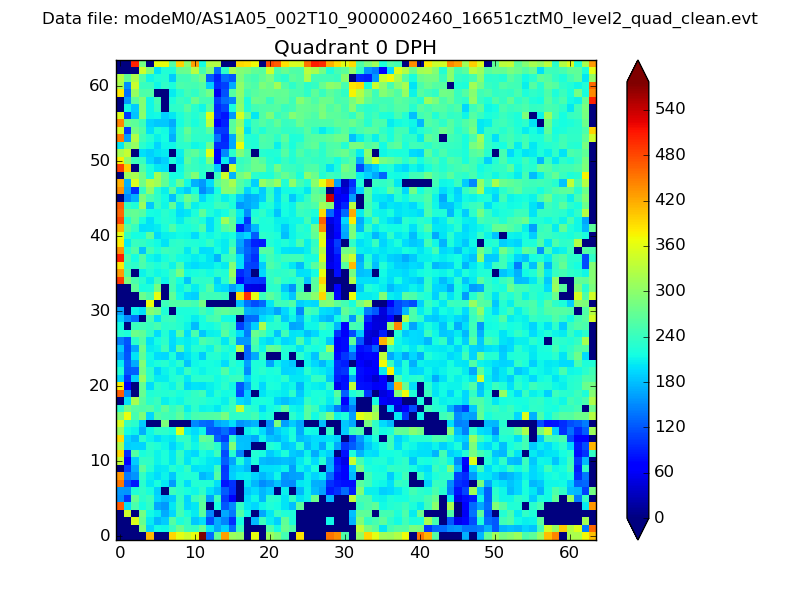 |
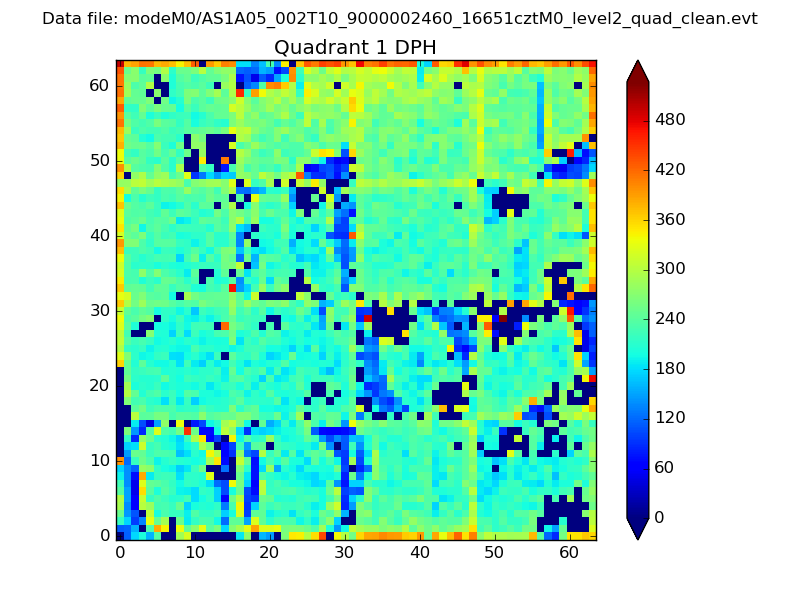 |
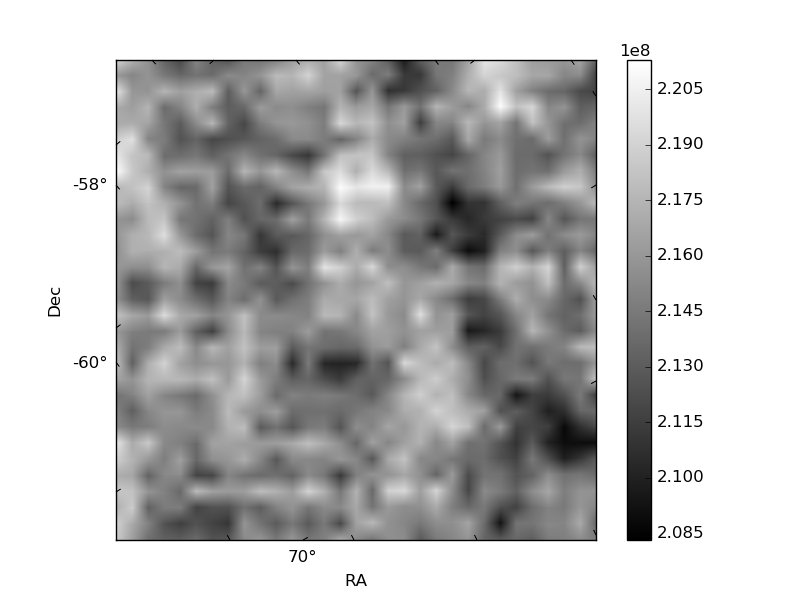
Quadrant B |
|---|---|---|---|
| Quadrant D | 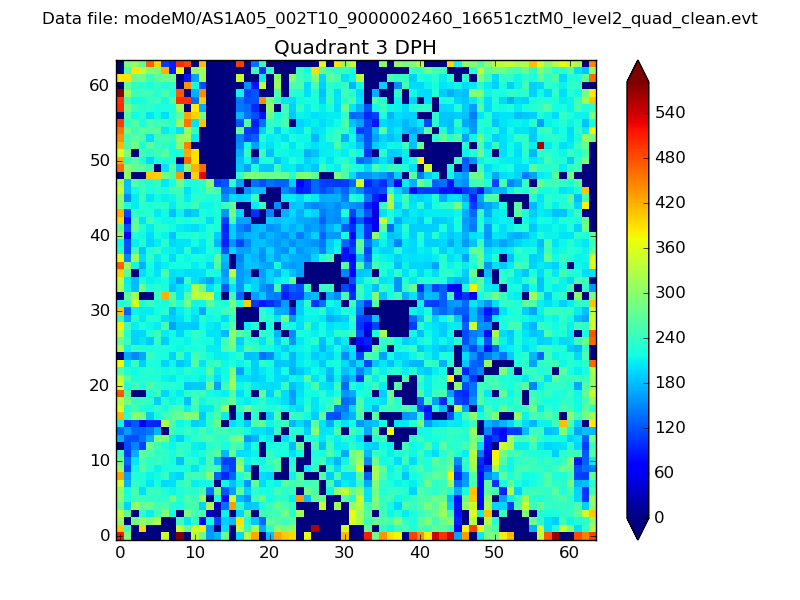 |
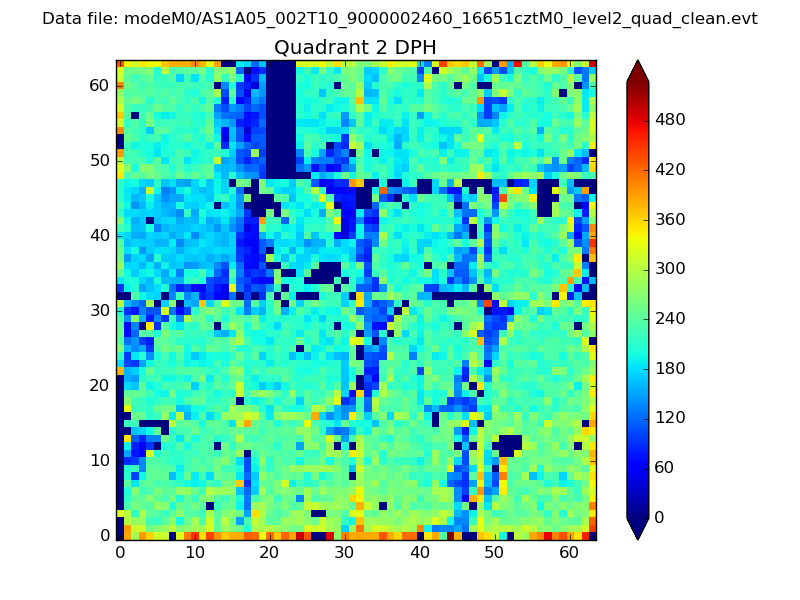 |
Quadrant C |
| Plot type | Count rate plots | Images |
|---|---|---|
| Comparison with Poisson distribution Blue bars denote a histogram of data divided into 1 sec bins. Red curve is a Poisson curve with rate = median count rate of data. |
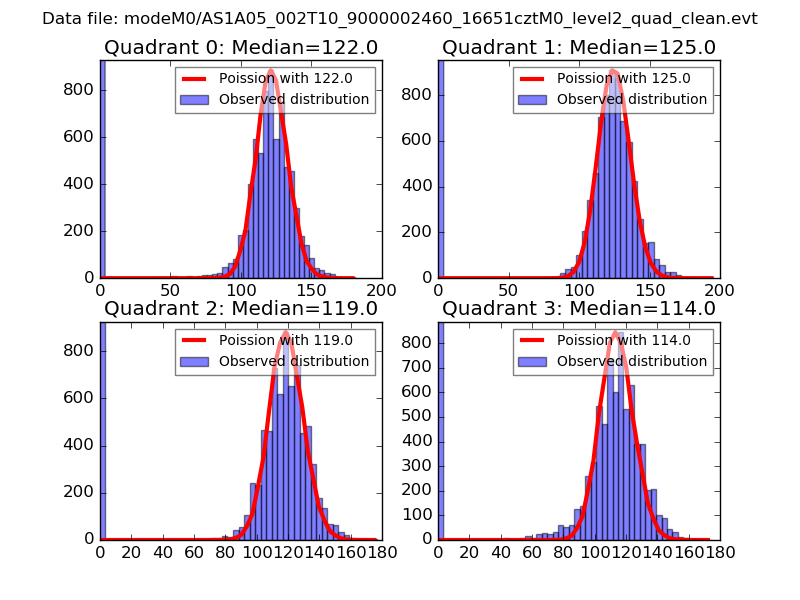 |
 |
| Quadrant-wise count rates Data is divided into 100 sec bins |
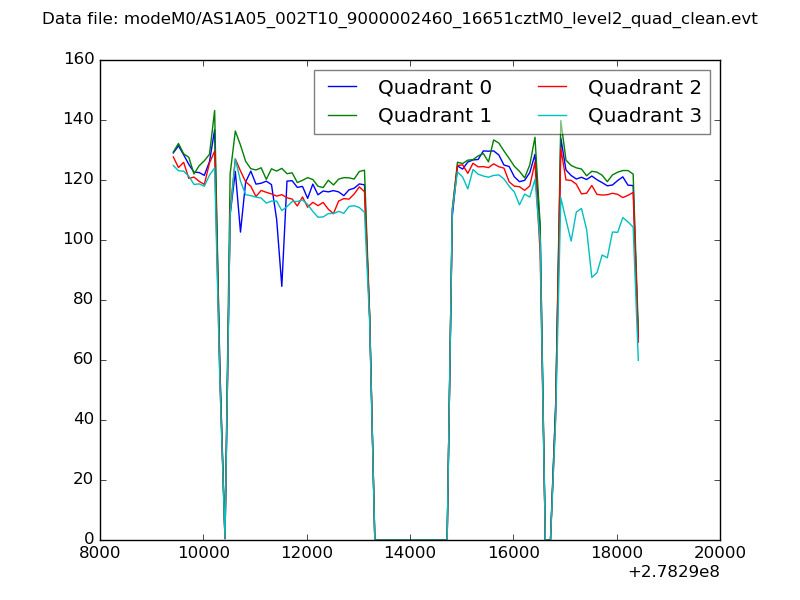 |
|
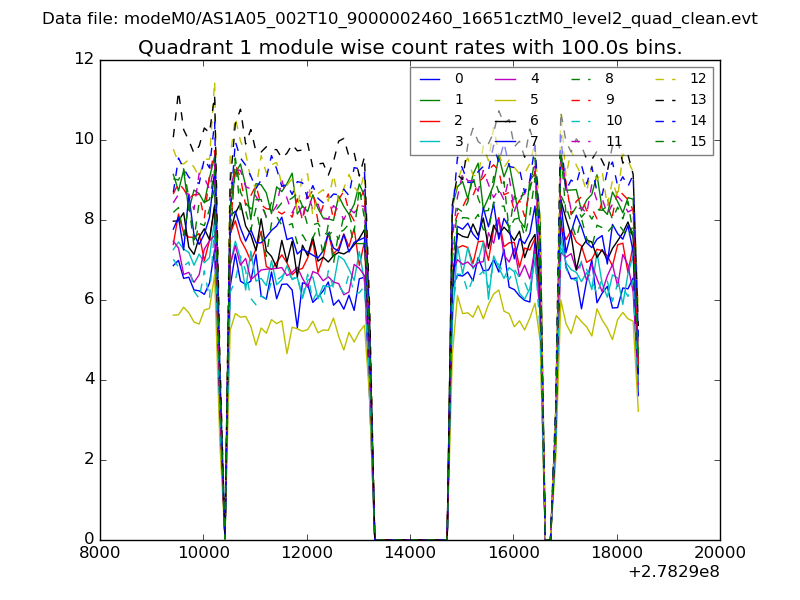
| Module-wise count rates for Quadrant A Data is divided into 100 sec bins |
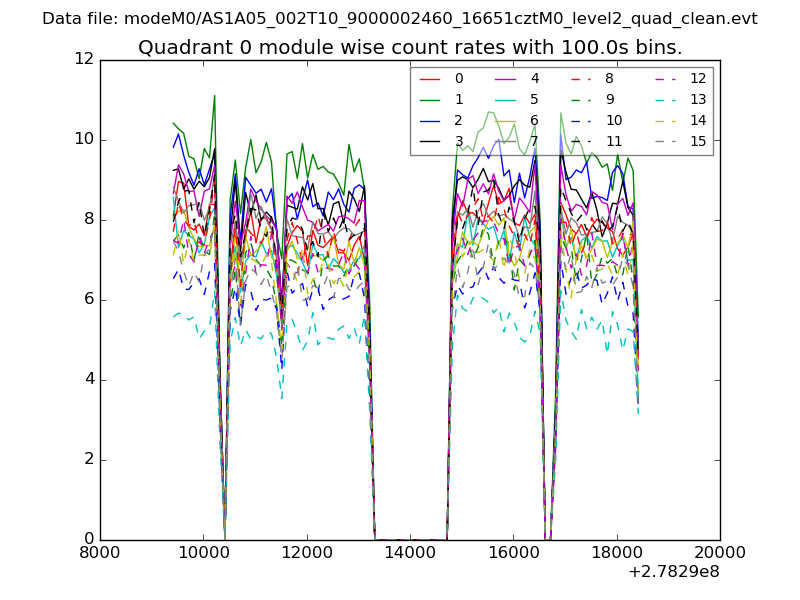 |
 |
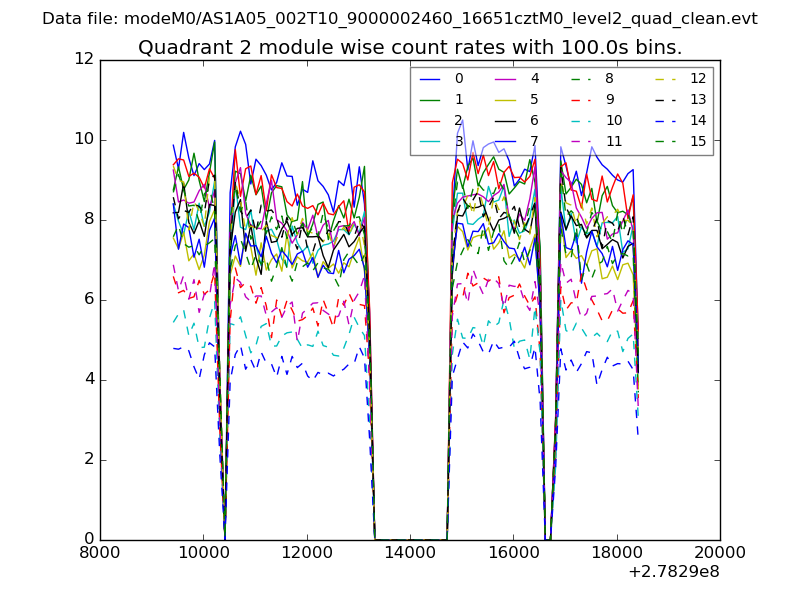
| Module-wise count rates for Quadrant B Data is divided into 100 sec bins |
 |
 |
| Module-wise count rates for Quadrant C Data is divided into 100 sec bins |
 |
 |
| Module-wise count rates for Quadrant D Data is divided into 100 sec bins |
 |
 |
| Parameter | Plot |
|---|---|
| CZT HV Monitor | 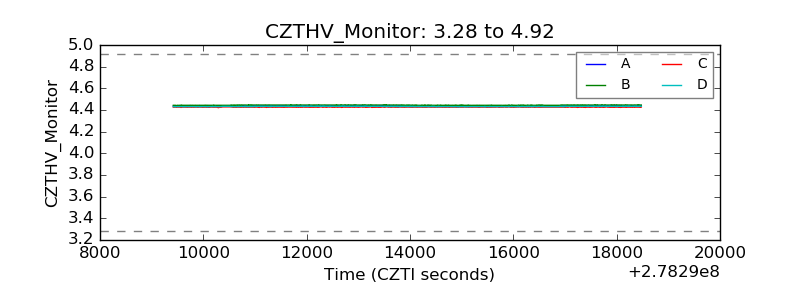 |
| D_VDD | 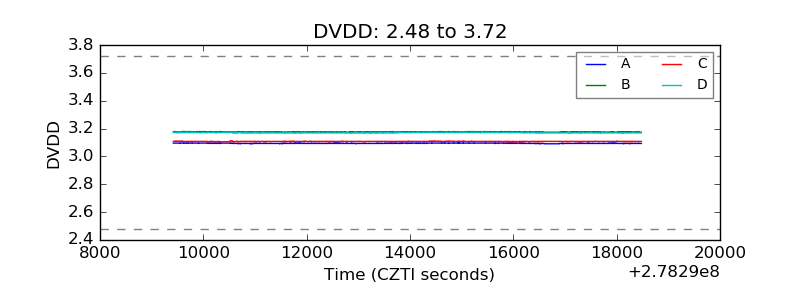 |
| Temperature 1 | 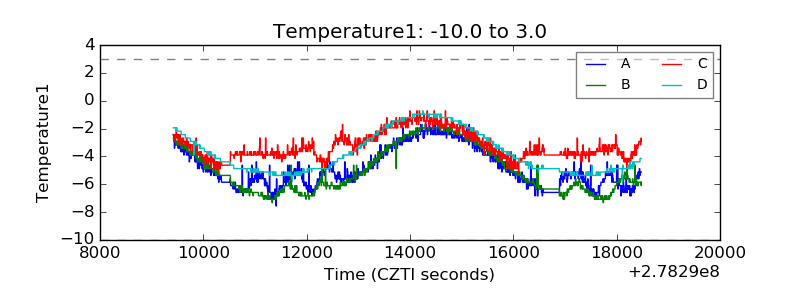 |
| Veto HV Monitor | 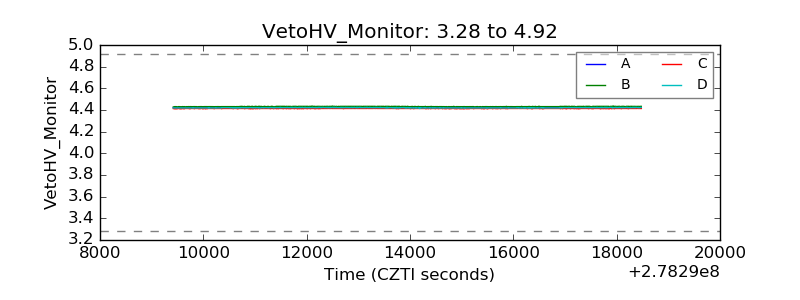 |
| Veto LLD | 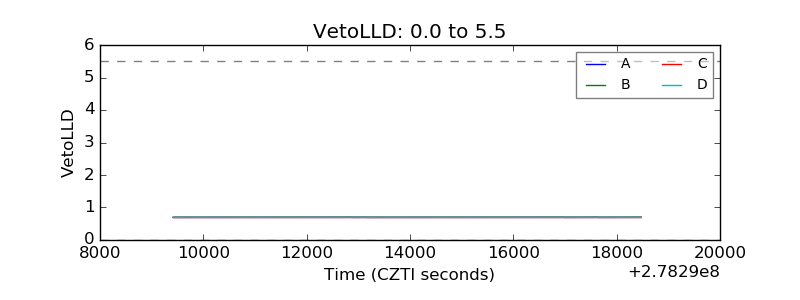 |
| Alpha Counter | 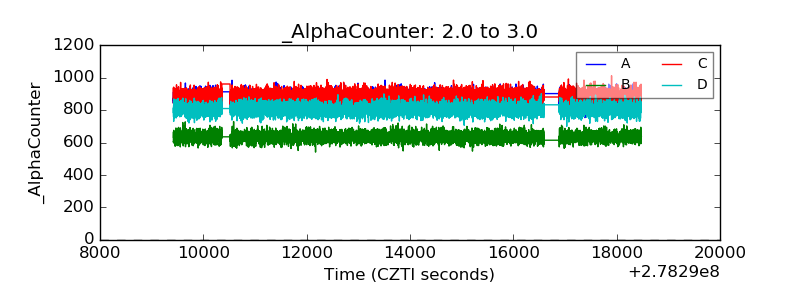 |
| _CPM_Rate | 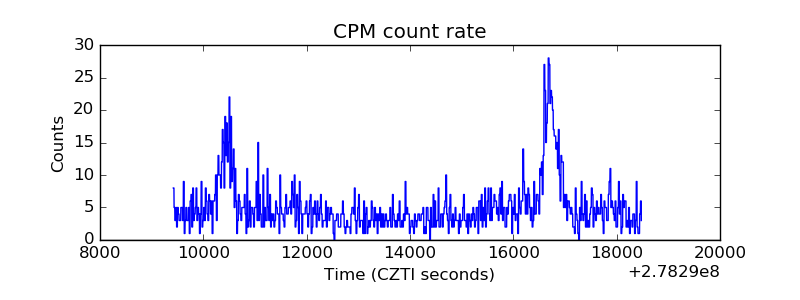 |
| CZT Counter | 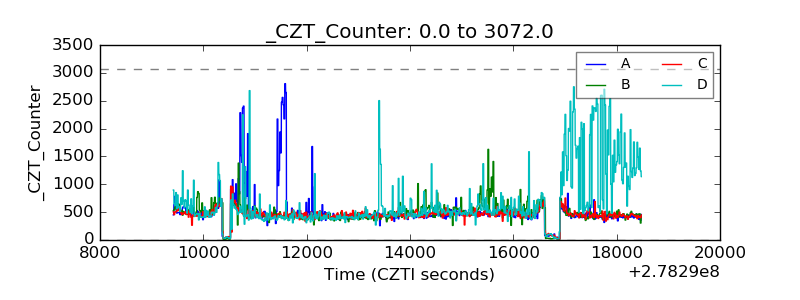 |
| +2.5 Volts monitor | 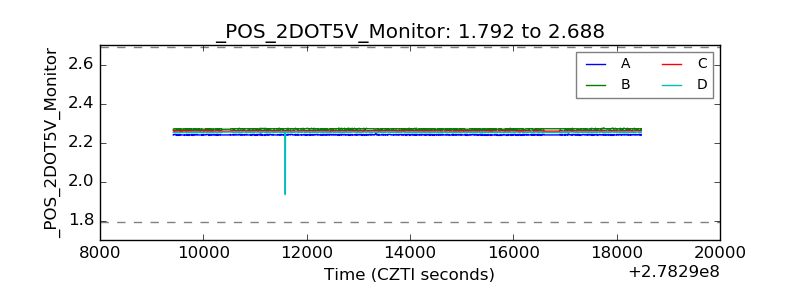 |
| +5 Volts monitor | 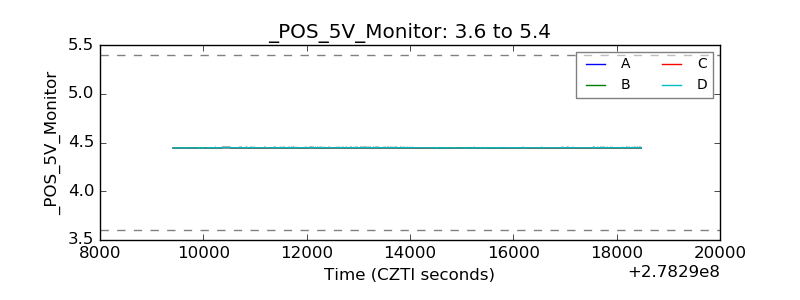 |
| _ROLL_ROT | 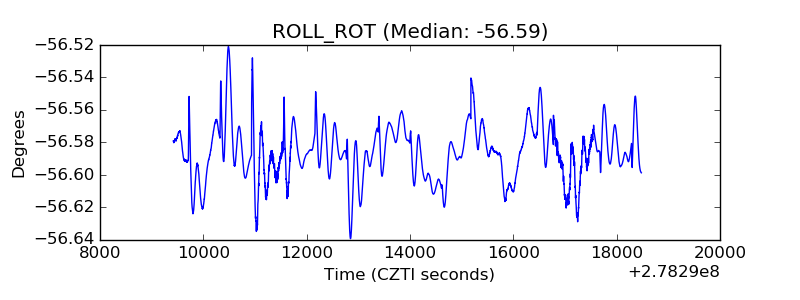 |
| _Roll_DEC | 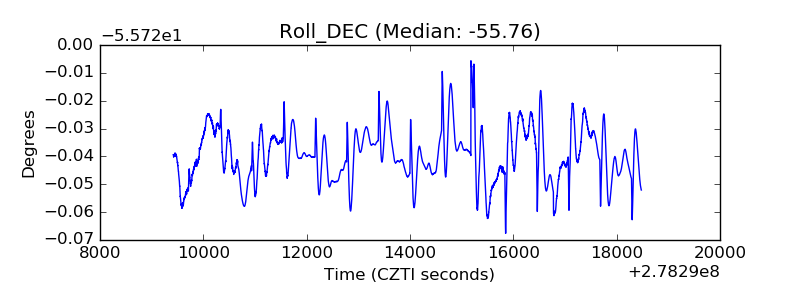 |
| _Roll_RA | 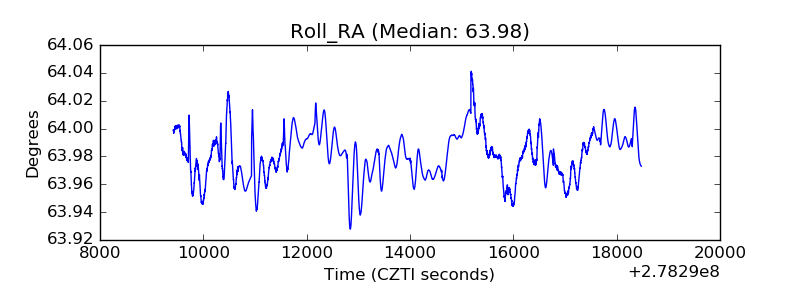 |
| Veto Counter | 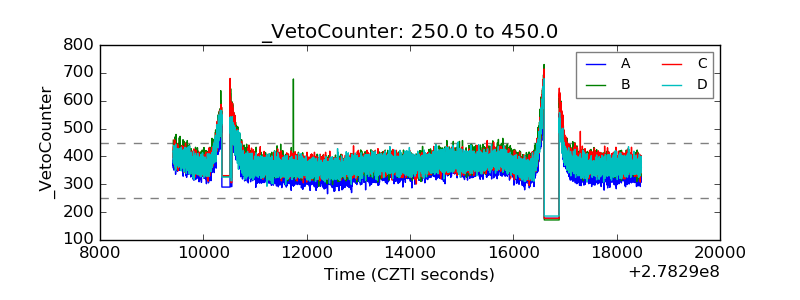 |