| Param | Original file | Final file |
|---|---|---|
| Filename | modeM0/AS1A05_002T10_9000002460_16654cztM0_level2.evt | modeM0/AS1A05_002T10_9000002460_16654cztM0_level2_quad_clean.evt |
| Size (bytes) | 173,278,080 | 32,212,800 |
| Size | 165.3 MB | 30.7 MB |
| Events in quadrant A | 858,601 | 214,933 |
| Events in quadrant B | 889,815 | 220,947 |
| Events in quadrant C | 865,625 | 209,581 |
| Events in quadrant D | 2,498,596 | 187,220 |
| Mode SS | |||
|---|---|---|---|
| Quadrant | BADHDUFLAG | Total packets | Discarded packets |
| A | 0 | 38 | 0 |
| B | 0 | 38 | 0 |
| C | 0 | 38 | 0 |
| D | 0 | 38 | 0 |
| Mode M0 | |||
|---|---|---|---|
| Quadrant | BADHDUFLAG | Total packets | Discarded packets |
| A | 0 | 3994 | 1 |
| B | 0 | 4017 | 0 |
| C | 0 | 3918 | 0 |
| D | 0 | 8768 | 0 |
| Quadrant | Total seconds | Saturated seconds | Saturation percentage |
|---|---|---|---|
| A | 1957 | 3 | 0.153296% |
| B | 1957 | 4 | 0.204394% |
| C | 1957 | 5 | 0.255493% |
| D | 1957 | 390 | 19.928462% |
Noise dominated data is calculated using 1-second bins in cleaned event files. If a bin has >2000 counts, and if more than 50% of those come from <1% of pixels, then it is considered to be noise-dominated and hence unusable.
| Quadrant | # 1 sec bins | Bins with >0 counts | Bins with >2000 counts | High rate bins dominated by noise | Noise dominated (total time) | Noise dominated (detector-on time) | Marked lightcurve |
|---|---|---|---|---|---|---|---|
| A | 1958 | 1958 | 2 | 2 | 0.10% | 0.10% | 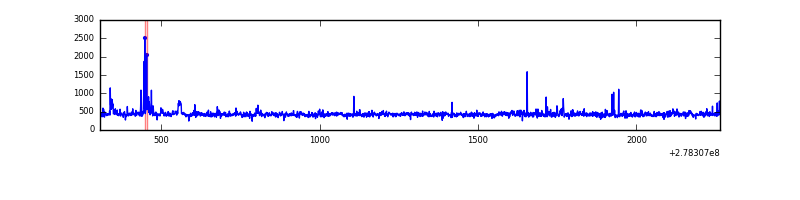 |
| B | 1958 | 1958 | 0 | 0 | 0.00% | 0.00% | 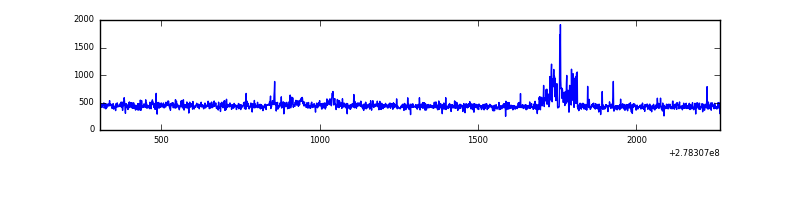 |
| C | 1958 | 1958 | 0 | 0 | 0.00% | 0.00% | 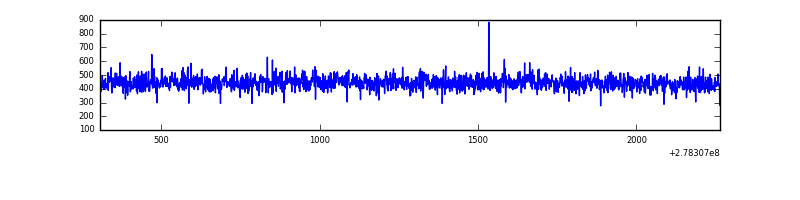 |
| D | 1958 | 1958 | 411 | 411 | 20.99% | 20.99% | 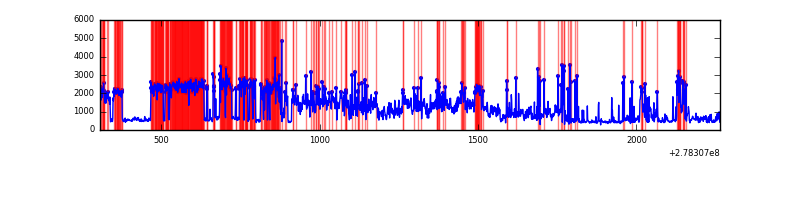 |
Top three noisy pixels from each quadrant. If the there are fewer than three noisy pixels in the level2.evt file, extra rows are filled as -1
| Pixel properties | Quadrant properties | ||||||
|---|---|---|---|---|---|---|---|
| Quadrant | DetID | PixID | Counts | Sigma | Mean | Median | Sigma |
| A | 12 | 96 | 23450 | 526.63 | 213 | 208 | 44.1 |
| A | 3 | 1 | 12982 | 289.44 | 213 | 208 | 44.1 |
| A | 9 | 143 | 4172 | 89.82 | 213 | 208 | 44.1 |
| B | 15 | 35 | 36358 | 826.13 | 215 | 209 | 43.8 |
| B | 0 | 214 | 11326 | 254.06 | 215 | 209 | 43.8 |
| B | 12 | 111 | 4851 | 106.09 | 215 | 209 | 43.8 |
| C | 14 | 238 | 32242 | 625.91 | 211 | 212 | 51.2 |
| C | 7 | 247 | 4439 | 82.6 | 211 | 212 | 51.2 |
| C | 3 | 233 | 3066 | 55.77 | 211 | 212 | 51.2 |
| D | 2 | 16 | 1381416 | 27383.73 | 201 | 195 | 50.4 |
| D | 1 | 52 | 212983 | 4218.68 | 201 | 195 | 50.4 |
| D | 10 | 70 | 68138 | 1347.02 | 201 | 195 | 50.4 |
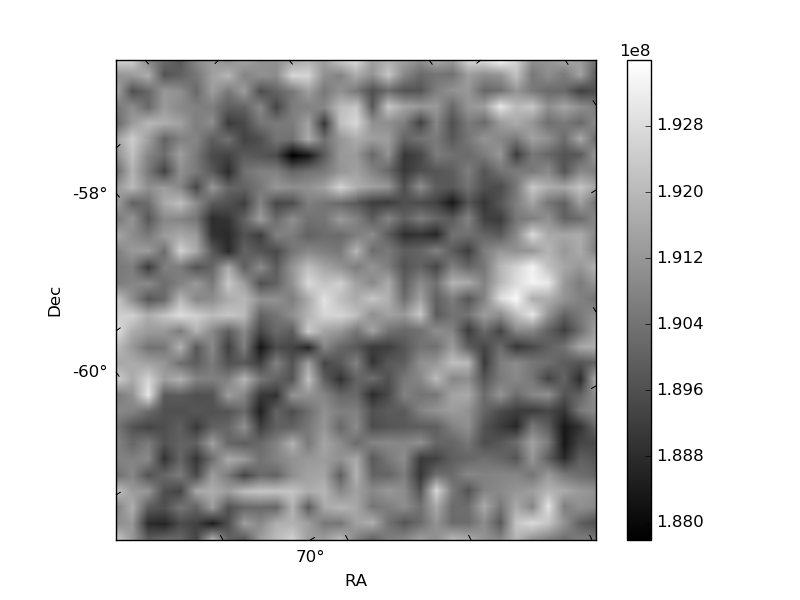
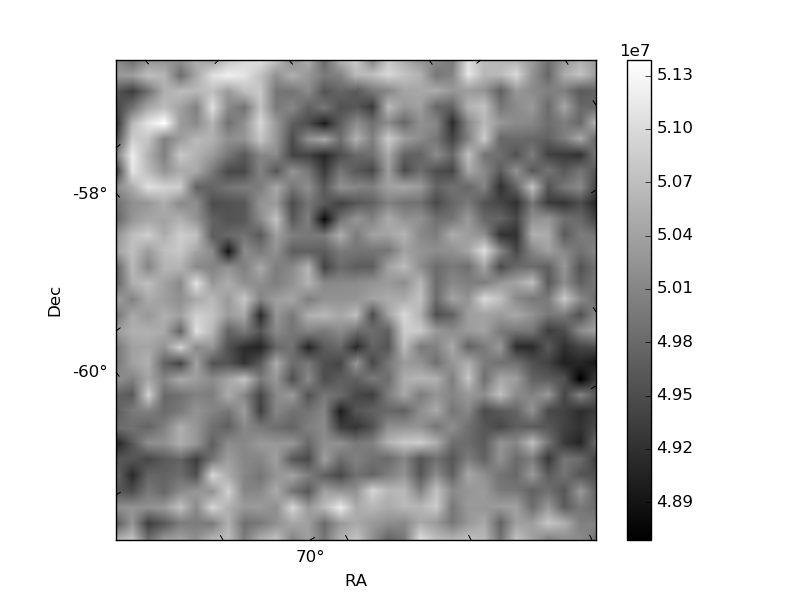
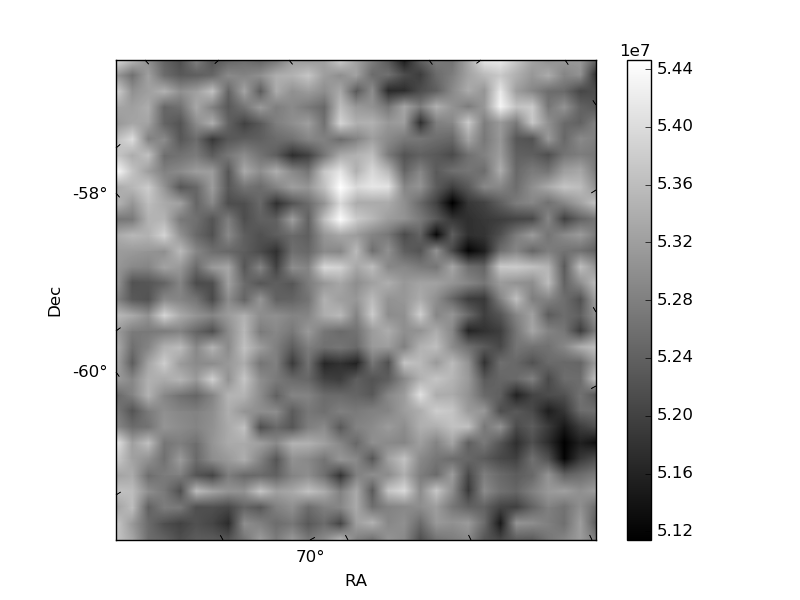
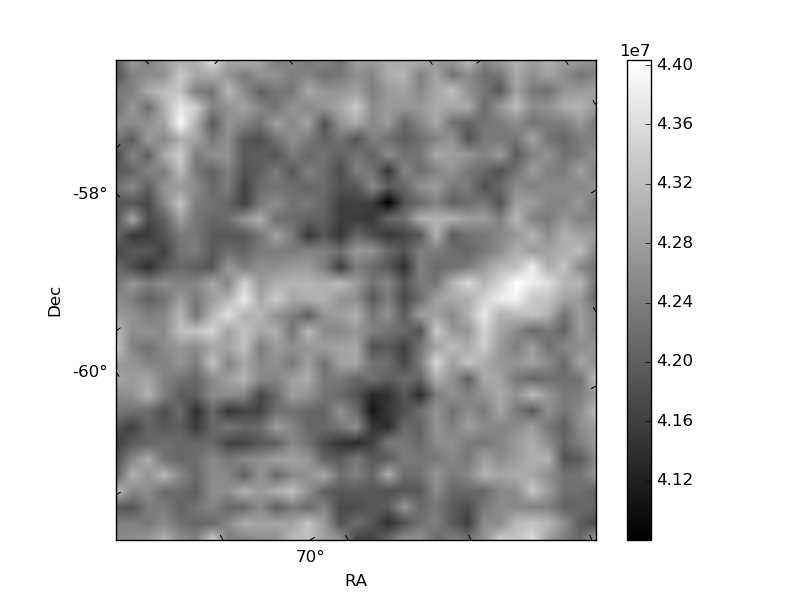
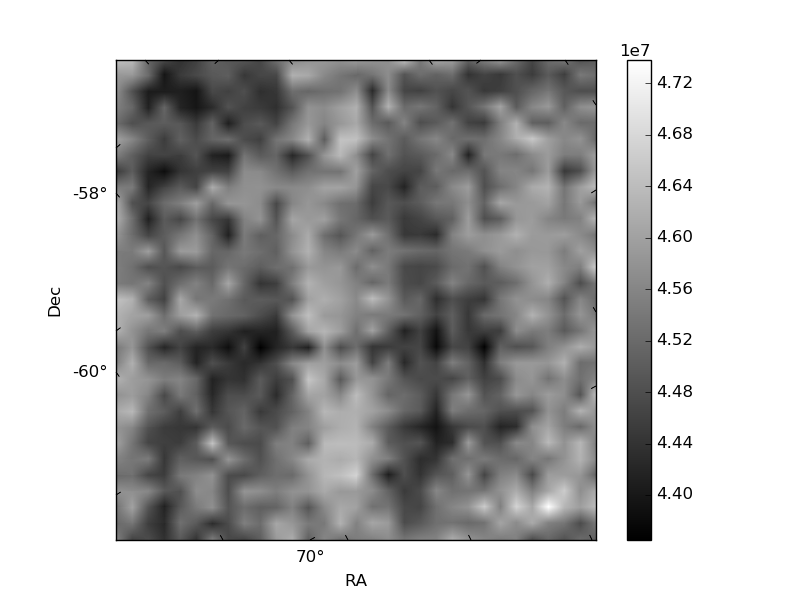
Histogram calculated using DETX and DETY for each event in the final _common_clean file
| Quadrant A | 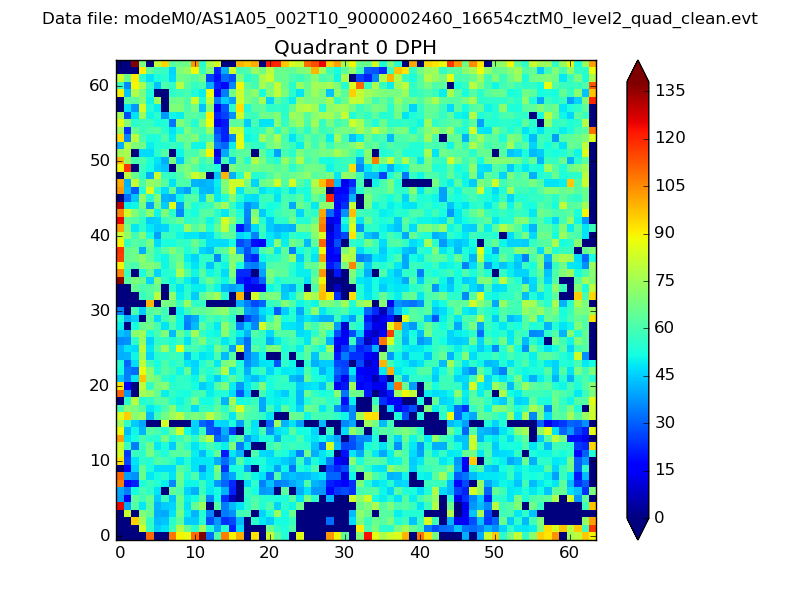 |
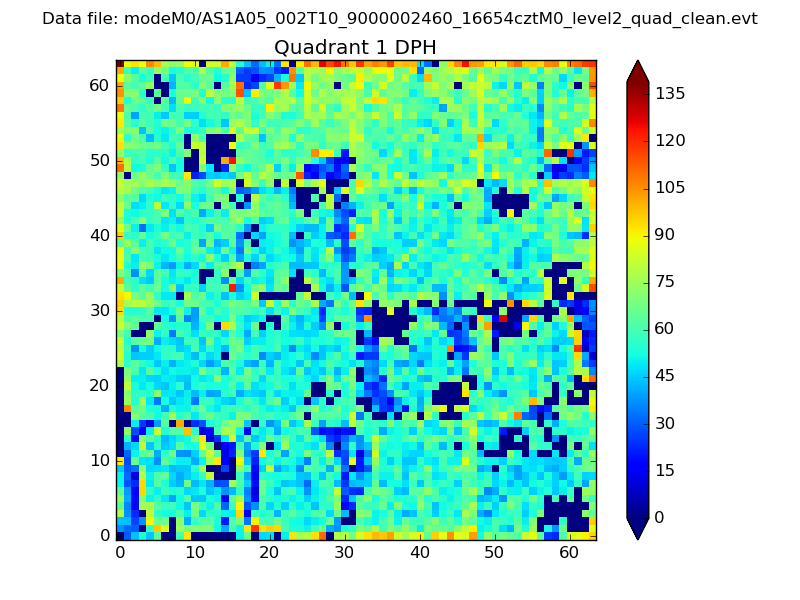 |
Quadrant B |
|---|---|---|---|
| Quadrant D | 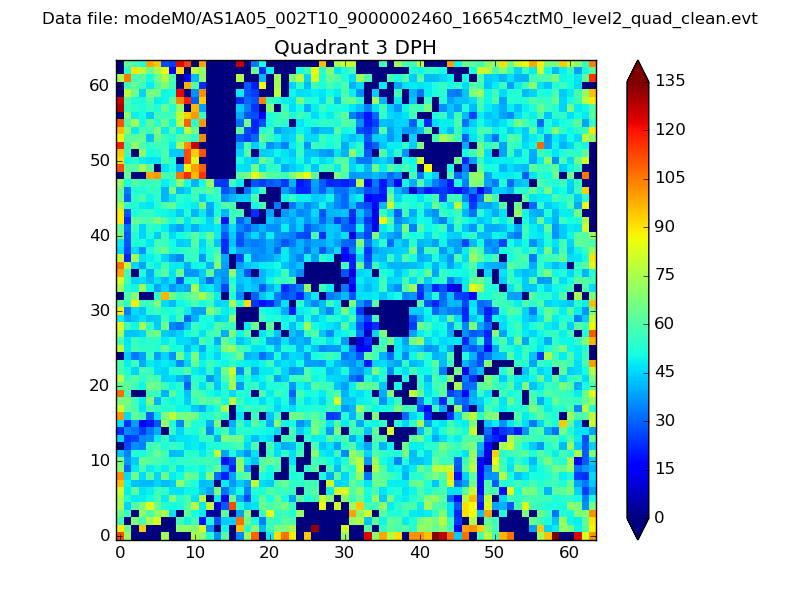 |
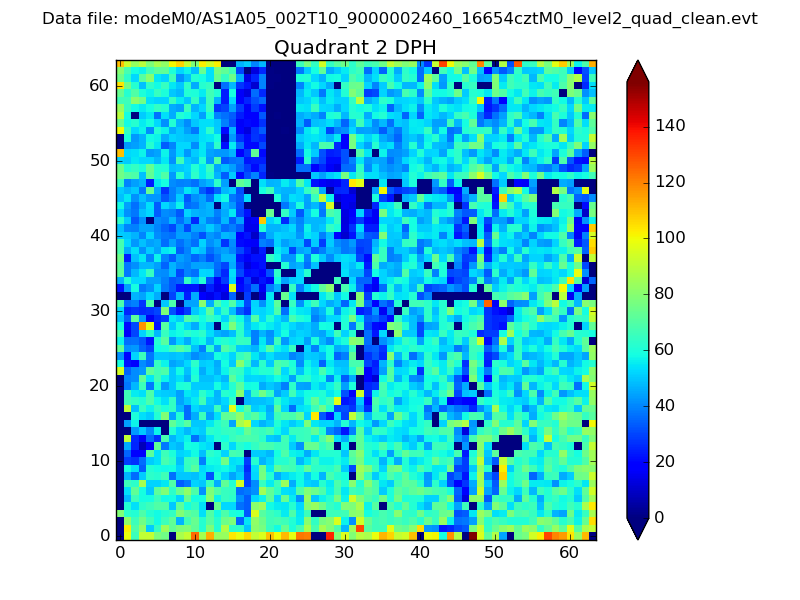 |
Quadrant C |
| Plot type | Count rate plots | Images |
|---|---|---|
| Comparison with Poisson distribution Blue bars denote a histogram of data divided into 1 sec bins. Red curve is a Poisson curve with rate = median count rate of data. |
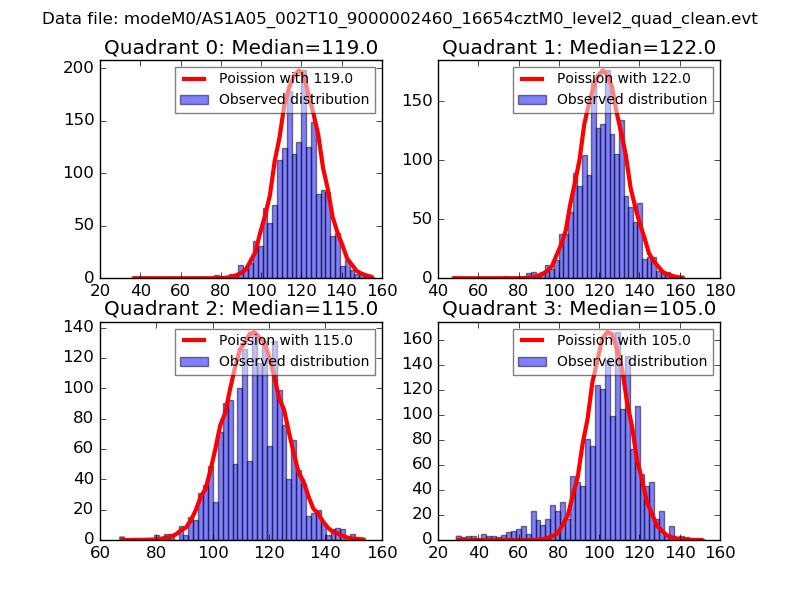 |
 |
| Quadrant-wise count rates Data is divided into 100 sec bins |
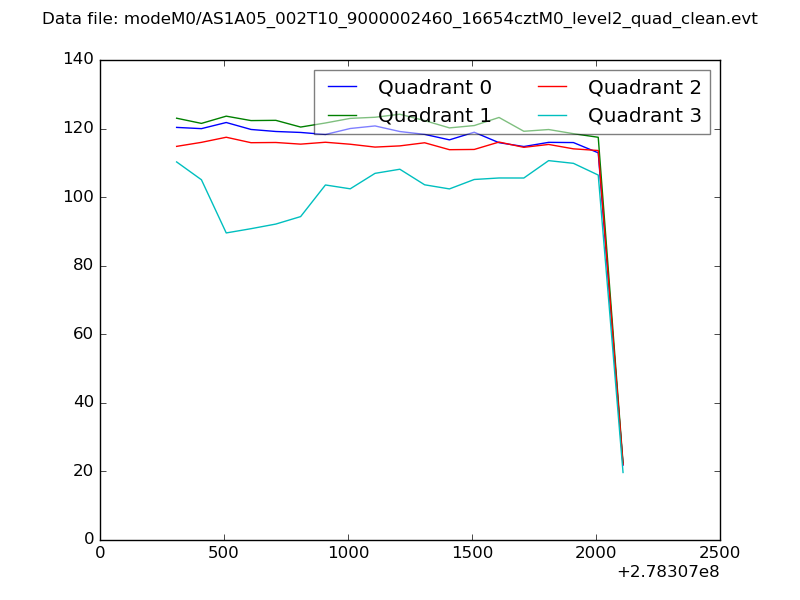 |
|
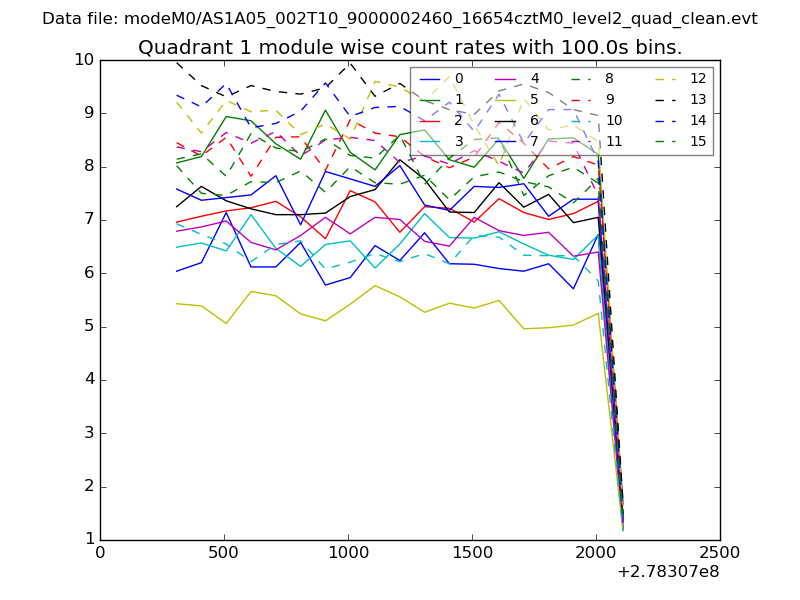
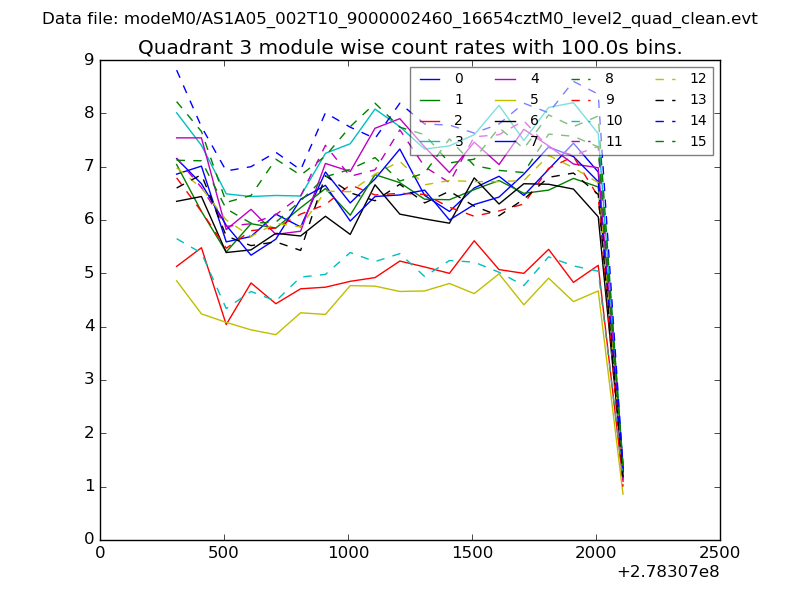
| Module-wise count rates for Quadrant A Data is divided into 100 sec bins |
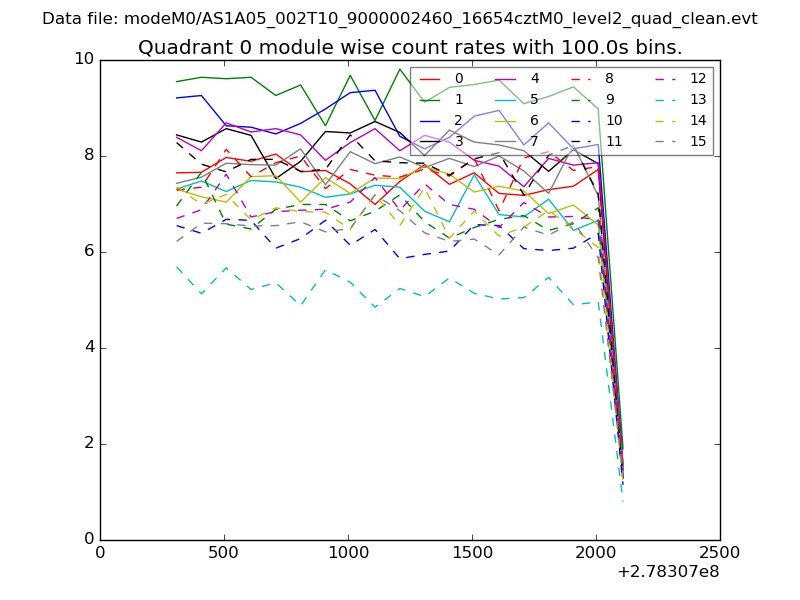 |
 |
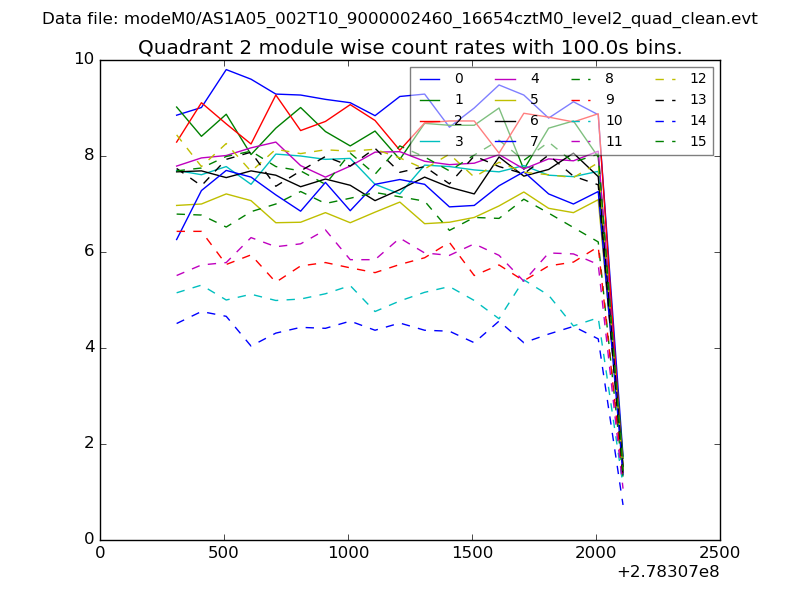
| Module-wise count rates for Quadrant B Data is divided into 100 sec bins |
 |
 |
| Module-wise count rates for Quadrant C Data is divided into 100 sec bins |
 |
 |
| Module-wise count rates for Quadrant D Data is divided into 100 sec bins |
 |
 |
| Parameter | Plot |
|---|---|
| CZT HV Monitor | 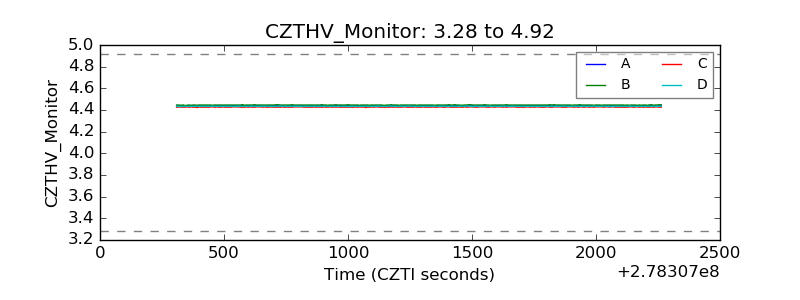 |
| D_VDD | 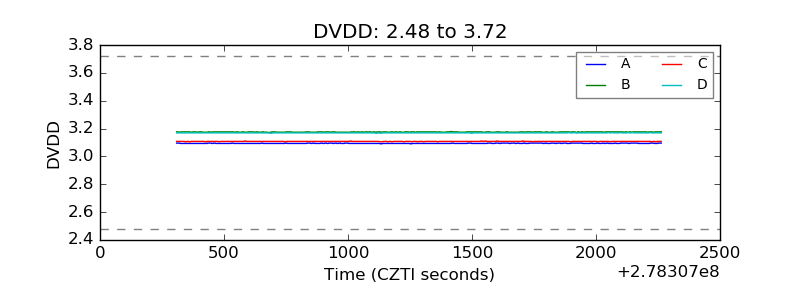 |
| Temperature 1 | 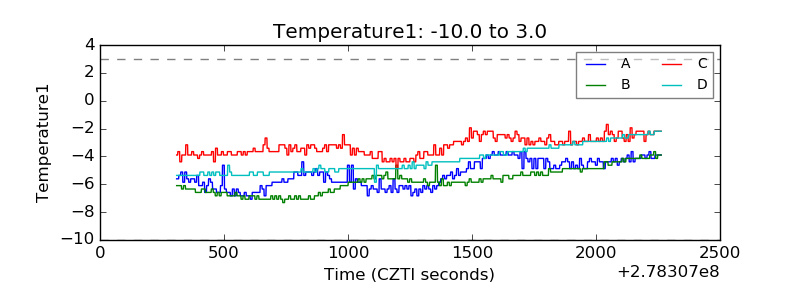 |
| Veto HV Monitor | 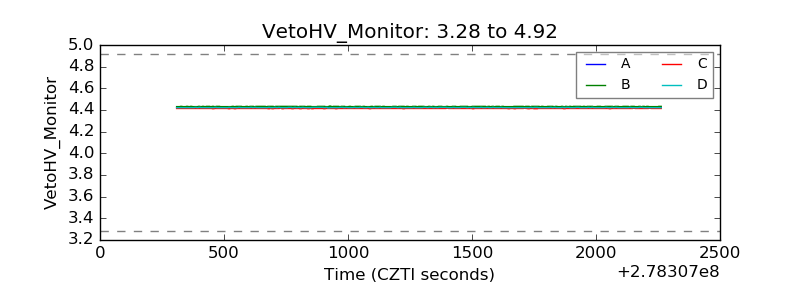 |
| Veto LLD | 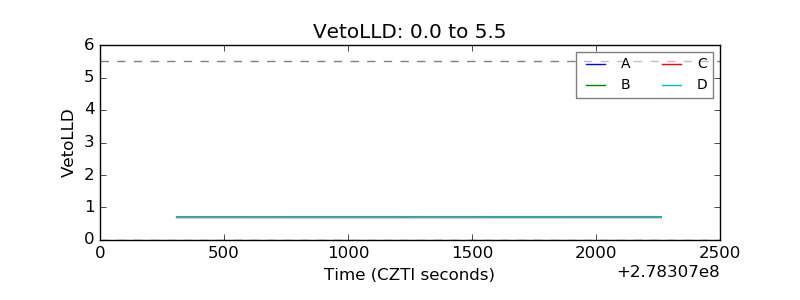 |
| Alpha Counter | 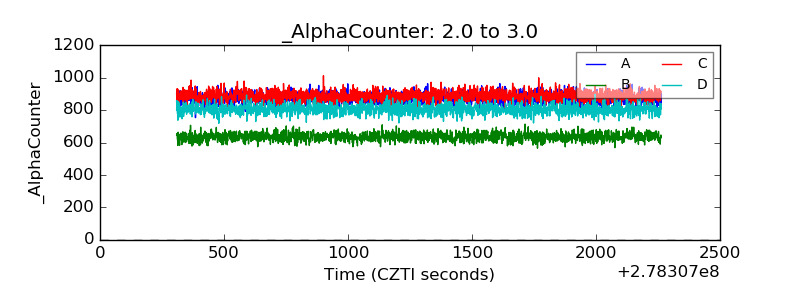 |
| _CPM_Rate | 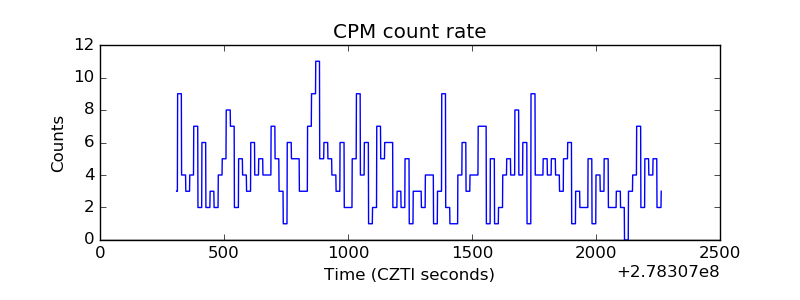 |
| CZT Counter | 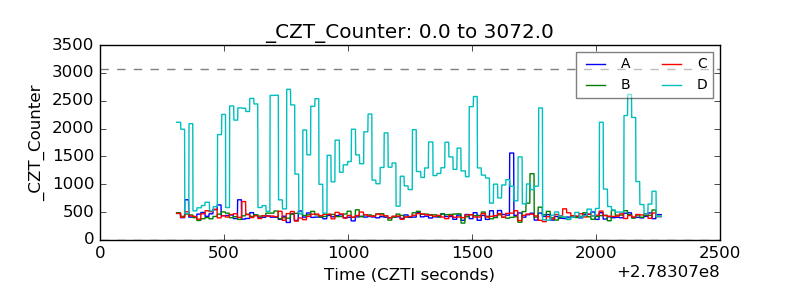 |
| +2.5 Volts monitor |  |
| +5 Volts monitor |  |
| _ROLL_ROT | 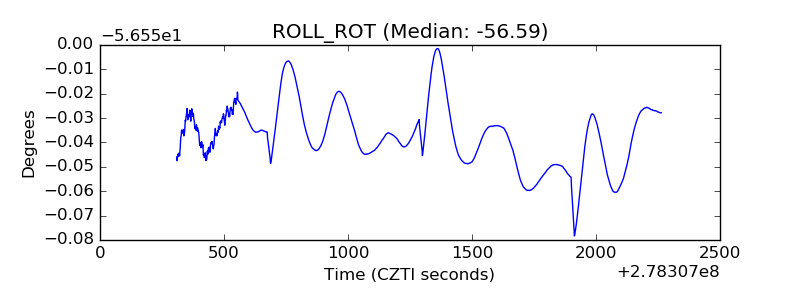 |
| _Roll_DEC | 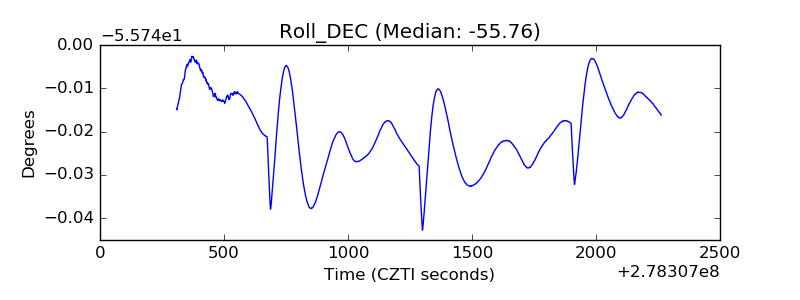 |
| _Roll_RA | 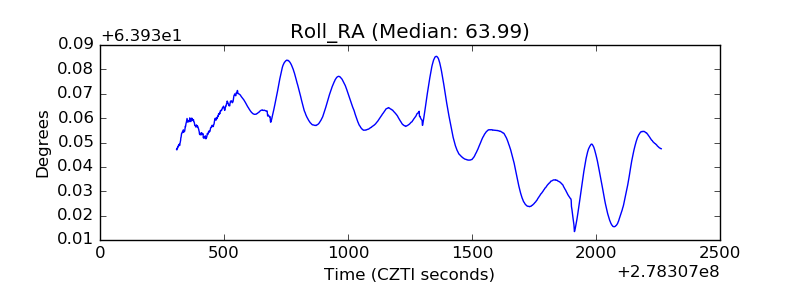 |
| Veto Counter | 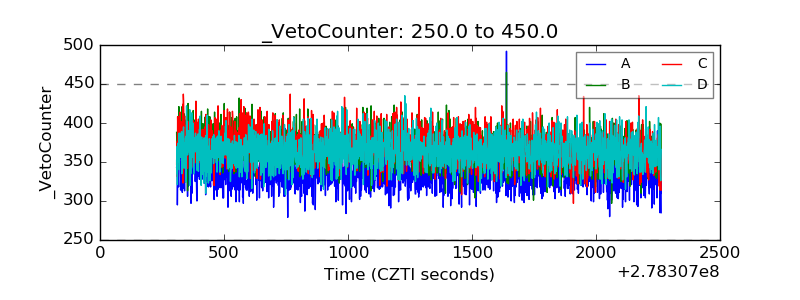 |