| Param | Original file | Final file |
|---|---|---|
| Filename | modeM0/AS1A05_002T10_9000002460_16655cztM0_level2.evt | modeM0/AS1A05_002T10_9000002460_16655cztM0_level2_quad_clean.evt |
| Size (bytes) | 639,927,360 | 98,838,720 |
| Size | 610.3 MB | 94.3 MB |
| Events in quadrant A | 3,751,257 | 618,914 |
| Events in quadrant B | 4,094,781 | 629,841 |
| Events in quadrant C | 3,906,231 | 601,704 |
| Events in quadrant D | 7,074,959 | 575,294 |
| Mode SS | |||
|---|---|---|---|
| Quadrant | BADHDUFLAG | Total packets | Discarded packets |
| A | 0 | 166 | 0 |
| B | 0 | 166 | 0 |
| C | 0 | 166 | 0 |
| D | 0 | 166 | 0 |
| Mode M0 | |||
|---|---|---|---|
| Quadrant | BADHDUFLAG | Total packets | Discarded packets |
| A | 0 | 16746 | 1 |
| B | 0 | 17480 | 1 |
| C | 0 | 16875 | 1 |
| D | 0 | 26591 | 1 |
| Mode M9 | |||
|---|---|---|---|
| Quadrant | BADHDUFLAG | Total packets | Discarded packets |
| A | 0 | 5 | 0 |
| B | 0 | 5 | 0 |
| C | 0 | 5 | 0 |
| D | 0 | 5 | 0 |
| Quadrant | Total seconds | Saturated seconds | Saturation percentage |
|---|---|---|---|
| A | 8163 | 51 | 0.624770% |
| B | 8163 | 71 | 0.869778% |
| C | 8163 | 80 | 0.980032% |
| D | 8163 | 498 | 6.100698% |
Noise dominated data is calculated using 1-second bins in cleaned event files. If a bin has >2000 counts, and if more than 50% of those come from <1% of pixels, then it is considered to be noise-dominated and hence unusable.
| Quadrant | # 1 sec bins | Bins with >0 counts | Bins with >2000 counts | High rate bins dominated by noise | Noise dominated (total time) | Noise dominated (detector-on time) | Marked lightcurve |
|---|---|---|---|---|---|---|---|
| A | 8664 | 8165 | 6 | 6 | 0.07% | 0.07% | 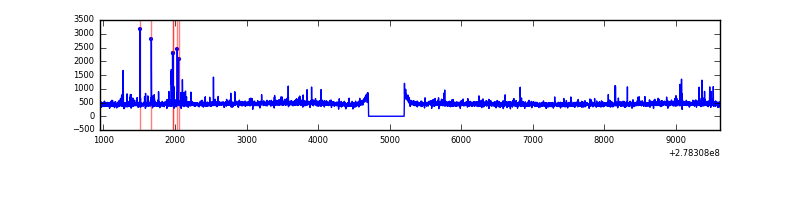 |
| B | 8664 | 8165 | 4 | 4 | 0.05% | 0.05% | 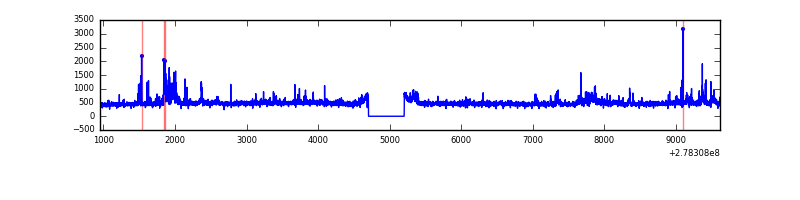 |
| C | 8664 | 8165 | 0 | 0 | 0.00% | 0.00% | 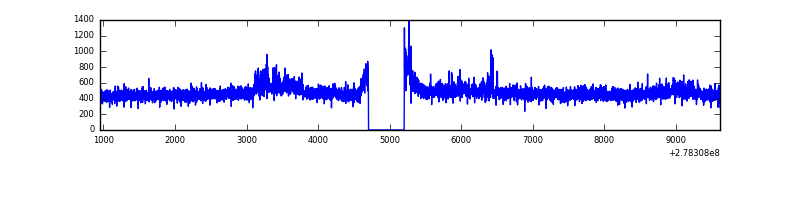 |
| D | 8664 | 8164 | 365 | 365 | 4.21% | 4.47% | 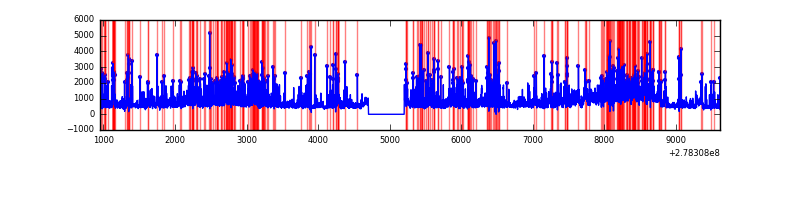 |
Top three noisy pixels from each quadrant. If the there are fewer than three noisy pixels in the level2.evt file, extra rows are filled as -1
| Pixel properties | Quadrant properties | ||||||
|---|---|---|---|---|---|---|---|
| Quadrant | DetID | PixID | Counts | Sigma | Mean | Median | Sigma |
| A | 3 | 1 | 105255 | 552.8 | 941 | 917 | 188.7 |
| A | 12 | 96 | 22823 | 116.06 | 941 | 917 | 188.7 |
| A | 15 | 223 | 8650 | 40.97 | 941 | 917 | 188.7 |
| B | 0 | 189 | 134030 | 738.05 | 942 | 918 | 180.4 |
| B | 15 | 35 | 131106 | 721.83 | 942 | 918 | 180.4 |
| B | 0 | 198 | 60248 | 328.96 | 942 | 918 | 180.4 |
| C | 3 | 233 | 219704 | 1036.38 | 902 | 905 | 211.1 |
| C | 14 | 238 | 139848 | 658.13 | 902 | 905 | 211.1 |
| C | 7 | 247 | 26844 | 122.86 | 902 | 905 | 211.1 |
| D | 1 | 52 | 2138216 | 9753.22 | 900 | 874 | 219.1 |
| D | 2 | 16 | 1142366 | 5208.91 | 900 | 874 | 219.1 |
| D | 10 | 70 | 221243 | 1005.6 | 900 | 874 | 219.1 |
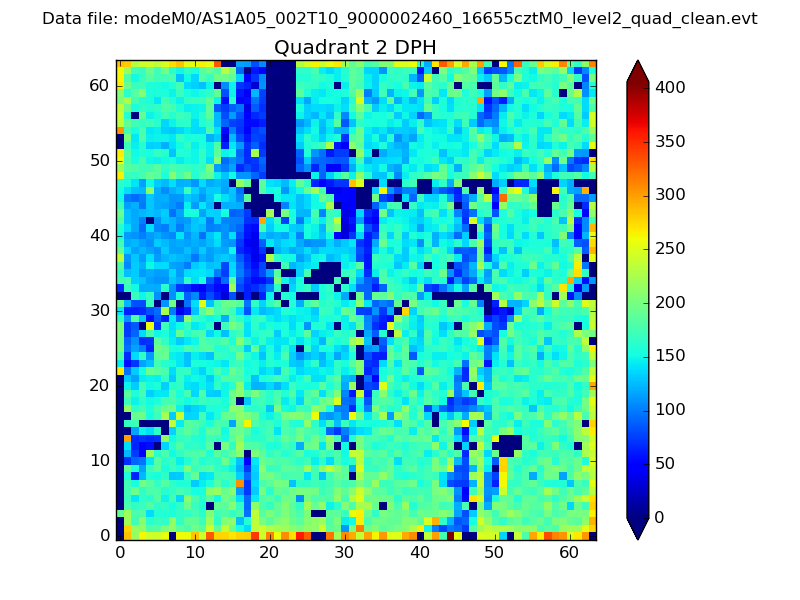
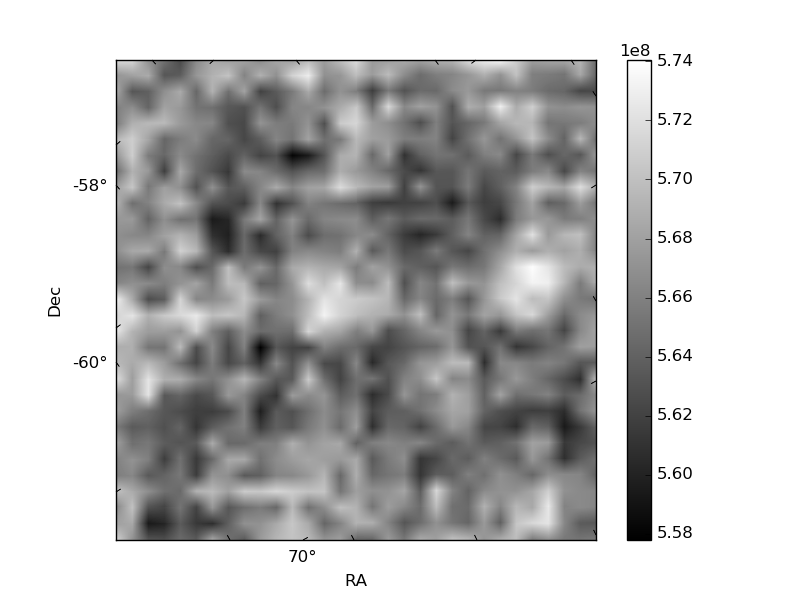
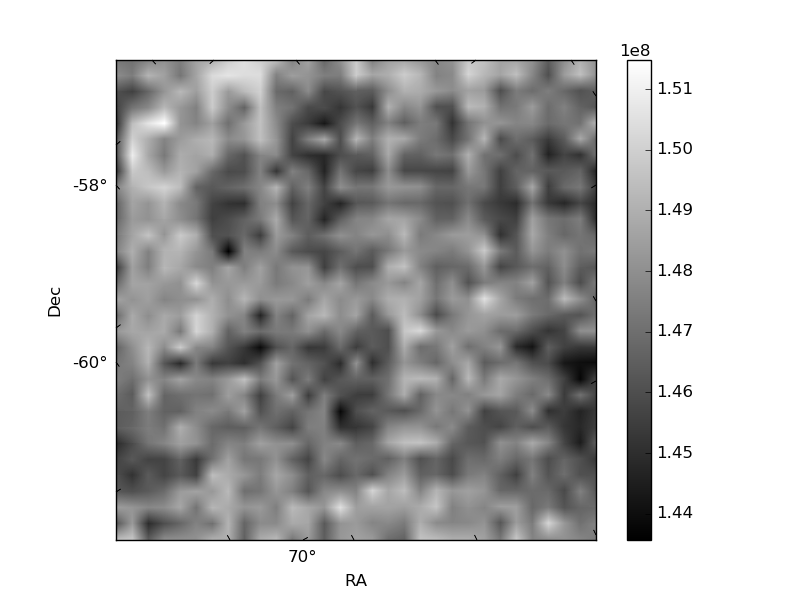
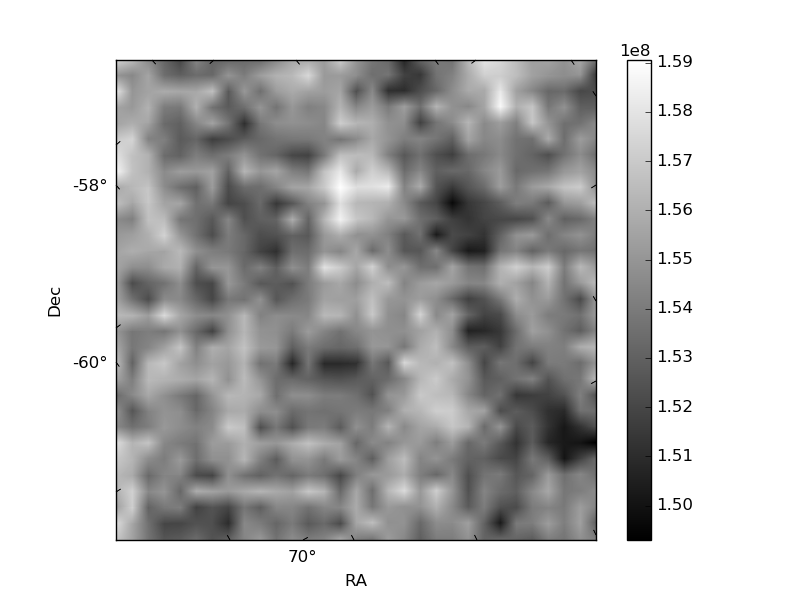
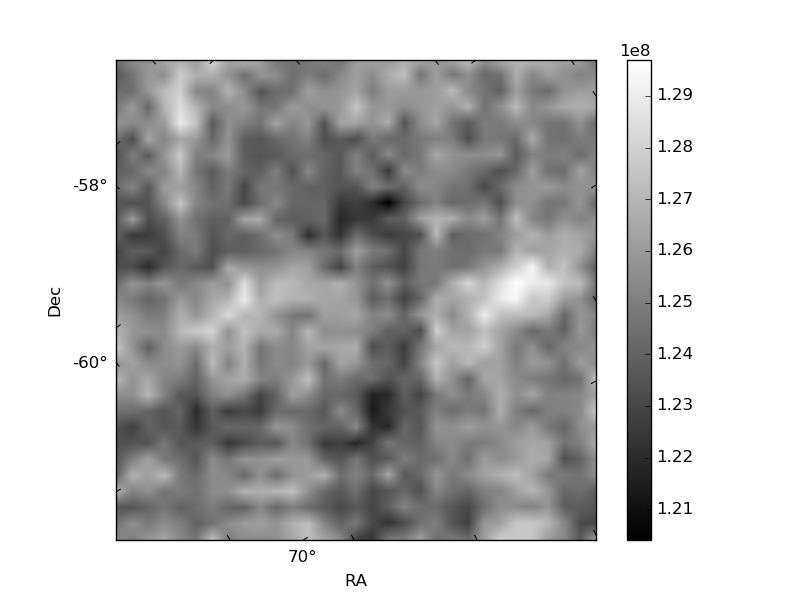
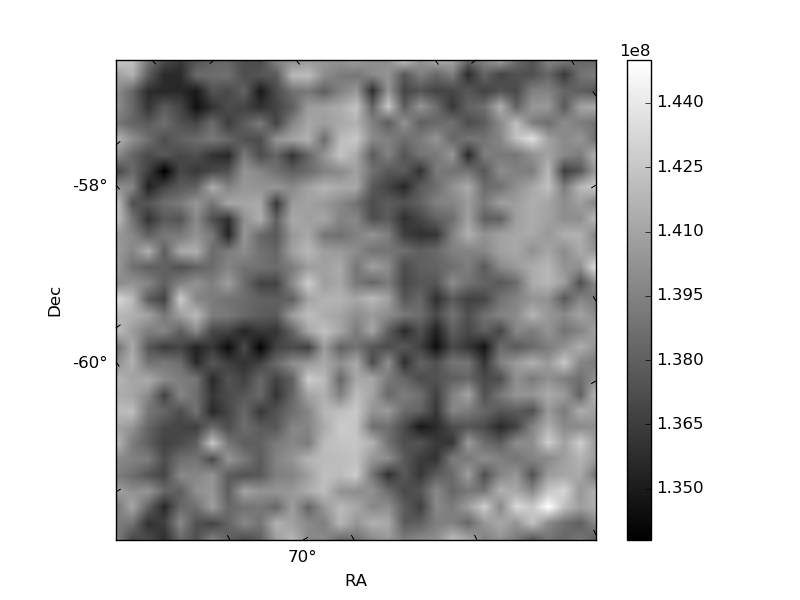
Histogram calculated using DETX and DETY for each event in the final _common_clean file
| Quadrant A | 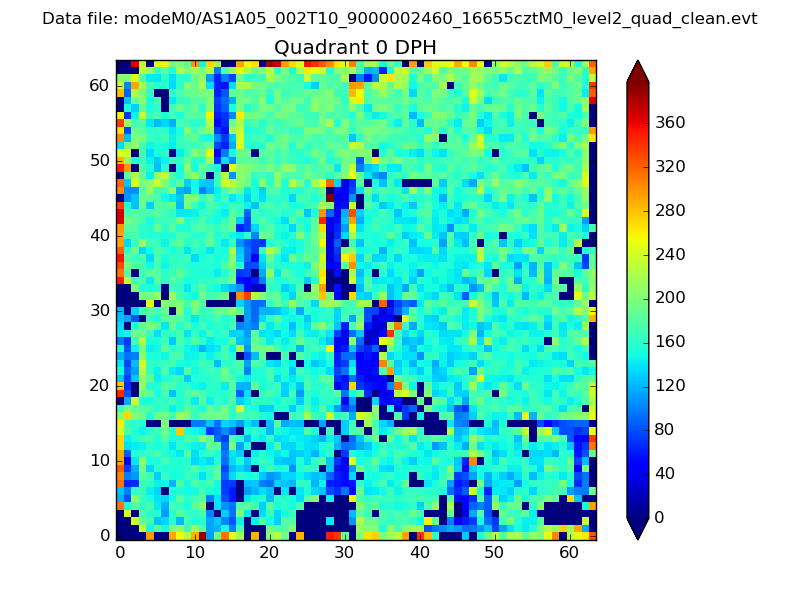 |
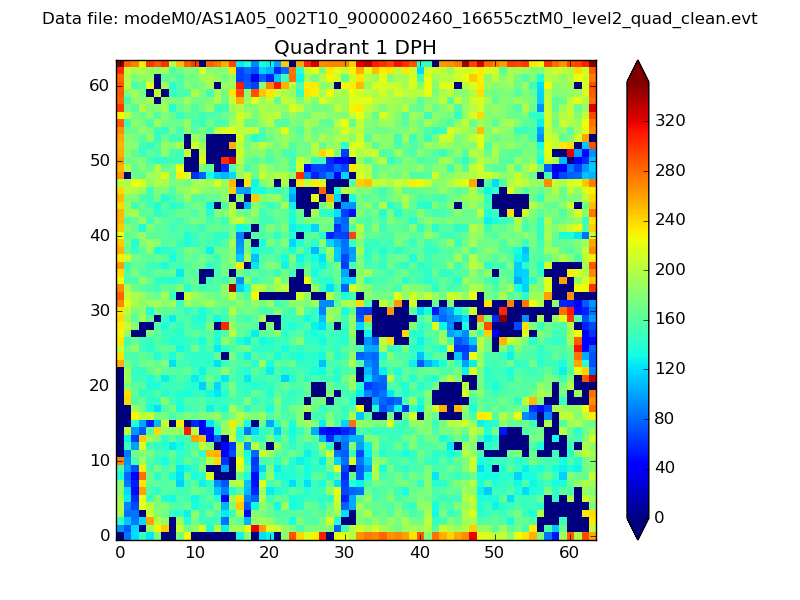 |
Quadrant B |
|---|---|---|---|
| Quadrant D | 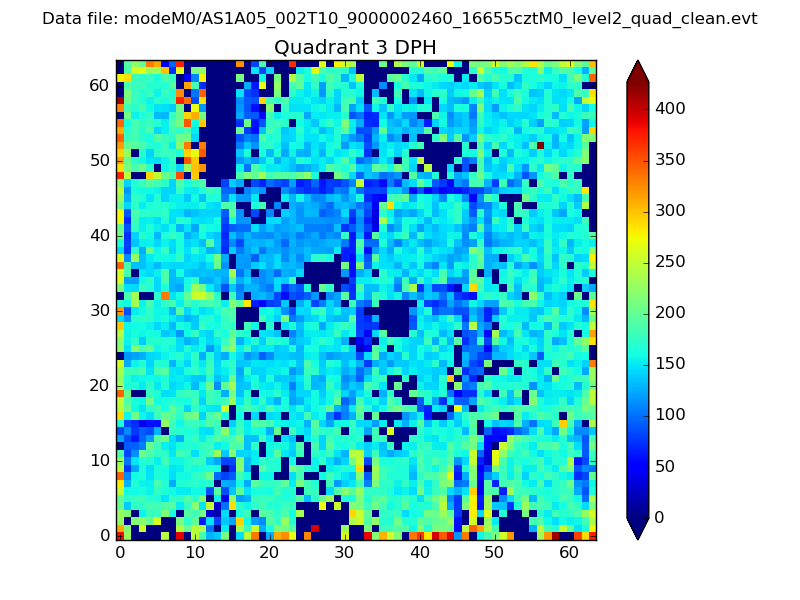 |
 |
Quadrant C |
| Plot type | Count rate plots | Images |
|---|---|---|
| Comparison with Poisson distribution Blue bars denote a histogram of data divided into 1 sec bins. Red curve is a Poisson curve with rate = median count rate of data. |
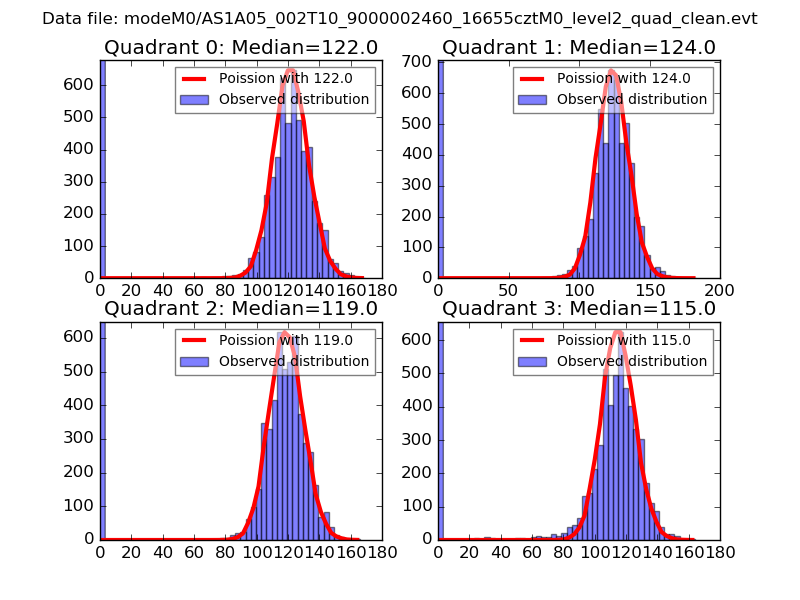 |
 |
| Quadrant-wise count rates Data is divided into 100 sec bins |
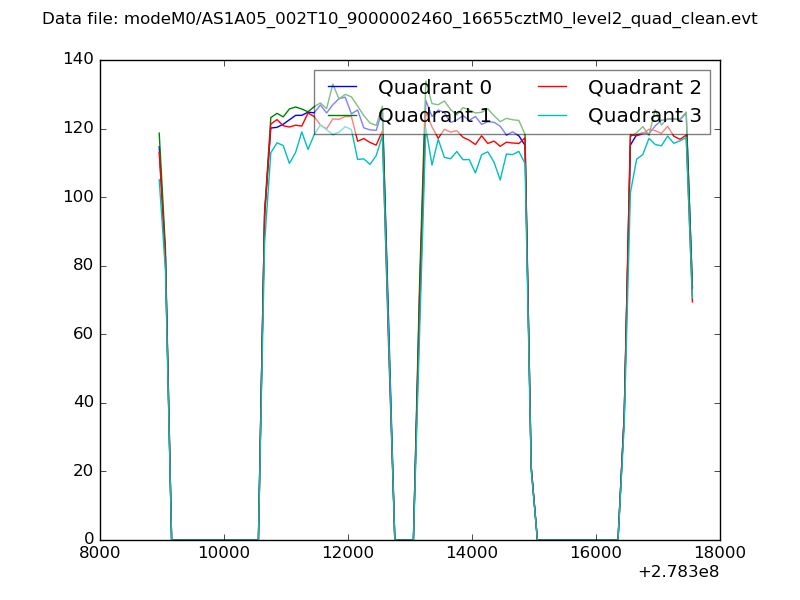 |
|
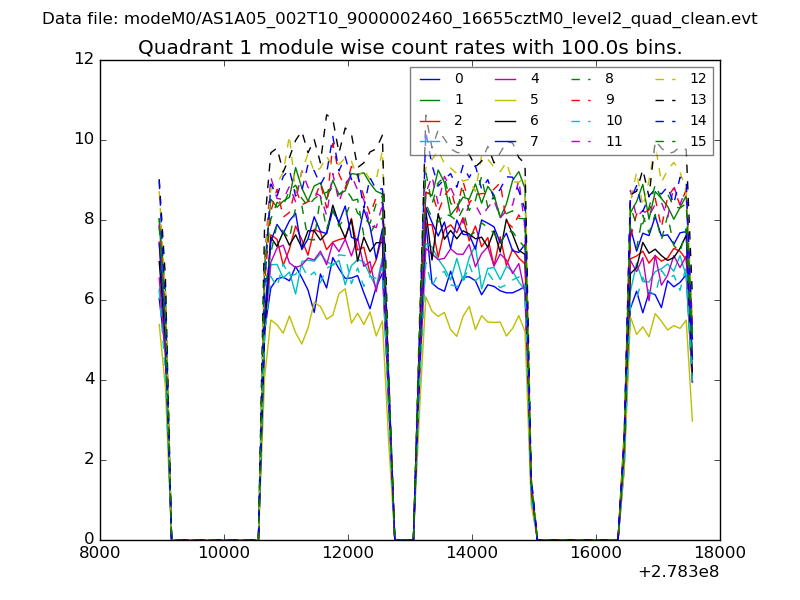
| Module-wise count rates for Quadrant A Data is divided into 100 sec bins |
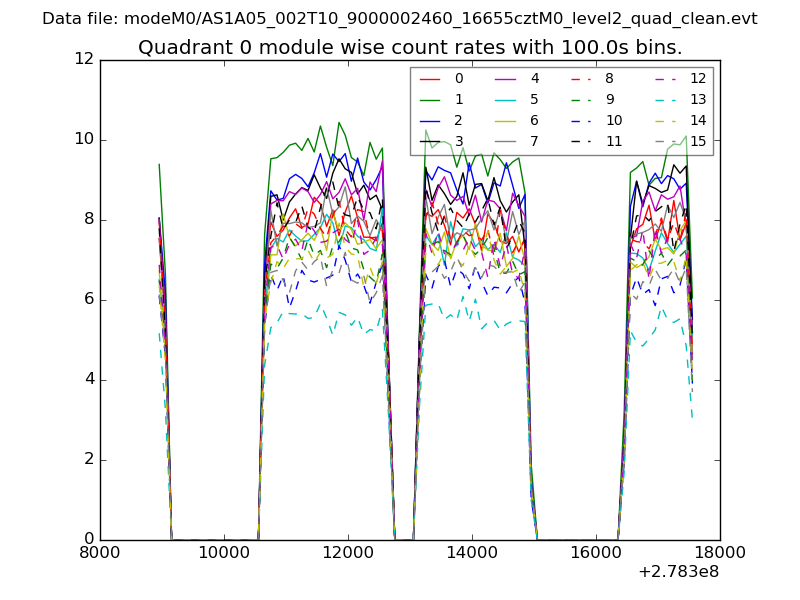 |
 |
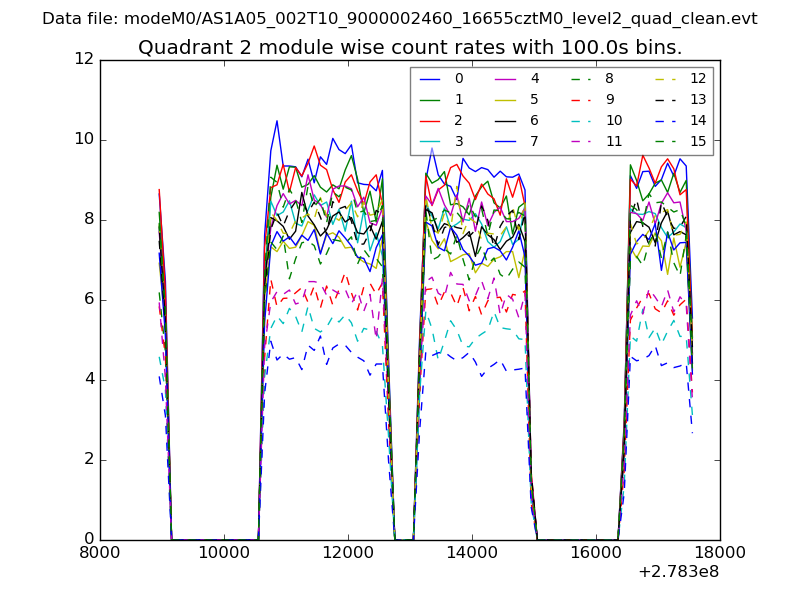
| Module-wise count rates for Quadrant B Data is divided into 100 sec bins |
 |
 |
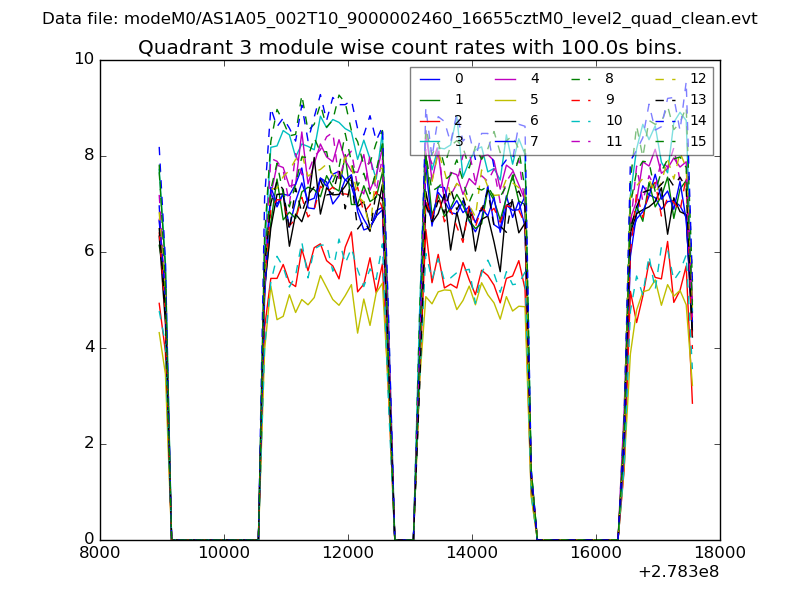
| Module-wise count rates for Quadrant C Data is divided into 100 sec bins |
 |
 |
| Module-wise count rates for Quadrant D Data is divided into 100 sec bins |
 |
 |
| Parameter | Plot |
|---|---|
| CZT HV Monitor | 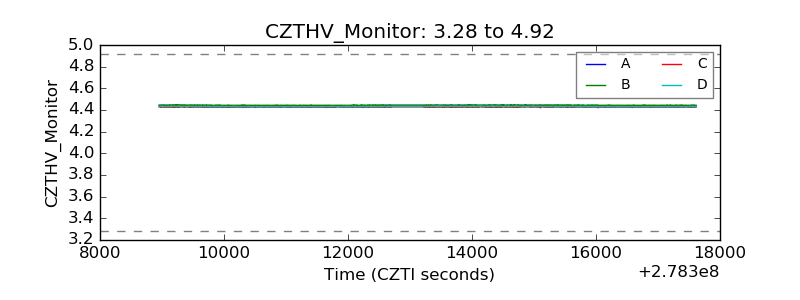 |
| D_VDD | 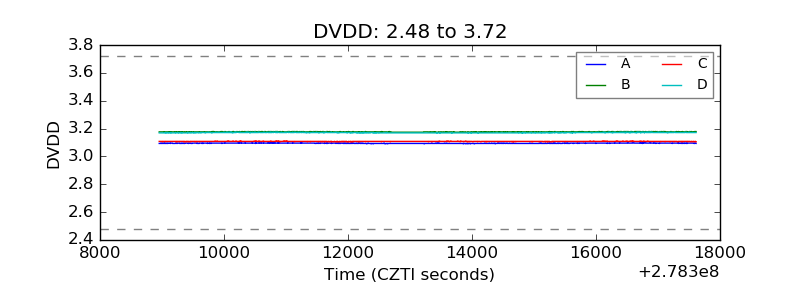 |
| Temperature 1 |  |
| Veto HV Monitor | 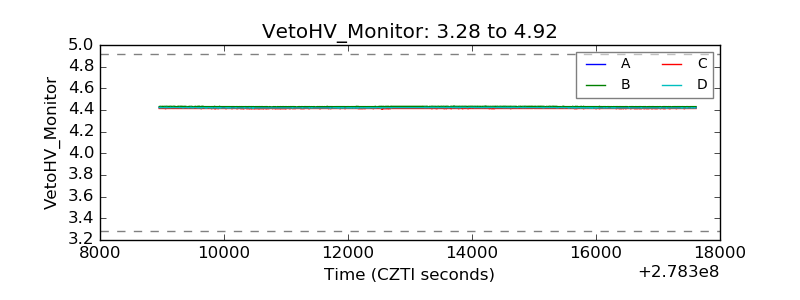 |
| Veto LLD | 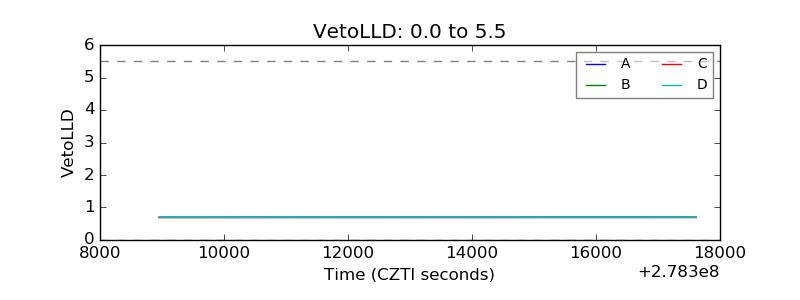 |
| Alpha Counter | 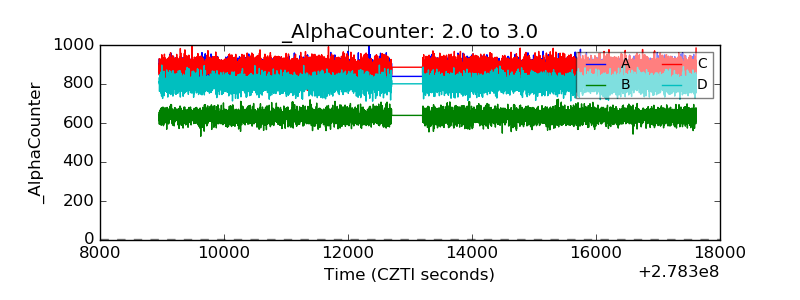 |
| _CPM_Rate | 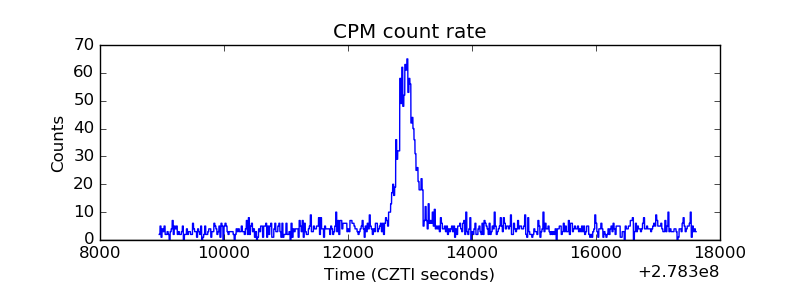 |
| CZT Counter | 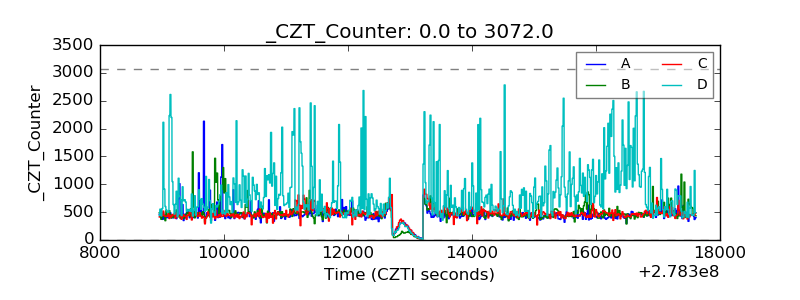 |
| +2.5 Volts monitor |  |
| +5 Volts monitor |  |
| _ROLL_ROT | 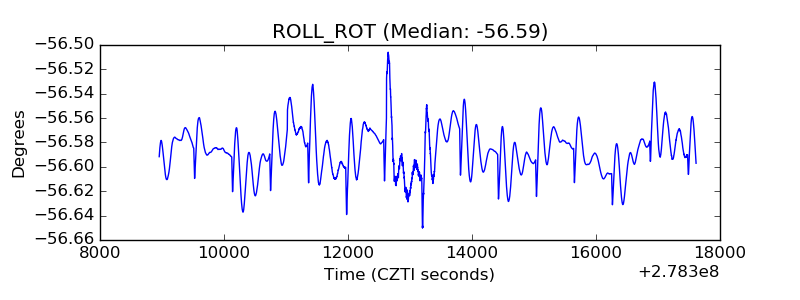 |
| _Roll_DEC | 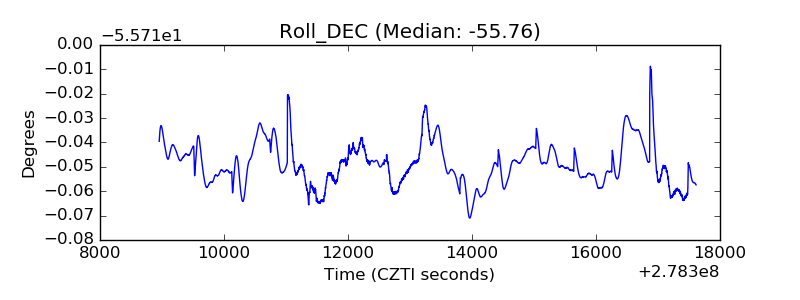 |
| _Roll_RA | 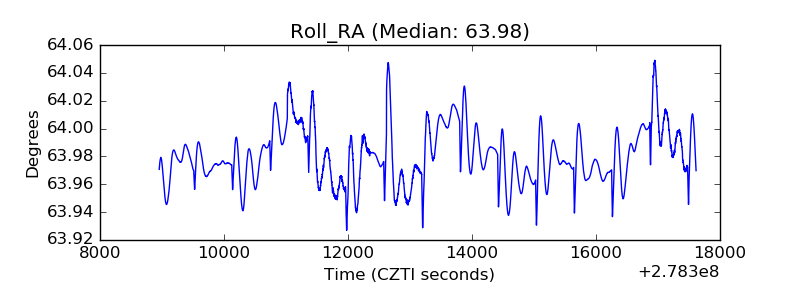 |
| Veto Counter | 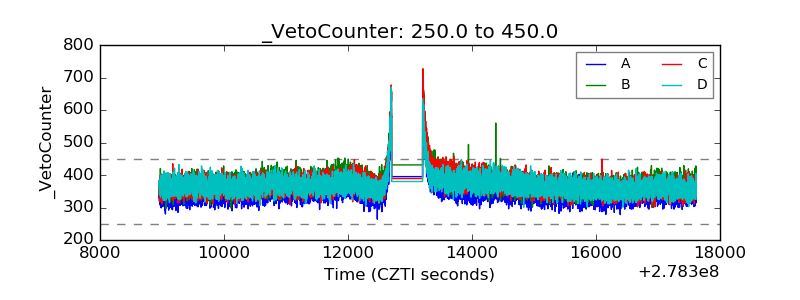 |