| Param | Original file | Final file |
|---|---|---|
| Filename | modeM0/AS1A05_212T01_9000002454cztM0_level2.fits | modeM0/AS1A05_212T01_9000002454cztM0_level2_quad_clean.evt |
| Size (bytes) | 71,222,400 | 49,152,960 |
| Size | 67.9 MB | 46.9 MB |
| Events in quadrant A | 445,054 | 264,944 |
| Events in quadrant B | 427,522 | 266,741 |
| Events in quadrant C | 426,322 | 245,872 |
| Events in quadrant D | 378,846 | 230,154 |
| Mode SS | |||
|---|---|---|---|
| Quadrant | BADHDUFLAG | Total packets | Discarded packets |
| A | 0 | 140 | 0 |
| B | 0 | 140 | 0 |
| C | 0 | 140 | 0 |
| D | 0 | 140 | 0 |
| Mode M9 | |||
|---|---|---|---|
| Quadrant | BADHDUFLAG | Total packets | Discarded packets |
| A | 0 | 11 | 0 |
| B | 0 | 11 | 0 |
| C | 0 | 11 | 0 |
| D | 0 | 11 | 0 |
| Mode M0 | |||
|---|---|---|---|
| Quadrant | BADHDUFLAG | Total packets | Discarded packets |
| A | 0 | 14672 | 0 |
| B | 0 | 15675 | 0 |
| C | 0 | 14830 | 0 |
| D | 0 | 15178 | 0 |
| Quadrant | Total seconds | Saturated seconds | Saturation percentage |
|---|---|---|---|
| A | 6885 | 94 | 1.365287% |
| B | 6885 | 96 | 1.394336% |
| C | 6885 | 102 | 1.481481% |
| D | 6885 | 96 | 1.394336% |
Noise dominated data is calculated using 1-second bins in cleaned event files. If a bin has >2000 counts, and if more than 50% of those come from <1% of pixels, then it is considered to be noise-dominated and hence unusable.
| Quadrant | # 1 sec bins | Bins with >0 counts | Bins with >2000 counts | High rate bins dominated by noise | Noise dominated (total time) | Noise dominated (detector-on time) | Marked lightcurve |
|---|---|---|---|---|---|---|---|
| A | 8060 | 6885 | 0 | 0 | 0.00% | 0.00% |  |
| B | 8060 | 6885 | 0 | 0 | 0.00% | 0.00% |  |
| C | 8060 | 6885 | 0 | 0 | 0.00% | 0.00% |  |
| D | 8060 | 6885 | 0 | 0 | 0.00% | 0.00% |  |
Top three noisy pixels from each quadrant. If the there are fewer than three noisy pixels in the level2.evt file, extra rows are filled as -1
| Pixel properties | Quadrant properties | ||||||
|---|---|---|---|---|---|---|---|
| Quadrant | DetID | PixID | Counts | Sigma | Mean | Median | Sigma |
| A | 0 | 29 | 373 | 8.71 | 115 | 109 | 30.3 |
| A | 14 | 79 | 363 | 8.38 | 115 | 109 | 30.3 |
| A | 7 | 110 | 353 | 8.05 | 115 | 109 | 30.3 |
| B | 2 | 9 | 357 | 10.15 | 113 | 108 | 24.5 |
| B | 5 | 128 | 290 | 7.42 | 113 | 108 | 24.5 |
| B | 2 | 8 | 288 | 7.33 | 113 | 108 | 24.5 |
| C | 9 | 188 | 310 | 6.59 | 112 | 105 | 31.1 |
| C | 1 | 80 | 309 | 6.56 | 112 | 105 | 31.1 |
| C | 1 | 81 | 307 | 6.49 | 112 | 105 | 31.1 |
| D | 3 | 14 | 285 | 6.15 | 108 | 99 | 30.2 |
| D | 1 | 19 | 275 | 5.82 | 108 | 99 | 30.2 |
| D | 6 | 231 | 270 | 5.66 | 108 | 99 | 30.2 |
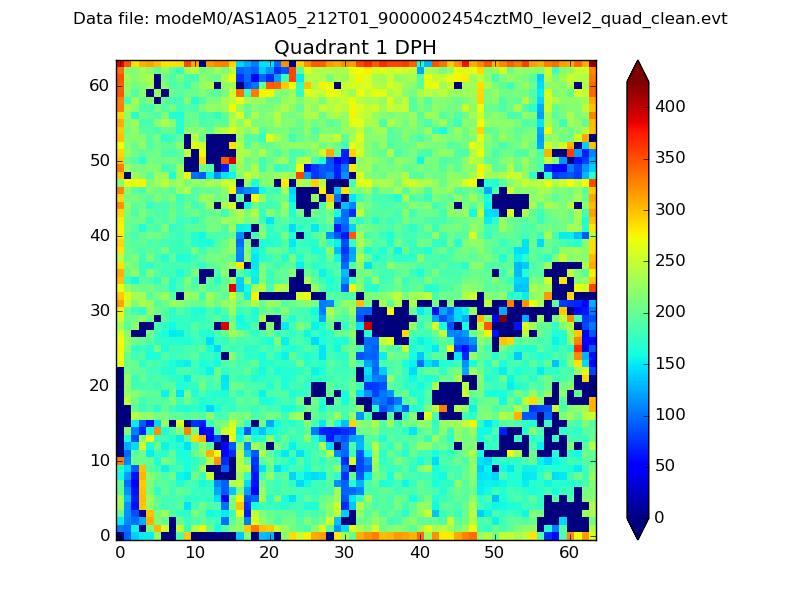
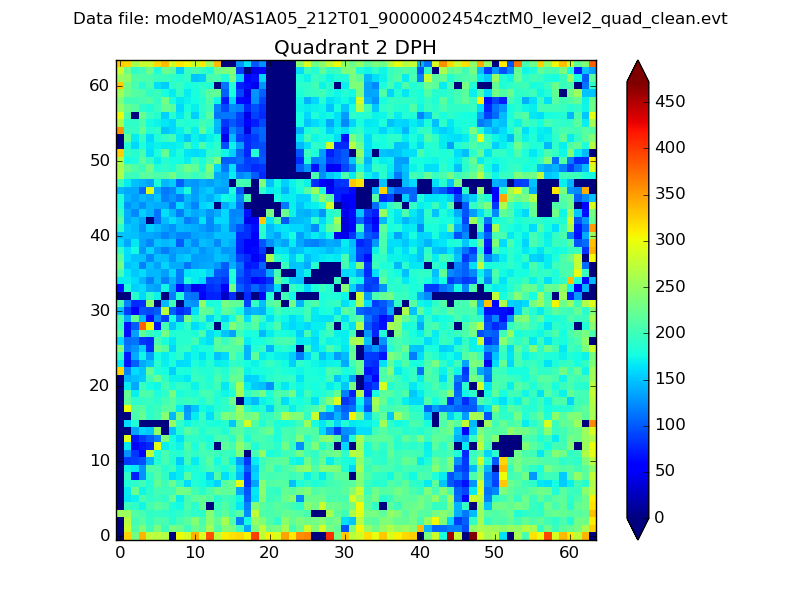
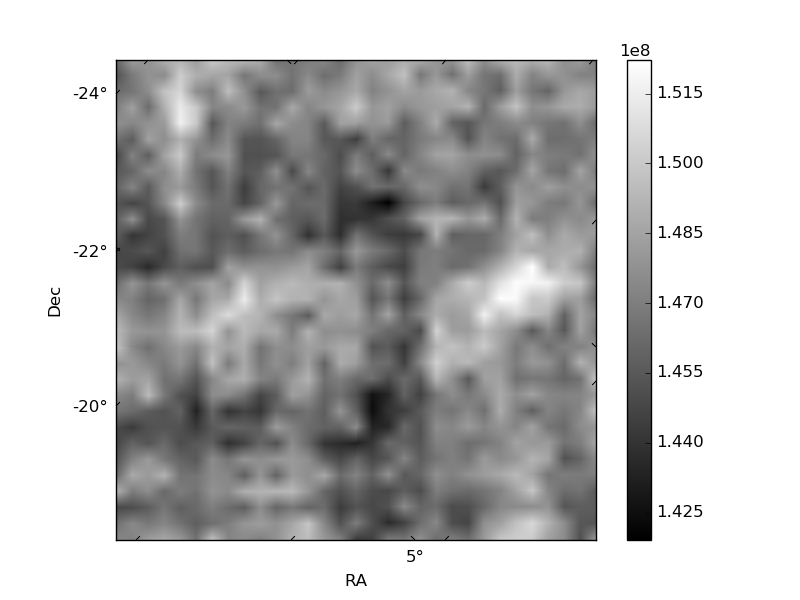
Histogram calculated using DETX and DETY for each event in the final _common_clean file
| Quadrant A |  |
 |
Quadrant B |
|---|---|---|---|
| Quadrant D | 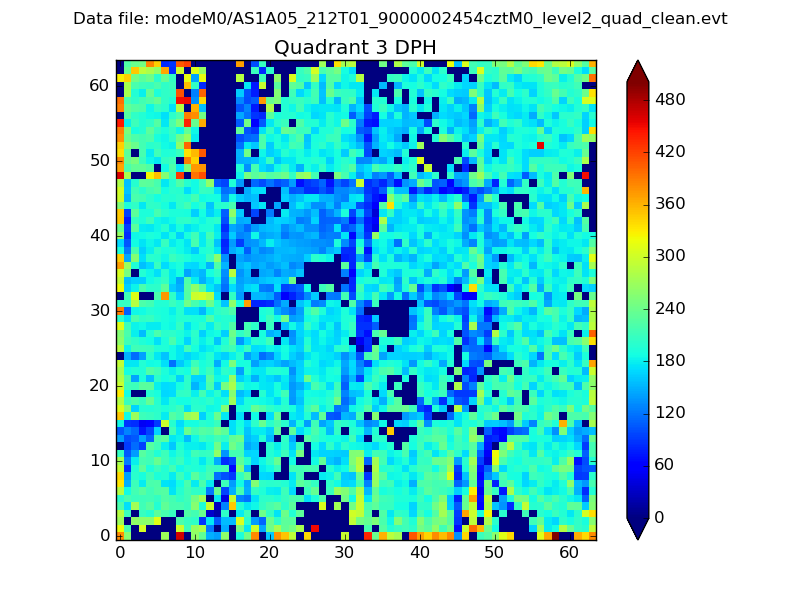 |
 |
Quadrant C |
| Plot type | Count rate plots | Images |
|---|---|---|
| Comparison with Poisson distribution Blue bars denote a histogram of data divided into 1 sec bins. Red curve is a Poisson curve with rate = median count rate of data. |
 |
 |
| Quadrant-wise count rates Data is divided into 100 sec bins |
 |
|
| Module-wise count rates for Quadrant A Data is divided into 100 sec bins |
 |
 |
| Module-wise count rates for Quadrant B Data is divided into 100 sec bins |
 |
 |
| Module-wise count rates for Quadrant C Data is divided into 100 sec bins |
 |
 |
| Module-wise count rates for Quadrant D Data is divided into 100 sec bins |
 |
 |
| Parameter | Plot |
|---|---|
| CZT HV Monitor | 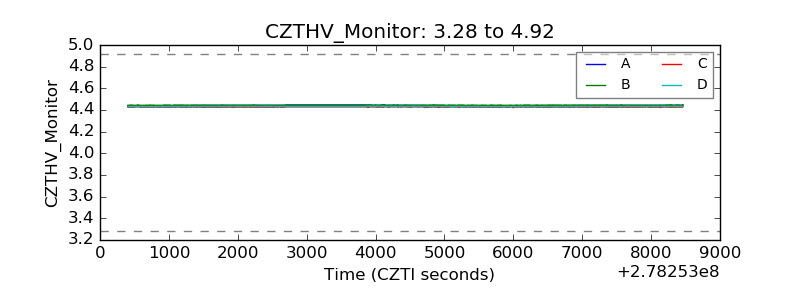 |
| D_VDD | 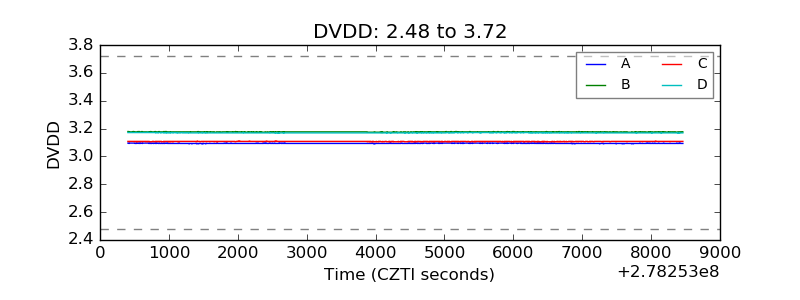 |
| Temperature 1 |  |
| Veto HV Monitor |  |
| Veto LLD |  |
| Alpha Counter |  |
| _CPM_Rate |  |
| CZT Counter |  |
| +2.5 Volts monitor |  |
| +5 Volts monitor |  |
| _ROLL_ROT | 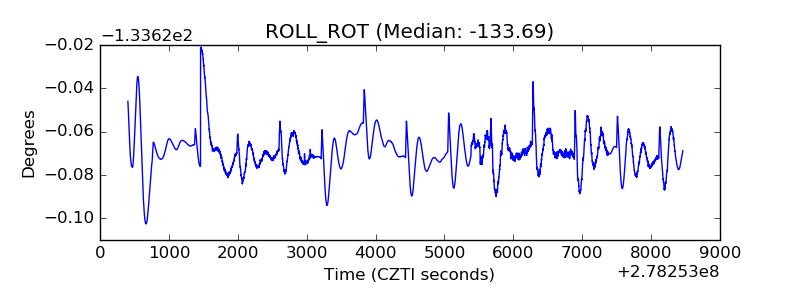 |
| _Roll_DEC |  |
| _Roll_RA |  |
| Veto Counter |  |