| Param | Original file | Final file |
|---|---|---|
| Filename | modeM0/AS1A05_212T01_9000002454_16643cztM0_level2.evt | modeM0/AS1A05_212T01_9000002454_16643cztM0_level2_quad_clean.evt |
| Size (bytes) | 262,460,160 | 53,127,360 |
| Size | 250.3 MB | 50.7 MB |
| Events in quadrant A | 1,860,049 | 345,668 |
| Events in quadrant B | 2,009,661 | 352,334 |
| Events in quadrant C | 1,874,554 | 331,889 |
| Events in quadrant D | 1,962,419 | 328,171 |
| Mode SS | |||
|---|---|---|---|
| Quadrant | BADHDUFLAG | Total packets | Discarded packets |
| A | 0 | 74 | 0 |
| B | 0 | 74 | 0 |
| C | 0 | 74 | 0 |
| D | 0 | 74 | 0 |
| Mode M9 | |||
|---|---|---|---|
| Quadrant | BADHDUFLAG | Total packets | Discarded packets |
| A | 0 | 11 | 0 |
| B | 0 | 11 | 0 |
| C | 0 | 11 | 0 |
| D | 0 | 11 | 0 |
| Mode M0 | |||
|---|---|---|---|
| Quadrant | BADHDUFLAG | Total packets | Discarded packets |
| A | 0 | 7930 | 2 |
| B | 0 | 8392 | 1 |
| C | 0 | 8004 | 1 |
| D | 0 | 8228 | 1 |
| Quadrant | Total seconds | Saturated seconds | Saturation percentage |
|---|---|---|---|
| A | 3531 | 93 | 2.633815% |
| B | 3531 | 93 | 2.633815% |
| C | 3531 | 91 | 2.577174% |
| D | 3531 | 90 | 2.548853% |
Noise dominated data is calculated using 1-second bins in cleaned event files. If a bin has >2000 counts, and if more than 50% of those come from <1% of pixels, then it is considered to be noise-dominated and hence unusable.
| Quadrant | # 1 sec bins | Bins with >0 counts | Bins with >2000 counts | High rate bins dominated by noise | Noise dominated (total time) | Noise dominated (detector-on time) | Marked lightcurve |
|---|---|---|---|---|---|---|---|
| A | 4707 | 3533 | 2 | 2 | 0.04% | 0.06% | 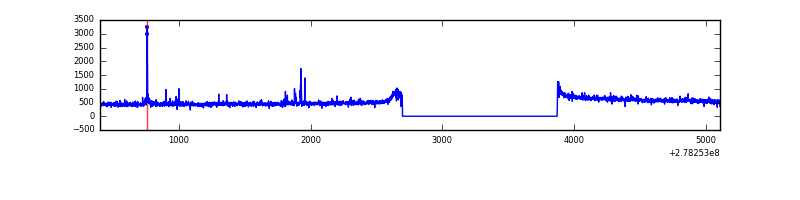 |
| B | 4707 | 3533 | 3 | 3 | 0.06% | 0.08% | 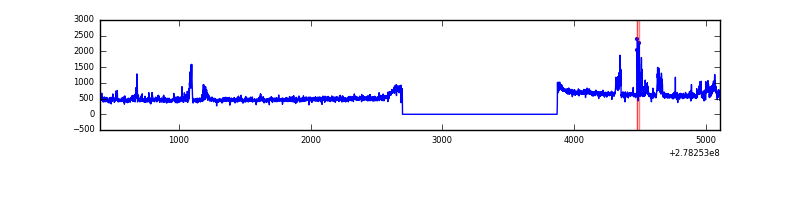 |
| C | 4707 | 3533 | 0 | 0 | 0.00% | 0.00% | 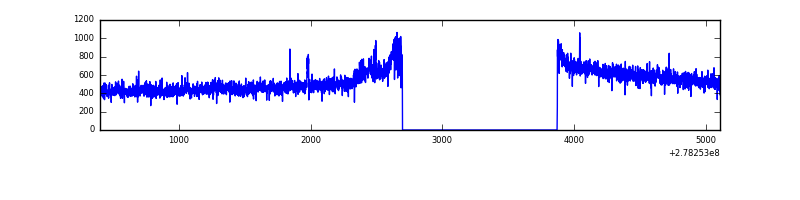 |
| D | 4707 | 3533 | 18 | 18 | 0.38% | 0.51% | 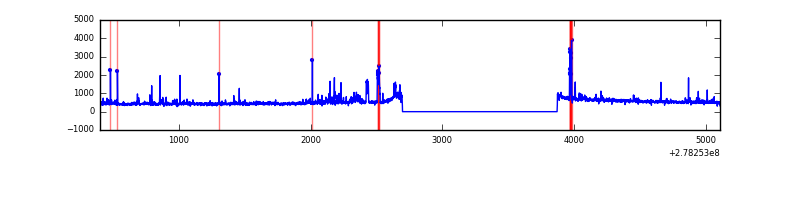 |
Top three noisy pixels from each quadrant. If the there are fewer than three noisy pixels in the level2.evt file, extra rows are filled as -1
| Pixel properties | Quadrant properties | ||||||
|---|---|---|---|---|---|---|---|
| Quadrant | DetID | PixID | Counts | Sigma | Mean | Median | Sigma |
| A | 3 | 1 | 24794 | 254.21 | 470 | 461 | 95.7 |
| A | 15 | 174 | 12122 | 121.83 | 470 | 461 | 95.7 |
| A | 9 | 143 | 11146 | 111.63 | 470 | 461 | 95.7 |
| B | 15 | 35 | 111267 | 1221.12 | 470 | 460 | 90.7 |
| B | 0 | 189 | 41598 | 453.35 | 470 | 460 | 90.7 |
| B | 0 | 214 | 10731 | 113.19 | 470 | 460 | 90.7 |
| C | 14 | 238 | 68823 | 649.45 | 446 | 449 | 105.3 |
| C | 3 | 233 | 47618 | 448.03 | 446 | 449 | 105.3 |
| C | 7 | 247 | 18859 | 174.87 | 446 | 449 | 105.3 |
| D | 1 | 52 | 85299 | 766.27 | 452 | 439 | 110.7 |
| D | 2 | 16 | 77754 | 698.14 | 452 | 439 | 110.7 |
| D | 5 | 222 | 66495 | 596.47 | 452 | 439 | 110.7 |
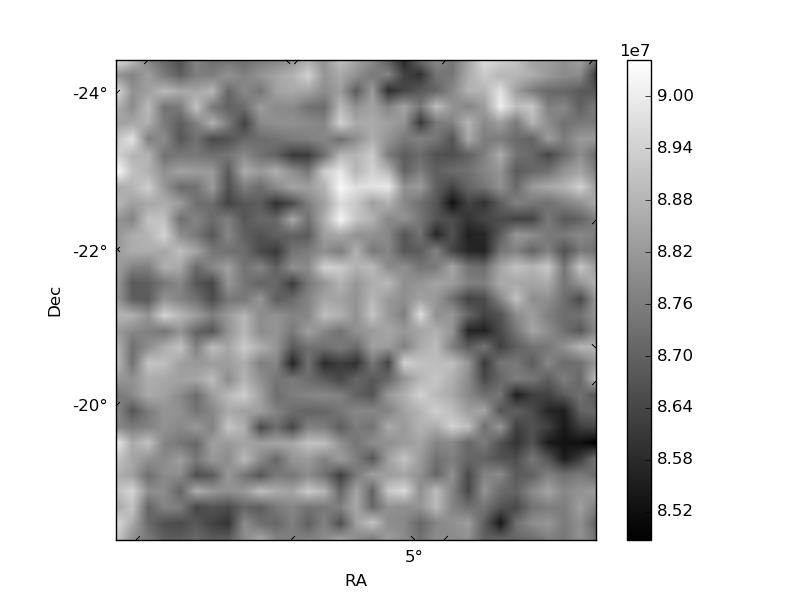
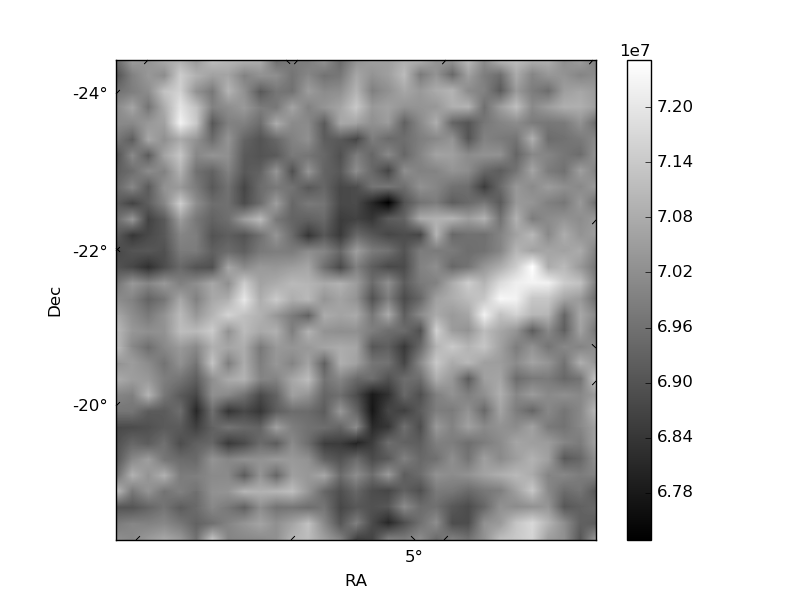
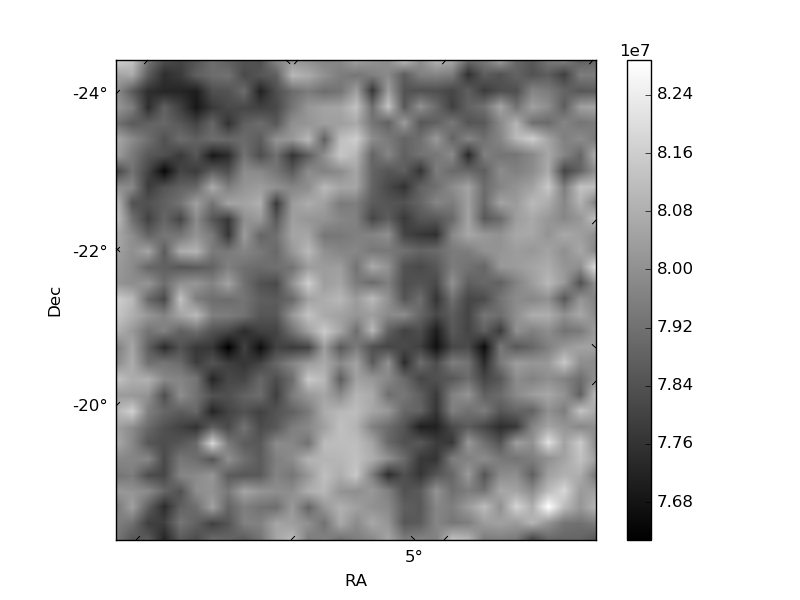
Histogram calculated using DETX and DETY for each event in the final _common_clean file
| Quadrant A | 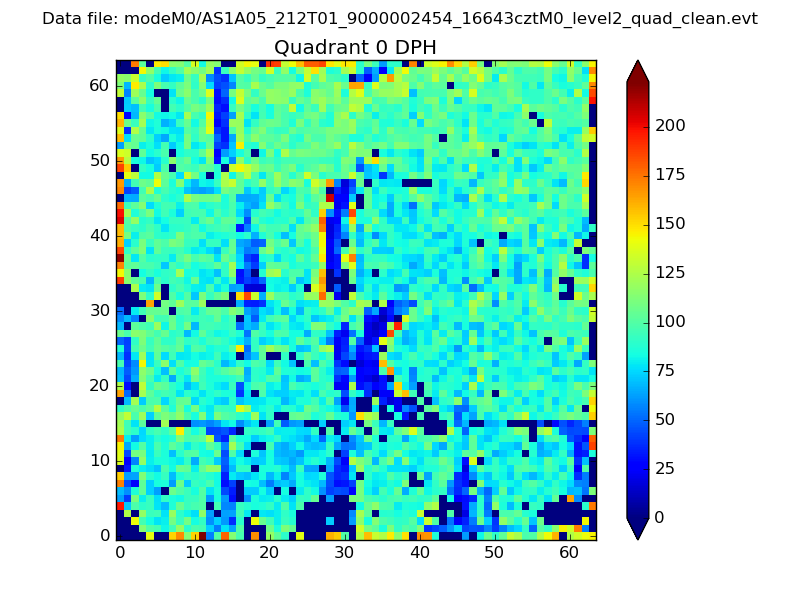 |
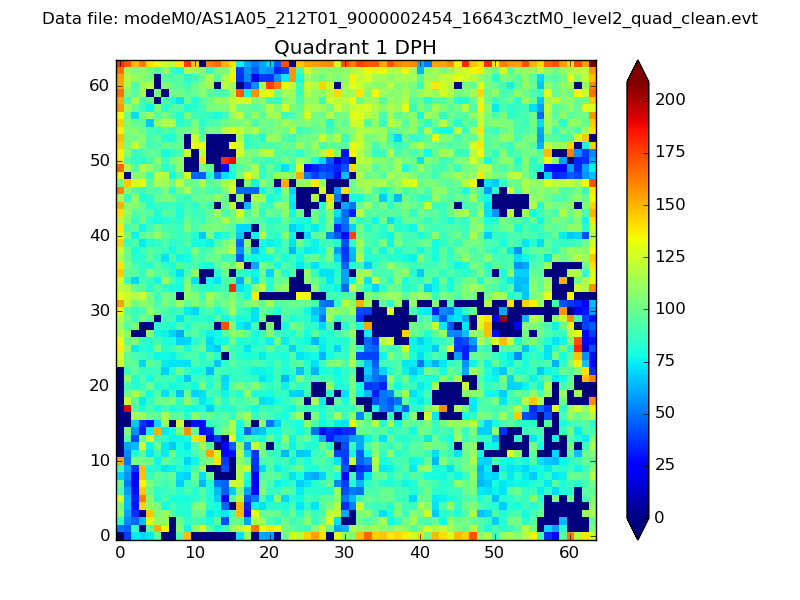 |
Quadrant B |
|---|---|---|---|
| Quadrant D | 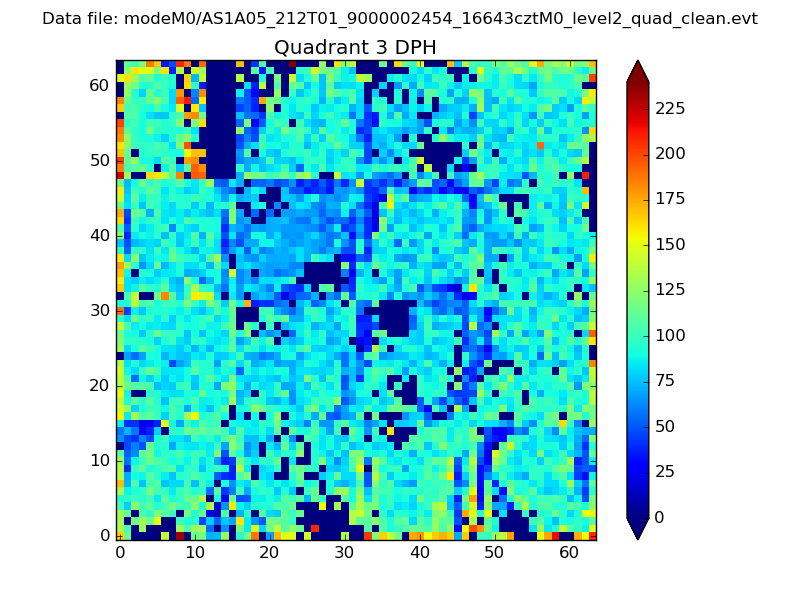 |
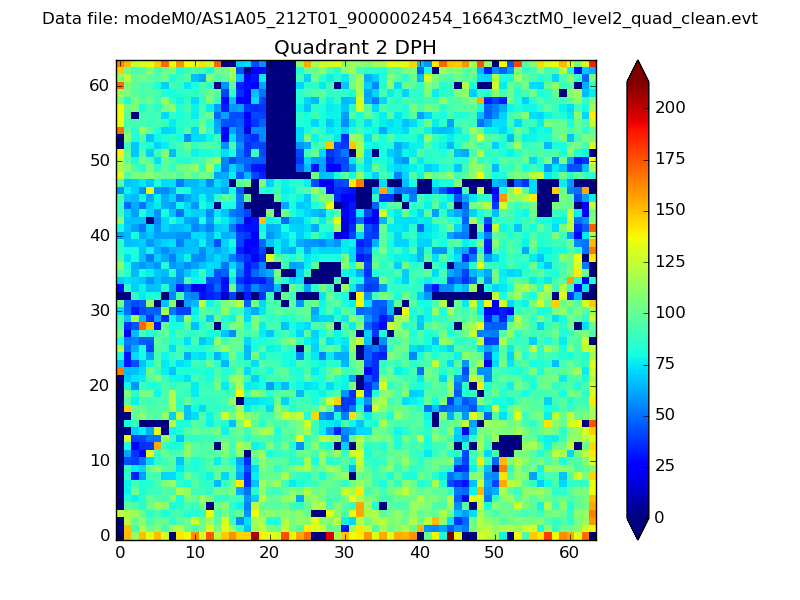 |
Quadrant C |
| Plot type | Count rate plots | Images |
|---|---|---|
| Comparison with Poisson distribution Blue bars denote a histogram of data divided into 1 sec bins. Red curve is a Poisson curve with rate = median count rate of data. |
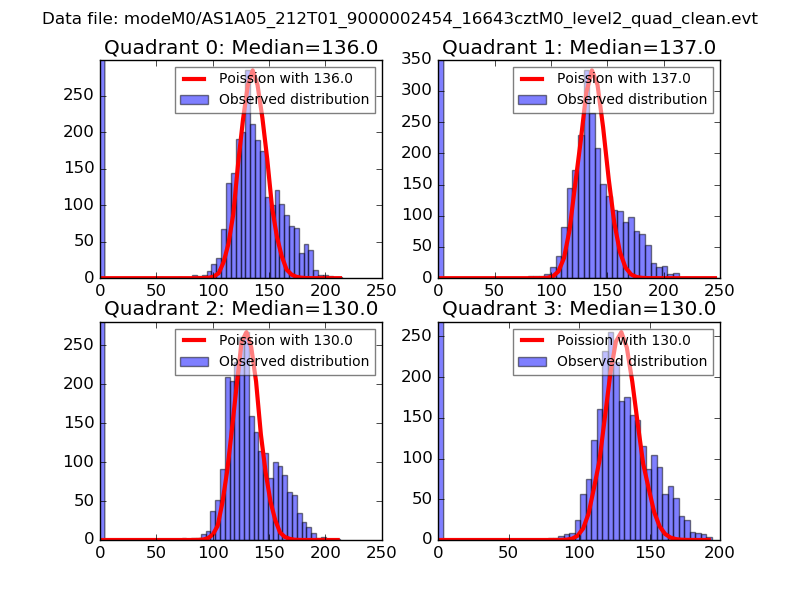 |
 |
| Quadrant-wise count rates Data is divided into 100 sec bins |
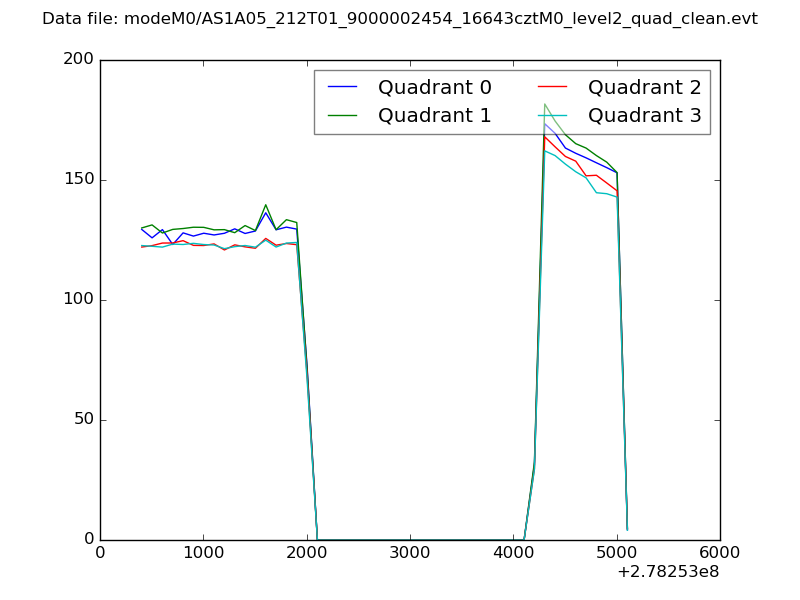 |
|
| Module-wise count rates for Quadrant A Data is divided into 100 sec bins |
 |
 |
| Module-wise count rates for Quadrant B Data is divided into 100 sec bins |
 |
 |
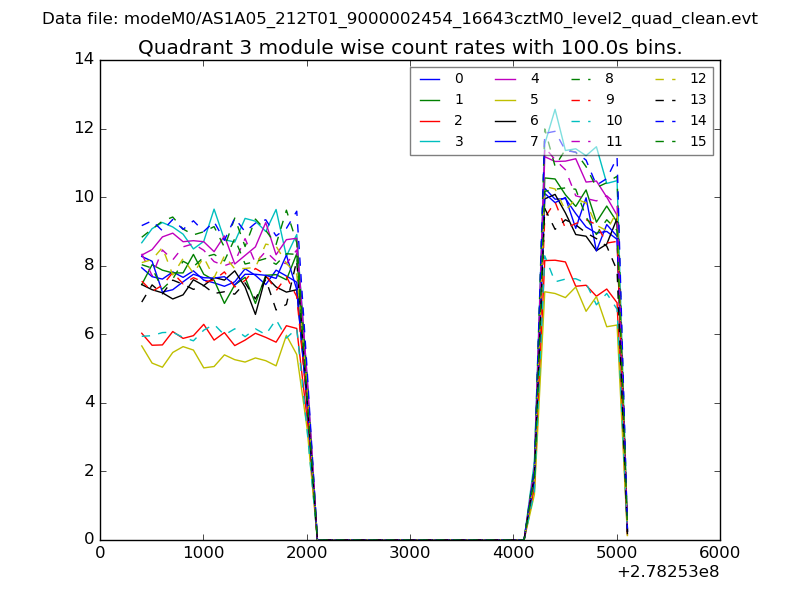
| Module-wise count rates for Quadrant C Data is divided into 100 sec bins |
 |
 |
| Module-wise count rates for Quadrant D Data is divided into 100 sec bins |
 |
 |
| Parameter | Plot |
|---|---|
| CZT HV Monitor |  |
| D_VDD | 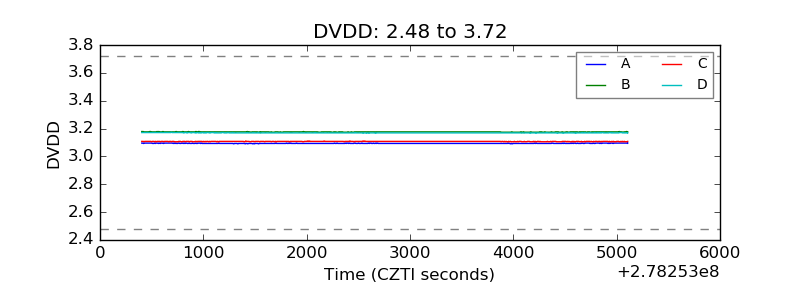 |
| Temperature 1 | 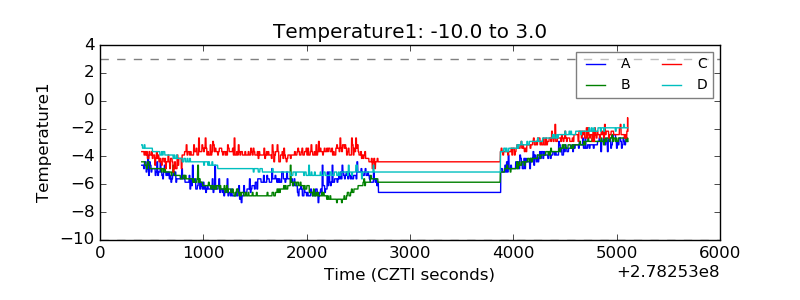 |
| Veto HV Monitor | 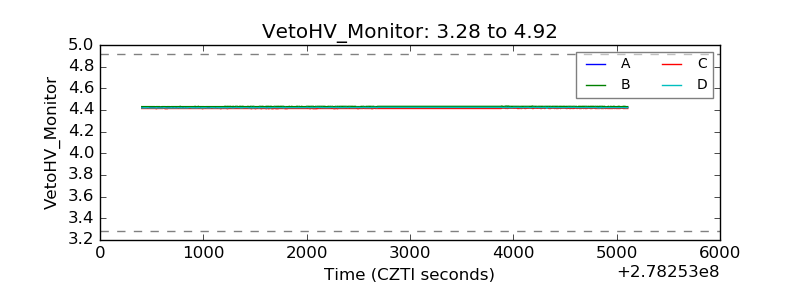 |
| Veto LLD | 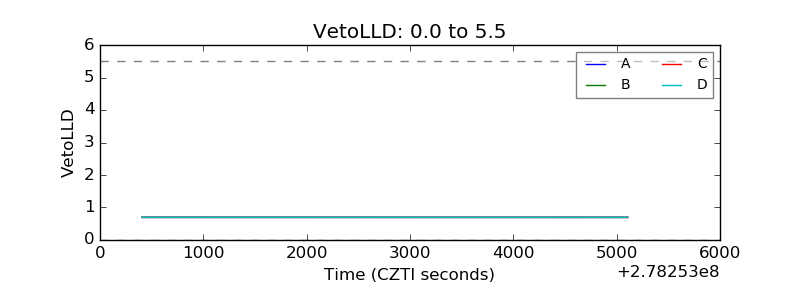 |
| Alpha Counter | 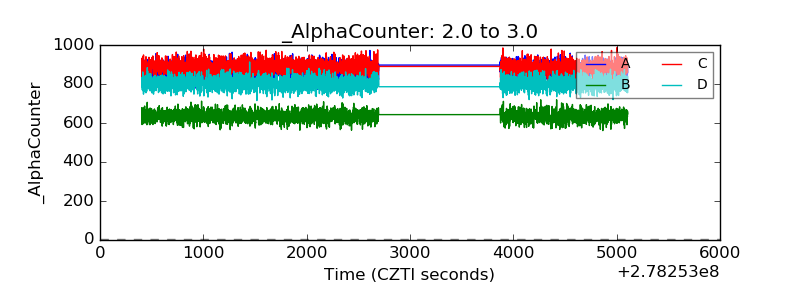 |
| _CPM_Rate | 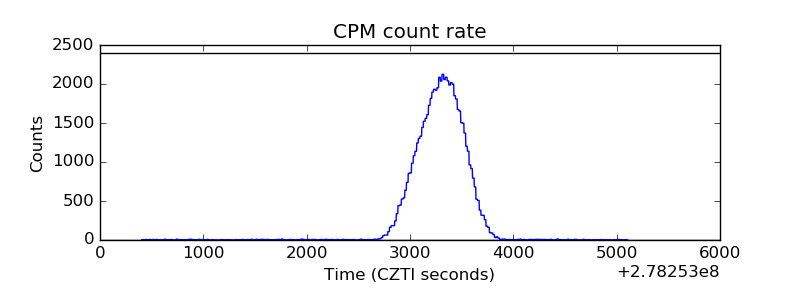 |
| CZT Counter | 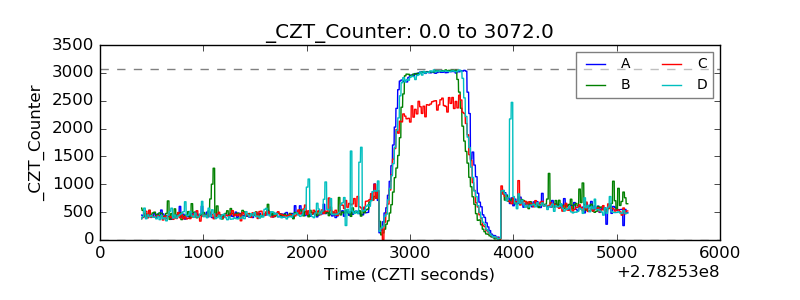 |
| +2.5 Volts monitor | 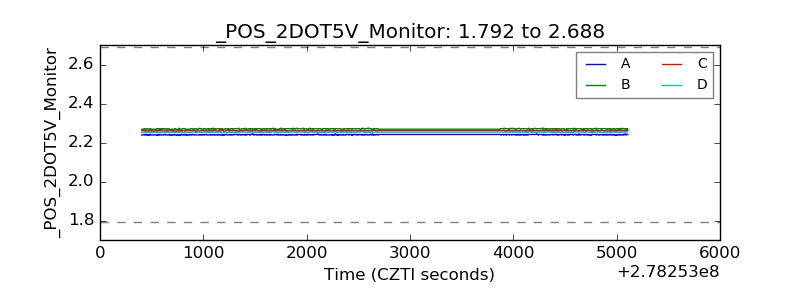 |
| +5 Volts monitor |  |
| _ROLL_ROT | 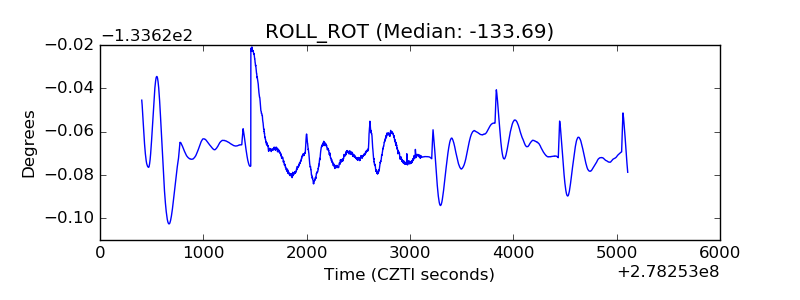 |
| _Roll_DEC | 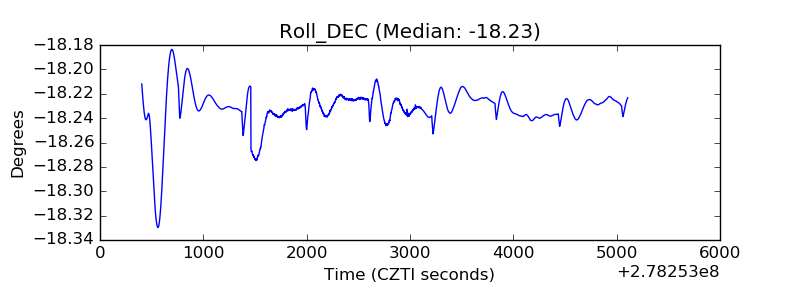 |
| _Roll_RA | 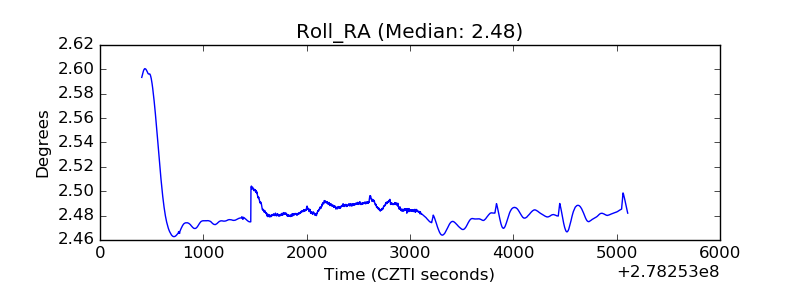 |
| Veto Counter |  |