| Param | Original file | Final file |
|---|---|---|
| Filename | modeM0/AS1A05_212T01_9000002454_16644cztM0_level2.evt | modeM0/AS1A05_212T01_9000002454_16644cztM0_level2_quad_clean.evt |
| Size (bytes) | 280,918,080 | 74,747,520 |
| Size | 267.9 MB | 71.3 MB |
| Events in quadrant A | 1,972,322 | 504,051 |
| Events in quadrant B | 2,257,439 | 513,894 |
| Events in quadrant C | 2,008,300 | 481,313 |
| Events in quadrant D | 1,989,029 | 474,760 |
| Mode SS | |||
|---|---|---|---|
| Quadrant | BADHDUFLAG | Total packets | Discarded packets |
| A | 0 | 82 | 0 |
| B | 0 | 82 | 0 |
| C | 0 | 82 | 0 |
| D | 0 | 82 | 0 |
| Mode M0 | |||
|---|---|---|---|
| Quadrant | BADHDUFLAG | Total packets | Discarded packets |
| A | 0 | 8463 | 0 |
| B | 0 | 9381 | 0 |
| C | 0 | 8518 | 0 |
| D | 0 | 8601 | 0 |
| Quadrant | Total seconds | Saturated seconds | Saturation percentage |
|---|---|---|---|
| A | 4108 | 4 | 0.097371% |
| B | 4108 | 17 | 0.413827% |
| C | 4108 | 16 | 0.389484% |
| D | 4108 | 9 | 0.219085% |
Noise dominated data is calculated using 1-second bins in cleaned event files. If a bin has >2000 counts, and if more than 50% of those come from <1% of pixels, then it is considered to be noise-dominated and hence unusable.
| Quadrant | # 1 sec bins | Bins with >0 counts | Bins with >2000 counts | High rate bins dominated by noise | Noise dominated (total time) | Noise dominated (detector-on time) | Marked lightcurve |
|---|---|---|---|---|---|---|---|
| A | 4109 | 4109 | 0 | 0 | 0.00% | 0.00% | 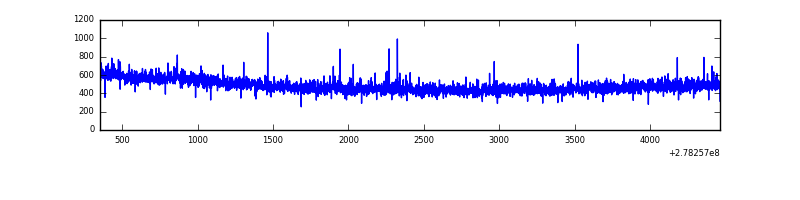 |
| B | 4109 | 4109 | 4 | 4 | 0.10% | 0.10% | 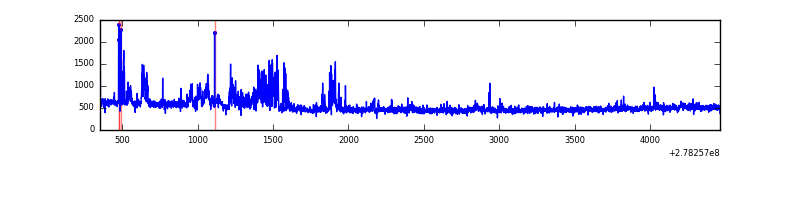 |
| C | 4109 | 4109 | 0 | 0 | 0.00% | 0.00% | 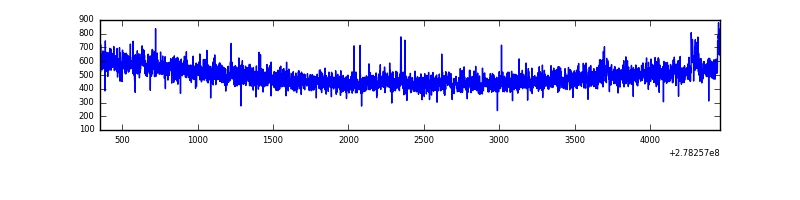 |
| D | 4109 | 4109 | 3 | 3 | 0.07% | 0.07% | 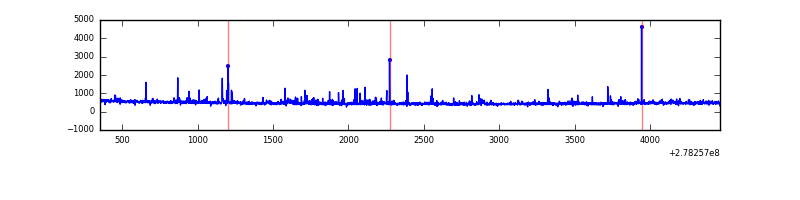 |
Top three noisy pixels from each quadrant. If the there are fewer than three noisy pixels in the level2.evt file, extra rows are filled as -1
| Pixel properties | Quadrant properties | ||||||
|---|---|---|---|---|---|---|---|
| Quadrant | DetID | PixID | Counts | Sigma | Mean | Median | Sigma |
| A | 3 | 1 | 9663 | 89.36 | 509 | 500 | 102.5 |
| A | 0 | 226 | 4517 | 39.18 | 509 | 500 | 102.5 |
| A | 12 | 194 | 3685 | 31.06 | 509 | 500 | 102.5 |
| B | 15 | 35 | 200480 | 2087.34 | 507 | 497 | 95.8 |
| B | 0 | 189 | 44616 | 460.5 | 507 | 497 | 95.8 |
| B | 12 | 111 | 10944 | 109.04 | 507 | 497 | 95.8 |
| C | 14 | 238 | 74819 | 670.52 | 477 | 482 | 110.9 |
| C | 3 | 233 | 62473 | 559.16 | 477 | 482 | 110.9 |
| C | 7 | 247 | 10317 | 88.71 | 477 | 482 | 110.9 |
| D | 1 | 52 | 75677 | 628.74 | 487 | 473 | 119.6 |
| D | 5 | 222 | 31313 | 257.83 | 487 | 473 | 119.6 |
| D | 7 | 38 | 21169 | 173.03 | 487 | 473 | 119.6 |
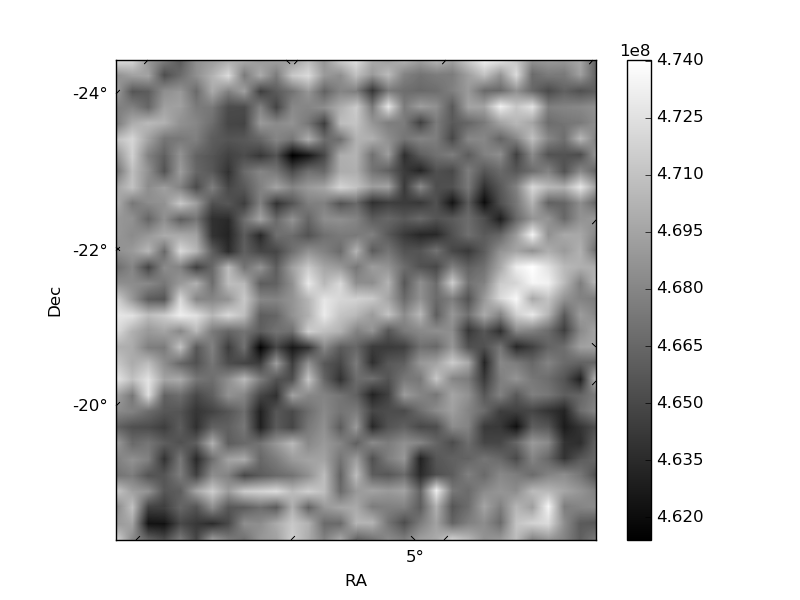
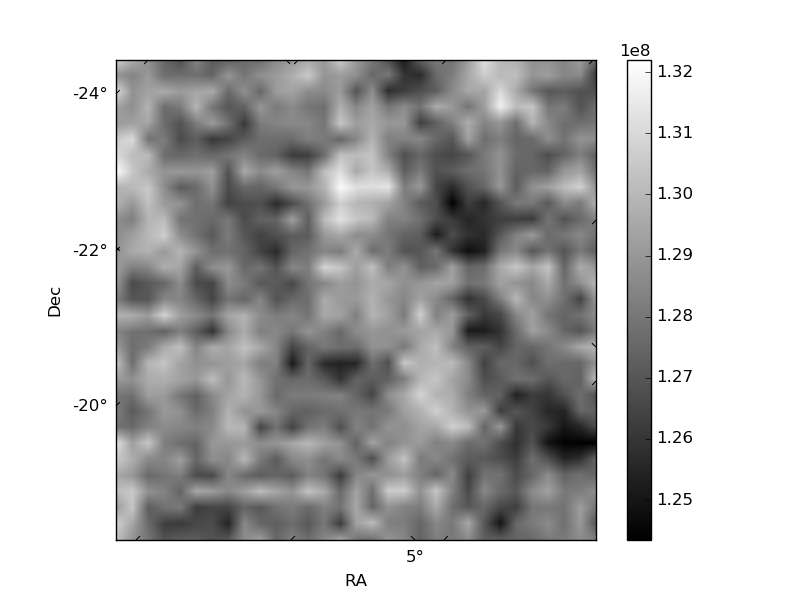
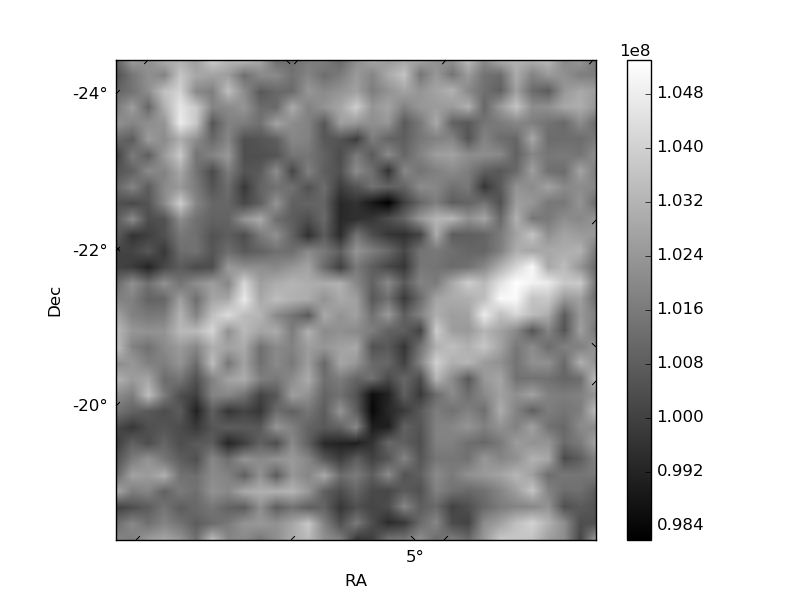
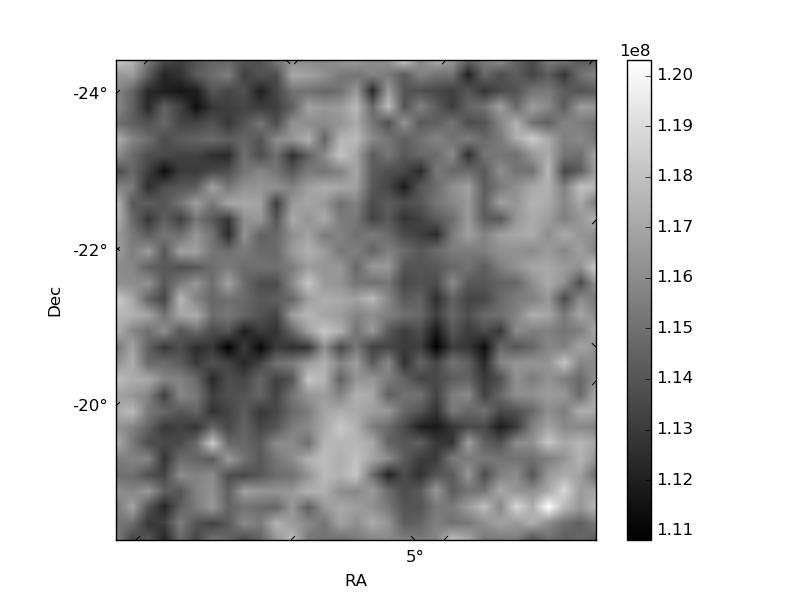
Histogram calculated using DETX and DETY for each event in the final _common_clean file
| Quadrant A |  |
 |
Quadrant B |
|---|---|---|---|
| Quadrant D |  |
 |
Quadrant C |
| Plot type | Count rate plots | Images |
|---|---|---|
| Comparison with Poisson distribution Blue bars denote a histogram of data divided into 1 sec bins. Red curve is a Poisson curve with rate = median count rate of data. |
 |
 |
| Quadrant-wise count rates Data is divided into 100 sec bins |
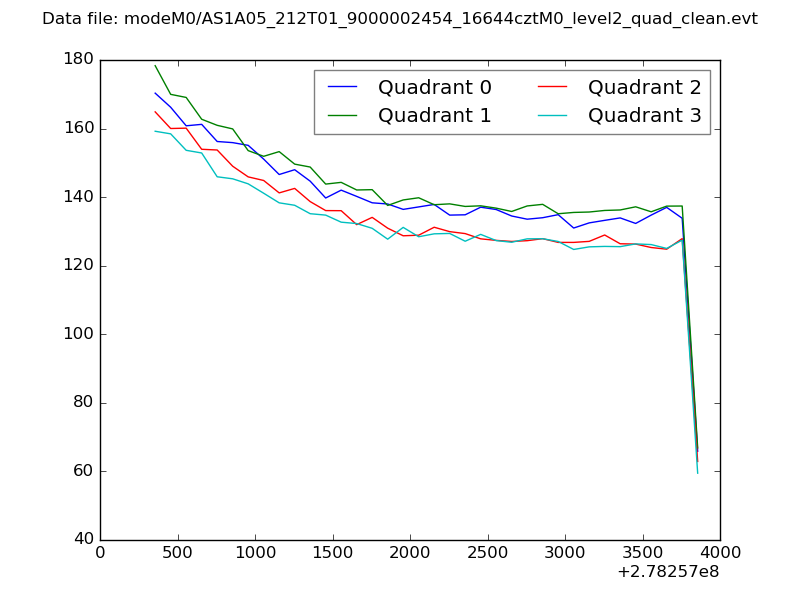 |
|
| Module-wise count rates for Quadrant A Data is divided into 100 sec bins |
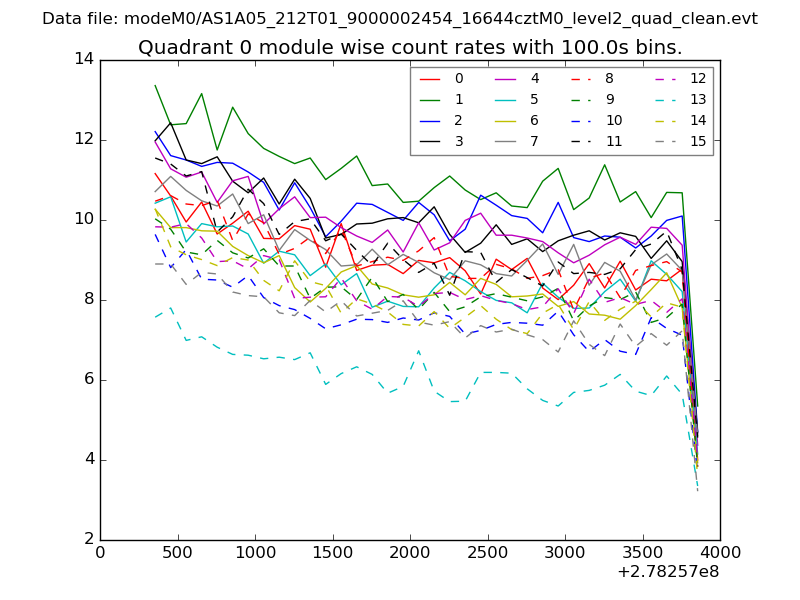 |
 |
| Module-wise count rates for Quadrant B Data is divided into 100 sec bins |
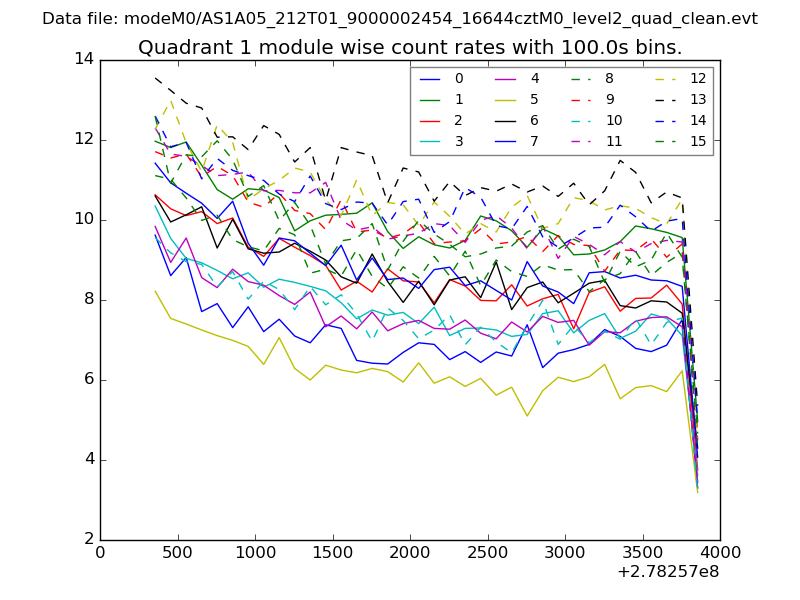 |
 |
| Module-wise count rates for Quadrant C Data is divided into 100 sec bins |
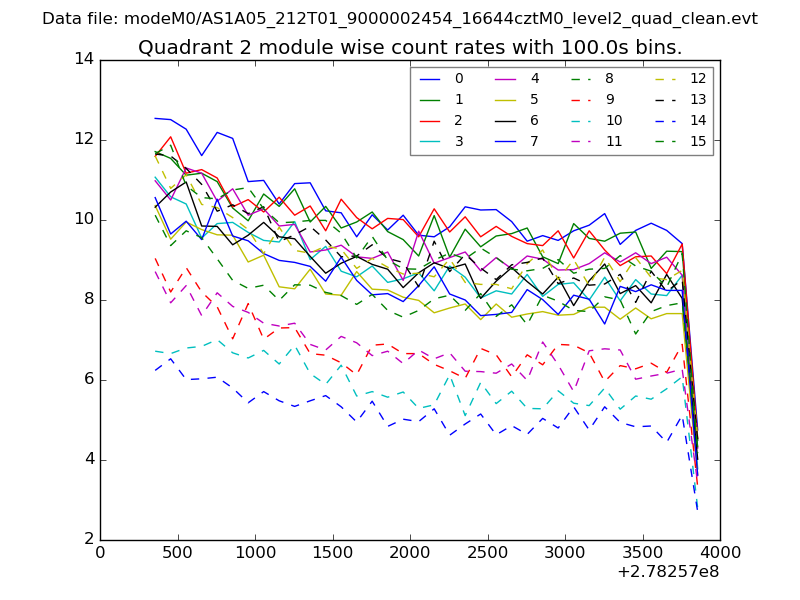 |
 |
| Module-wise count rates for Quadrant D Data is divided into 100 sec bins |
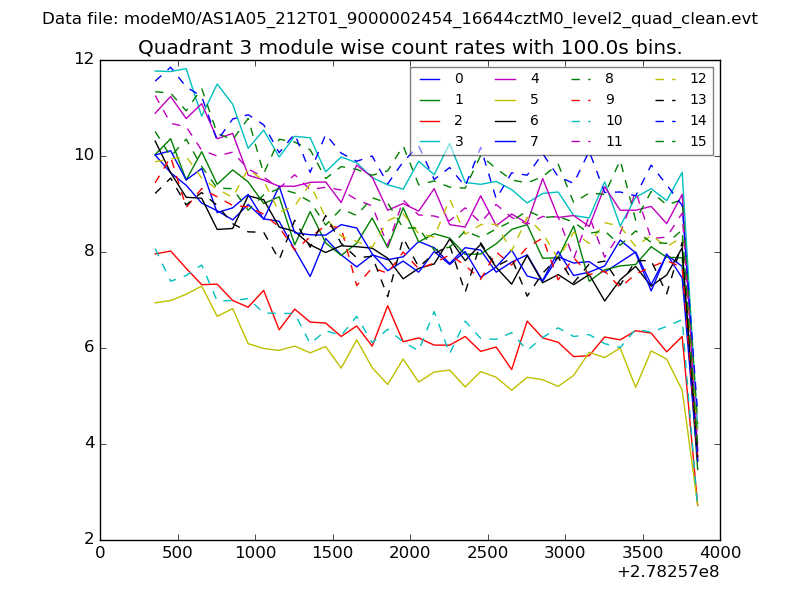 |
 |
| Parameter | Plot |
|---|---|
| CZT HV Monitor |  |
| D_VDD | 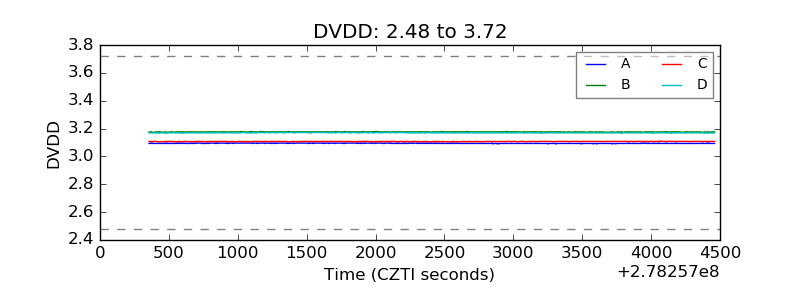 |
| Temperature 1 | 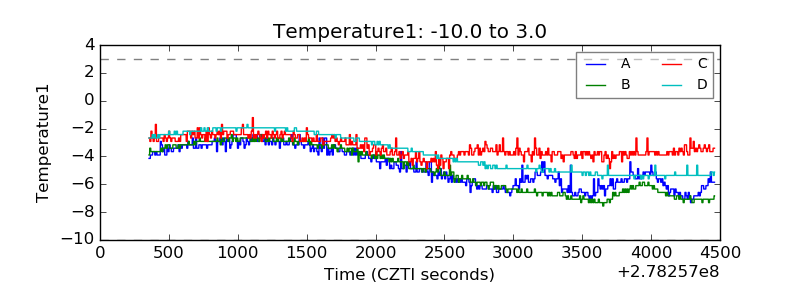 |
| Veto HV Monitor | 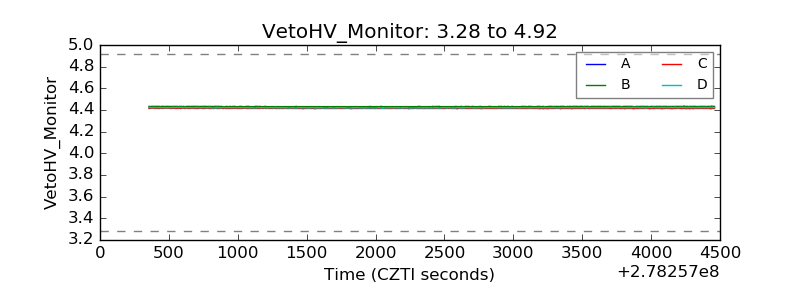 |
| Veto LLD | 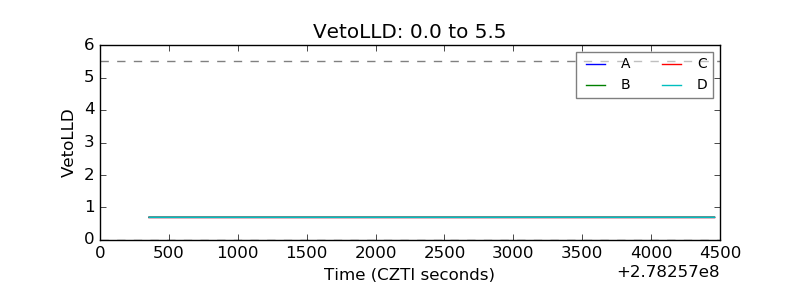 |
| Alpha Counter | 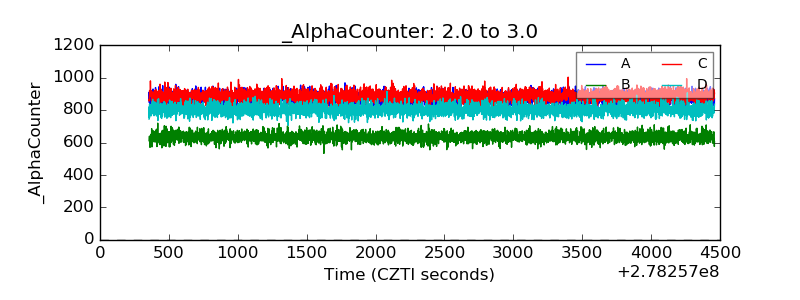 |
| _CPM_Rate | 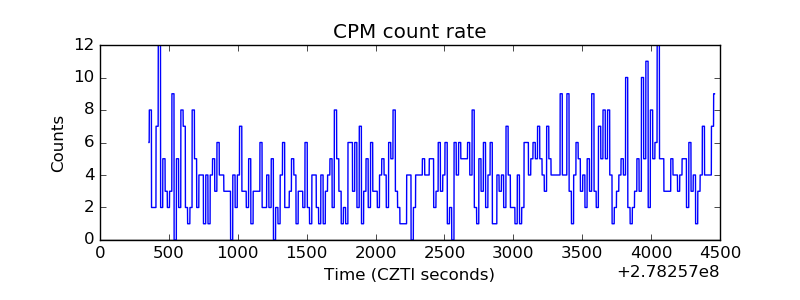 |
| CZT Counter | 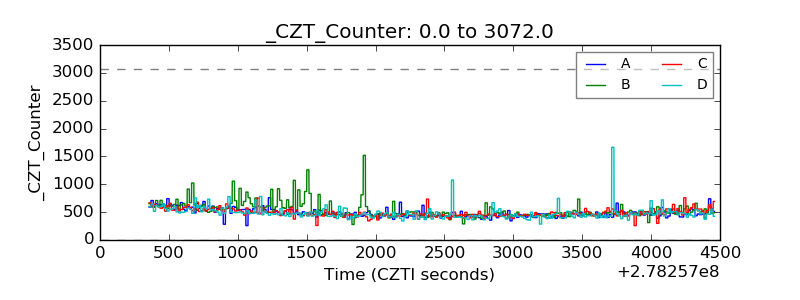 |
| +2.5 Volts monitor |  |
| +5 Volts monitor |  |
| _ROLL_ROT | 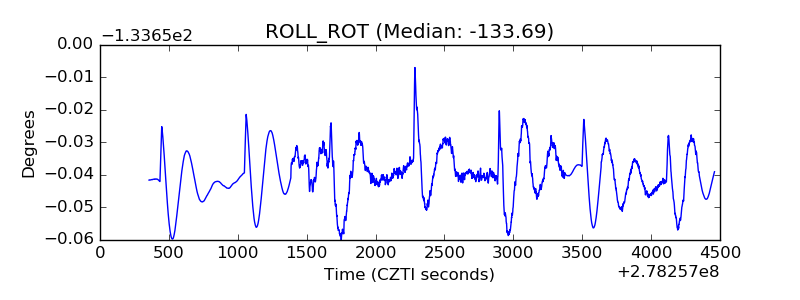 |
| _Roll_DEC | 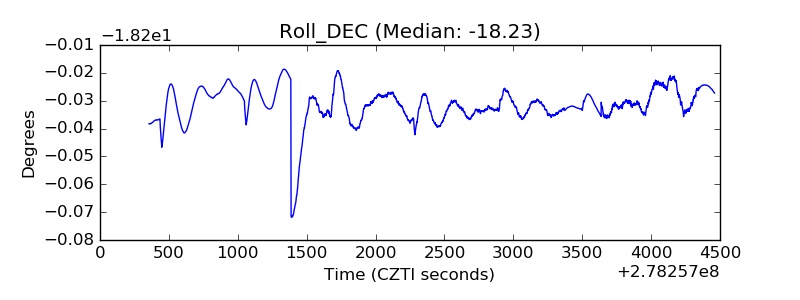 |
| _Roll_RA | 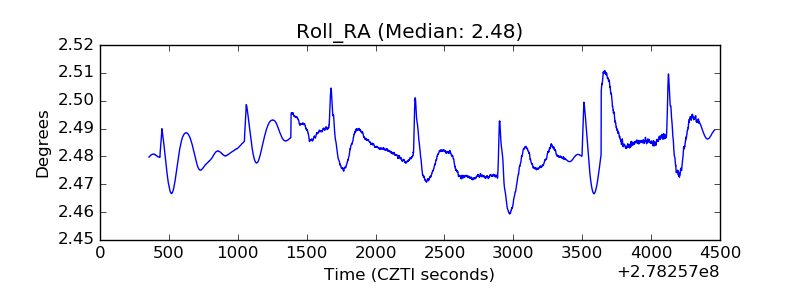 |
| Veto Counter | 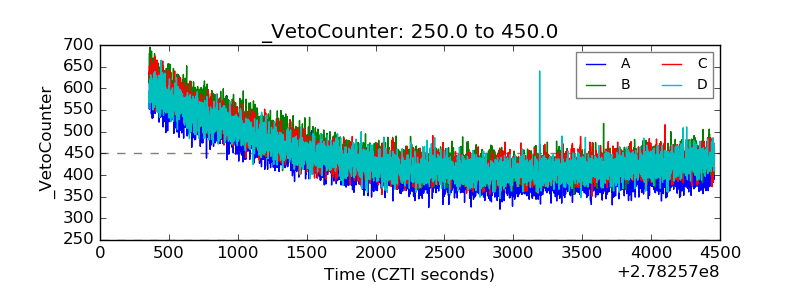 |