| Param | Original file | Final file |
|---|---|---|
| Filename | modeM0/AS1C04_007T07_9000002452cztM0_level2.fits | modeM0/AS1C04_007T07_9000002452cztM0_level2_quad_clean.evt |
| Size (bytes) | 378,089,280 | 394,516,800 |
| Size | 360.6 MB | 376.2 MB |
| Events in quadrant A | 2,280,412 | 2,377,576 |
| Events in quadrant B | 2,214,302 | 2,420,167 |
| Events in quadrant C | 2,196,244 | 2,216,082 |
| Events in quadrant D | 1,967,946 | 2,144,035 |
| Mode M9 | |||
|---|---|---|---|
| Quadrant | BADHDUFLAG | Total packets | Discarded packets |
| A | 0 | 42 | 0 |
| B | 0 | 42 | 0 |
| C | 0 | 42 | 0 |
| D | 0 | 42 | 0 |
| Mode SS | |||
|---|---|---|---|
| Quadrant | BADHDUFLAG | Total packets | Discarded packets |
| A | 0 | 826 | 0 |
| B | 0 | 826 | 0 |
| C | 0 | 826 | 0 |
| D | 0 | 826 | 0 |
| Mode M0 | |||
|---|---|---|---|
| Quadrant | BADHDUFLAG | Total packets | Discarded packets |
| A | 0 | 90779 | 0 |
| B | 0 | 88420 | 0 |
| C | 0 | 100275 | 0 |
| D | 0 | 100326 | 0 |
| Quadrant | Total seconds | Saturated seconds | Saturation percentage |
|---|---|---|---|
| A | 40636 | 1119 | 2.753716% |
| B | 40636 | 648 | 1.594645% |
| C | 40636 | 2599 | 6.395807% |
| D | 40636 | 1034 | 2.544542% |
Noise dominated data is calculated using 1-second bins in cleaned event files. If a bin has >2000 counts, and if more than 50% of those come from <1% of pixels, then it is considered to be noise-dominated and hence unusable.
| Quadrant | # 1 sec bins | Bins with >0 counts | Bins with >2000 counts | High rate bins dominated by noise | Noise dominated (total time) | Noise dominated (detector-on time) | Marked lightcurve |
|---|---|---|---|---|---|---|---|
| A | 44881 | 40635 | 0 | 0 | 0.00% | 0.00% | 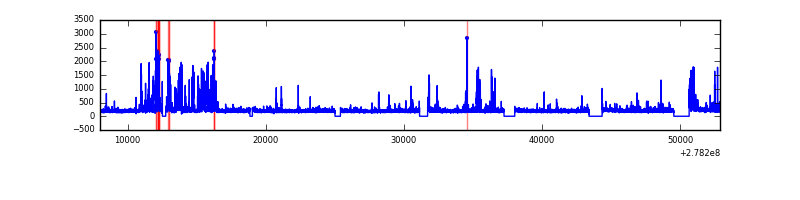 |
| B | 44881 | 40636 | 0 | 0 | 0.00% | 0.00% |  |
| C | 44881 | 40633 | 0 | 0 | 0.00% | 0.00% | 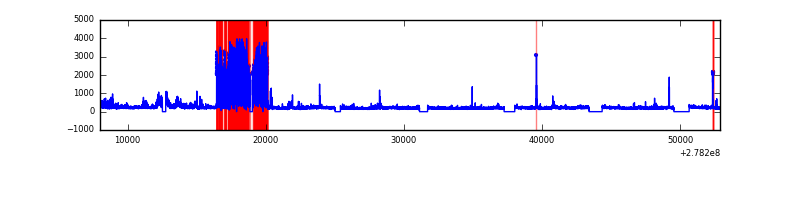 |
| D | 44881 | 40632 | 0 | 0 | 0.00% | 0.00% |  |
Top three noisy pixels from each quadrant. If the there are fewer than three noisy pixels in the level2.evt file, extra rows are filled as -1
| Pixel properties | Quadrant properties | ||||||
|---|---|---|---|---|---|---|---|
| Quadrant | DetID | PixID | Counts | Sigma | Mean | Median | Sigma |
| A | 0 | 29 | 2198 | 11.02 | 593 | 552 | 149.3 |
| A | 7 | 110 | 1832 | 8.57 | 593 | 552 | 149.3 |
| A | 0 | 30 | 1750 | 8.02 | 593 | 552 | 149.3 |
| B | 2 | 9 | 1851 | 10.78 | 585 | 554 | 120.3 |
| B | 2 | 8 | 1533 | 8.14 | 585 | 554 | 120.3 |
| B | 3 | 17 | 1485 | 7.74 | 585 | 554 | 120.3 |
| C | 12 | 241 | 1607 | 7.08 | 580 | 538 | 151.0 |
| C | 3 | 126 | 1477 | 6.22 | 580 | 538 | 151.0 |
| C | 3 | 158 | 1458 | 6.09 | 580 | 538 | 151.0 |
| D | 3 | 14 | 1508 | 6.59 | 562 | 512 | 151.2 |
| D | 6 | 231 | 1447 | 6.19 | 562 | 512 | 151.2 |
| D | 7 | 3 | 1436 | 6.11 | 562 | 512 | 151.2 |
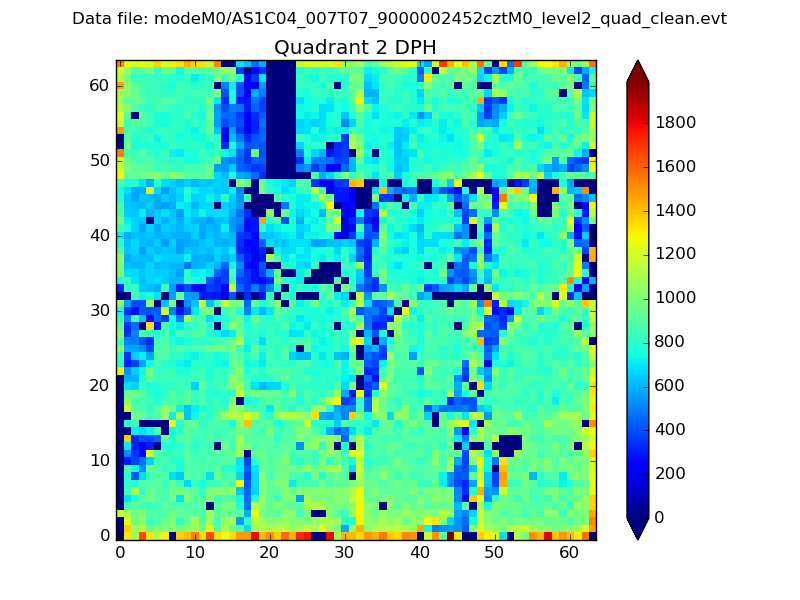
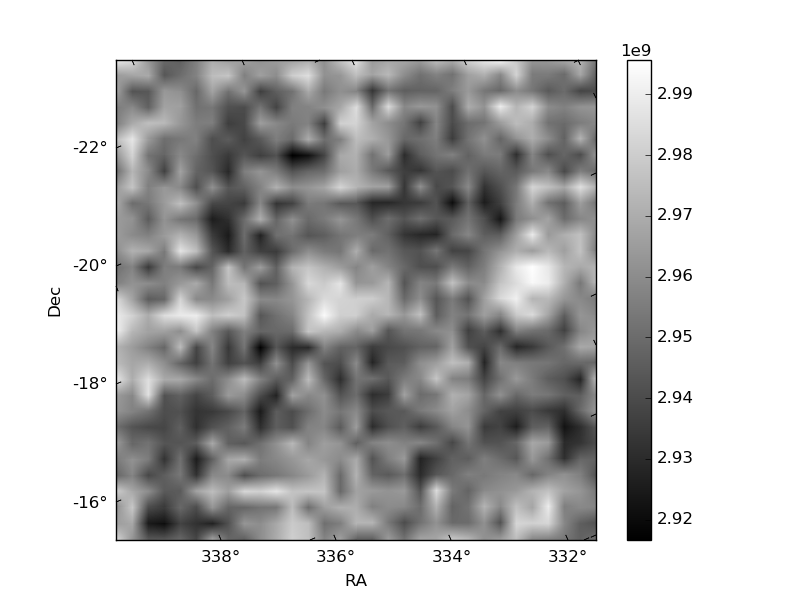
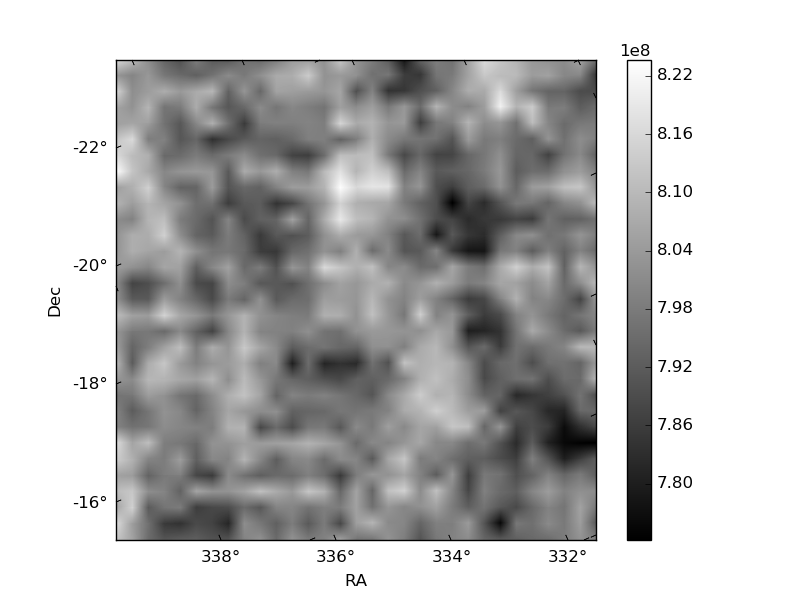
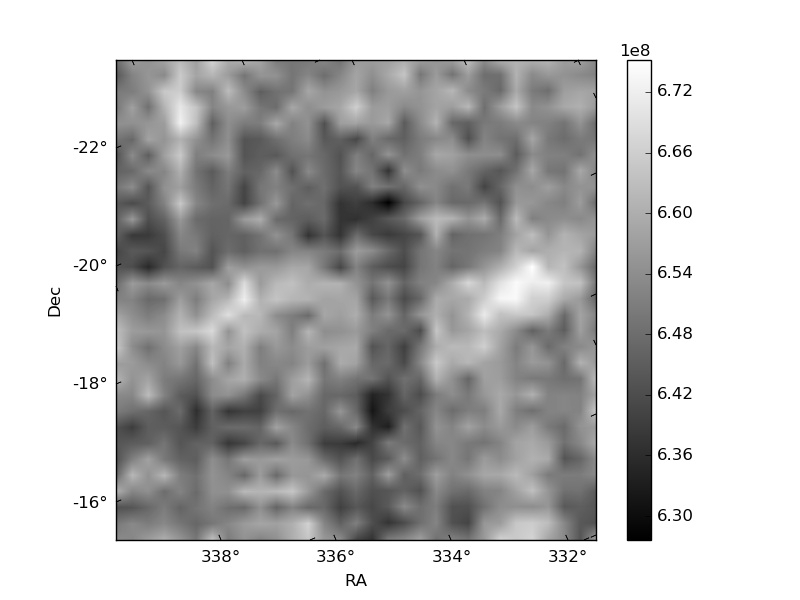
Histogram calculated using DETX and DETY for each event in the final _common_clean file
| Quadrant A |  |
 |
Quadrant B |
|---|---|---|---|
| Quadrant D | 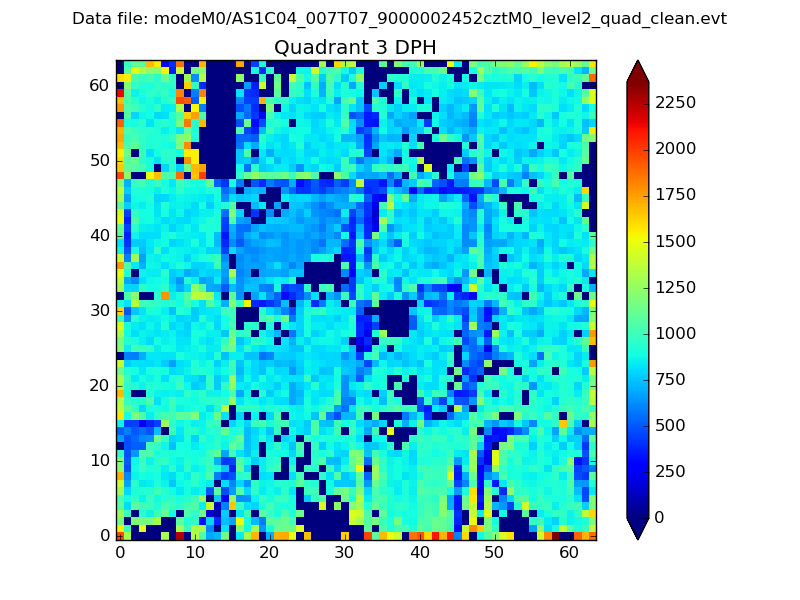 |
 |
Quadrant C |
| Plot type | Count rate plots | Images |
|---|---|---|
| Comparison with Poisson distribution Blue bars denote a histogram of data divided into 1 sec bins. Red curve is a Poisson curve with rate = median count rate of data. |
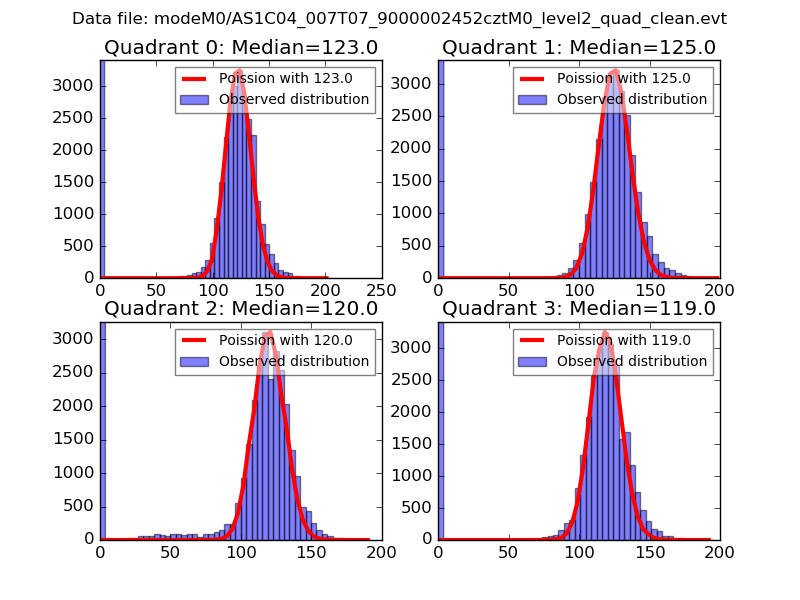 |
 |
| Quadrant-wise count rates Data is divided into 100 sec bins |
 |
|
| Module-wise count rates for Quadrant A Data is divided into 100 sec bins |
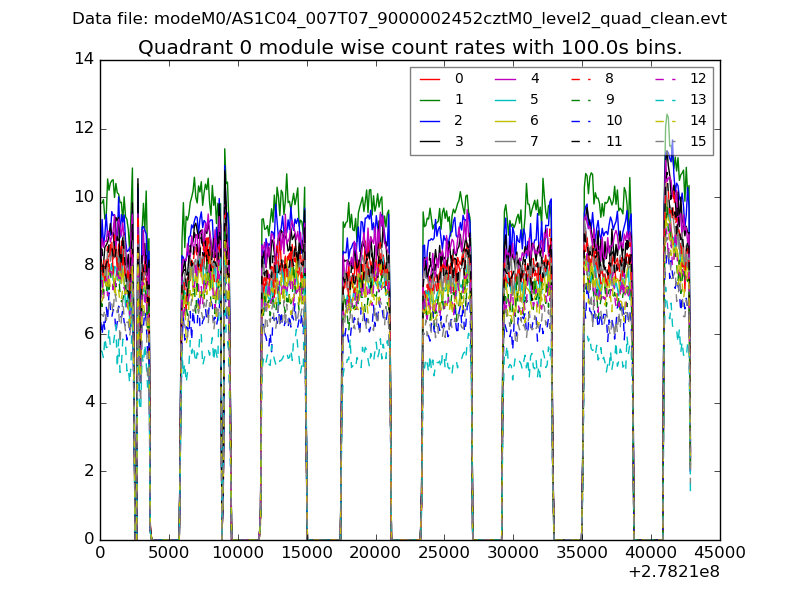 |
 |
| Module-wise count rates for Quadrant B Data is divided into 100 sec bins |
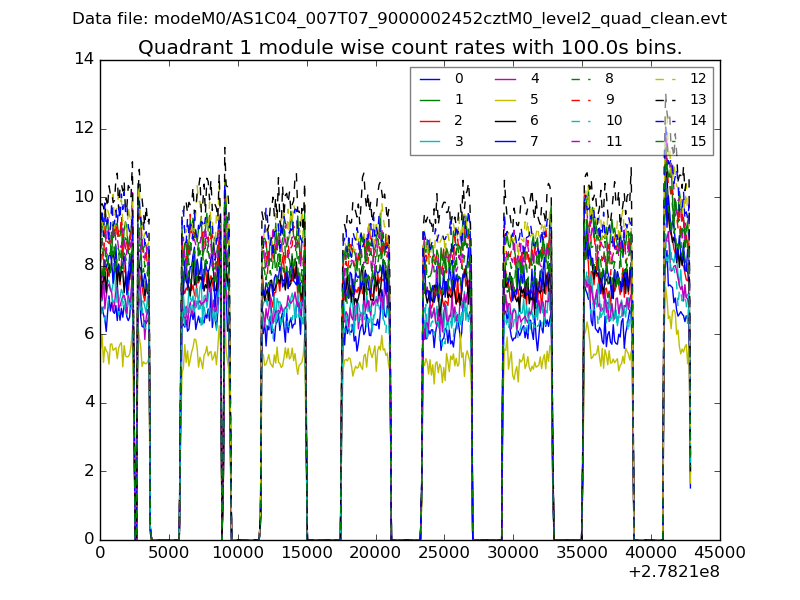 |
 |
| Module-wise count rates for Quadrant C Data is divided into 100 sec bins |
 |
 |
| Module-wise count rates for Quadrant D Data is divided into 100 sec bins |
 |
 |
| Parameter | Plot |
|---|---|
| CZT HV Monitor |  |
| D_VDD |  |
| Temperature 1 |  |
| Veto HV Monitor |  |
| Veto LLD |  |
| Alpha Counter | 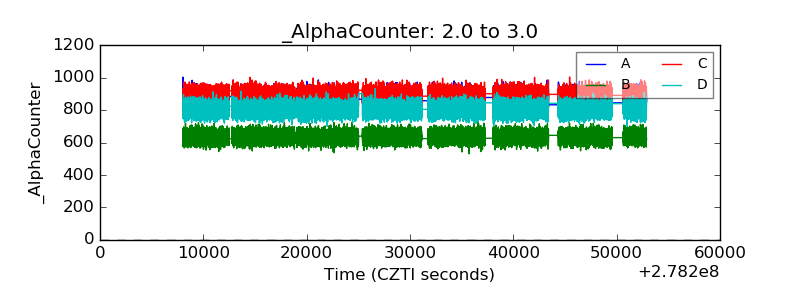 |
| _CPM_Rate |  |
| CZT Counter | 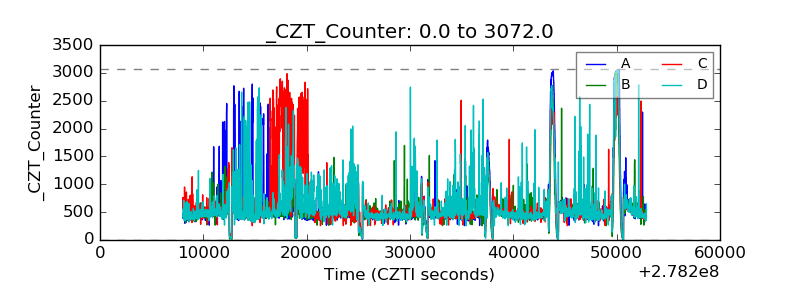 |
| +2.5 Volts monitor |  |
| +5 Volts monitor | 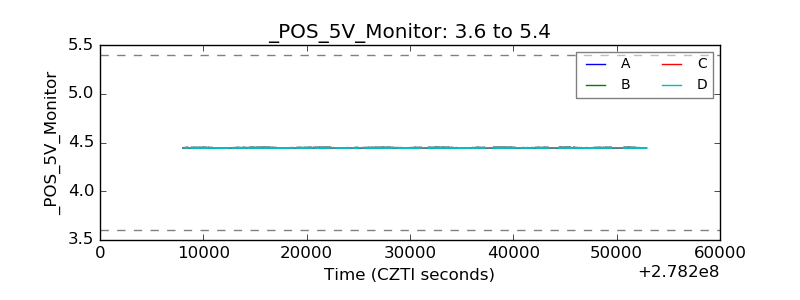 |
| _ROLL_ROT | 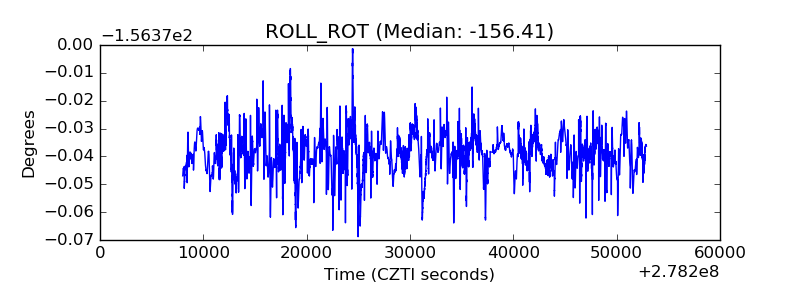 |
| _Roll_DEC | 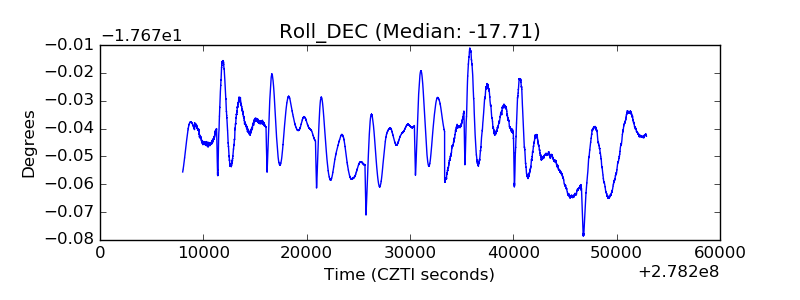 |
| _Roll_RA | 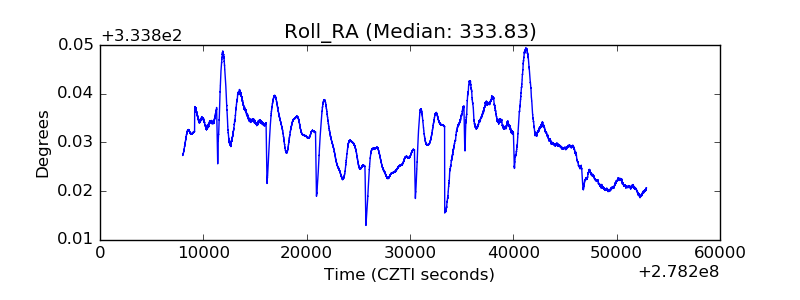 |
| Veto Counter |  |