| Param | Original file | Final file |
|---|---|---|
| Filename | modeM0/AS1C04_007T07_9000002452_16635cztM0_level2.evt | modeM0/AS1C04_007T07_9000002452_16635cztM0_level2_quad_clean.evt |
| Size (bytes) | 486,025,920 | 69,428,160 |
| Size | 463.5 MB | 66.2 MB |
| Events in quadrant A | 3,974,895 | 409,880 |
| Events in quadrant B | 3,154,769 | 432,363 |
| Events in quadrant C | 3,707,329 | 416,629 |
| Events in quadrant D | 3,465,956 | 414,873 |
| Mode M9 | |||
|---|---|---|---|
| Quadrant | BADHDUFLAG | Total packets | Discarded packets |
| A | 0 | 2 | 0 |
| B | 0 | 2 | 0 |
| C | 0 | 2 | 0 |
| D | 0 | 2 | 0 |
| Mode SS | |||
|---|---|---|---|
| Quadrant | BADHDUFLAG | Total packets | Discarded packets |
| A | 0 | 124 | 0 |
| B | 0 | 124 | 0 |
| C | 0 | 124 | 0 |
| D | 0 | 124 | 0 |
| Mode M0 | |||
|---|---|---|---|
| Quadrant | BADHDUFLAG | Total packets | Discarded packets |
| A | 0 | 15976 | 2 |
| B | 0 | 13380 | 1 |
| C | 0 | 14746 | 1 |
| D | 0 | 14481 | 1 |
| Quadrant | Total seconds | Saturated seconds | Saturation percentage |
|---|---|---|---|
| A | 6135 | 399 | 6.503667% |
| B | 6135 | 111 | 1.809291% |
| C | 6135 | 182 | 2.966585% |
| D | 6135 | 133 | 2.167889% |
Noise dominated data is calculated using 1-second bins in cleaned event files. If a bin has >2000 counts, and if more than 50% of those come from <1% of pixels, then it is considered to be noise-dominated and hence unusable.
| Quadrant | # 1 sec bins | Bins with >0 counts | Bins with >2000 counts | High rate bins dominated by noise | Noise dominated (total time) | Noise dominated (detector-on time) | Marked lightcurve |
|---|---|---|---|---|---|---|---|
| A | 6381 | 6137 | 250 | 250 | 3.92% | 4.07% | 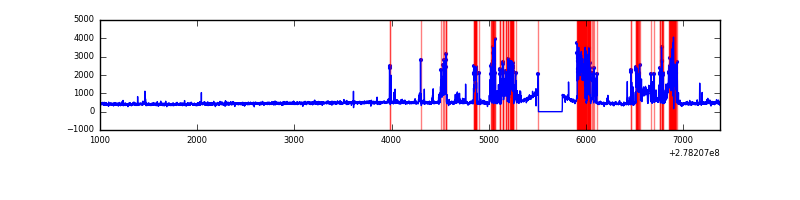 |
| B | 6381 | 6137 | 3 | 3 | 0.05% | 0.05% | 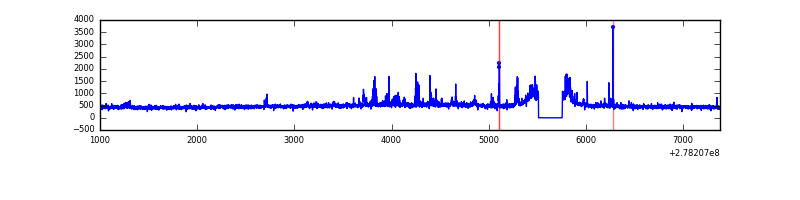 |
| C | 6381 | 6137 | 0 | 0 | 0.00% | 0.00% | 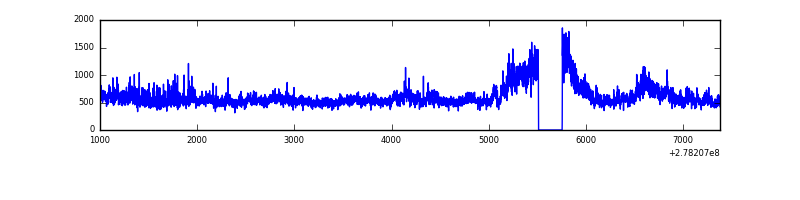 |
| D | 6381 | 6137 | 99 | 99 | 1.55% | 1.61% | 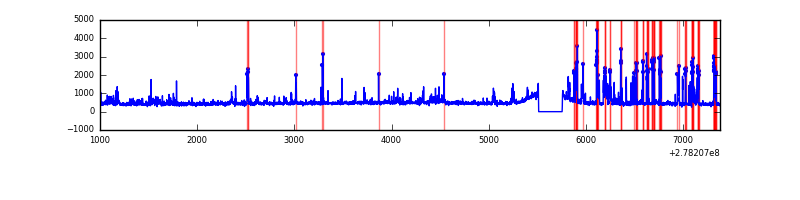 |
Top three noisy pixels from each quadrant. If the there are fewer than three noisy pixels in the level2.evt file, extra rows are filled as -1
| Pixel properties | Quadrant properties | ||||||
|---|---|---|---|---|---|---|---|
| Quadrant | DetID | PixID | Counts | Sigma | Mean | Median | Sigma |
| A | 15 | 174 | 1198898 | 8155.91 | 720 | 705 | 146.9 |
| A | 0 | 226 | 6398 | 38.75 | 720 | 705 | 146.9 |
| A | 12 | 194 | 5281 | 31.14 | 720 | 705 | 146.9 |
| B | 15 | 35 | 122357 | 843.59 | 737 | 718 | 144.2 |
| B | 0 | 198 | 46047 | 314.36 | 737 | 718 | 144.2 |
| B | 0 | 229 | 26332 | 177.64 | 737 | 718 | 144.2 |
| C | 3 | 233 | 776432 | 4632.73 | 705 | 710 | 167.4 |
| C | 14 | 238 | 108515 | 643.83 | 705 | 710 | 167.4 |
| C | 7 | 247 | 76590 | 453.17 | 705 | 710 | 167.4 |
| D | 1 | 52 | 667464 | 3753.68 | 718 | 698 | 177.6 |
| D | 5 | 222 | 54379 | 302.21 | 718 | 698 | 177.6 |
| D | 2 | 234 | 25620 | 140.3 | 718 | 698 | 177.6 |
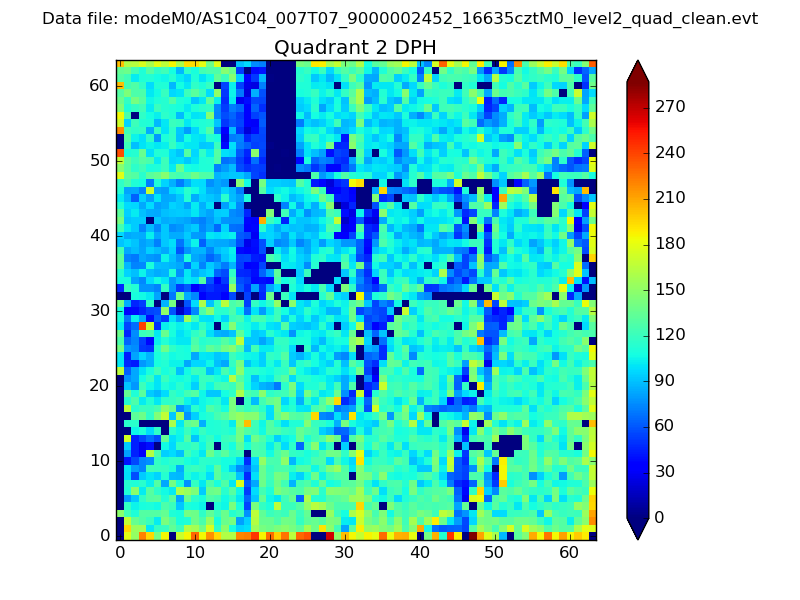
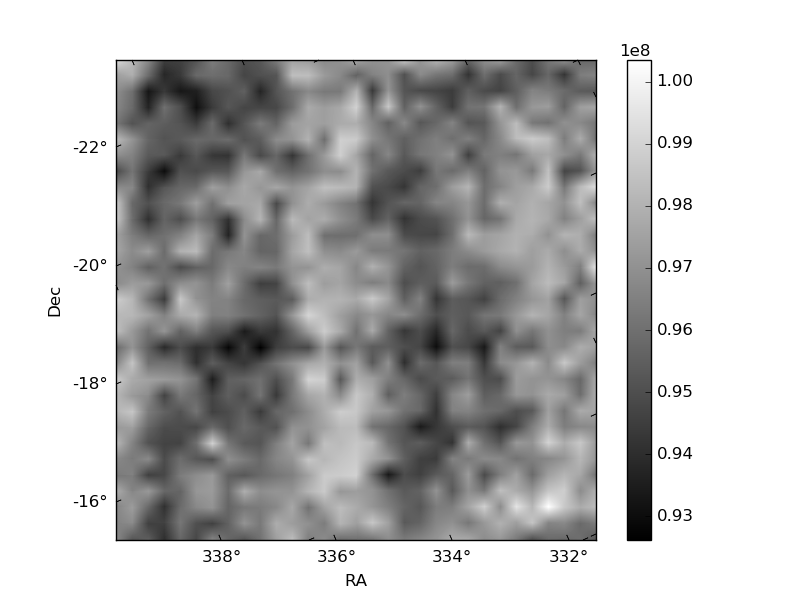
Histogram calculated using DETX and DETY for each event in the final _common_clean file
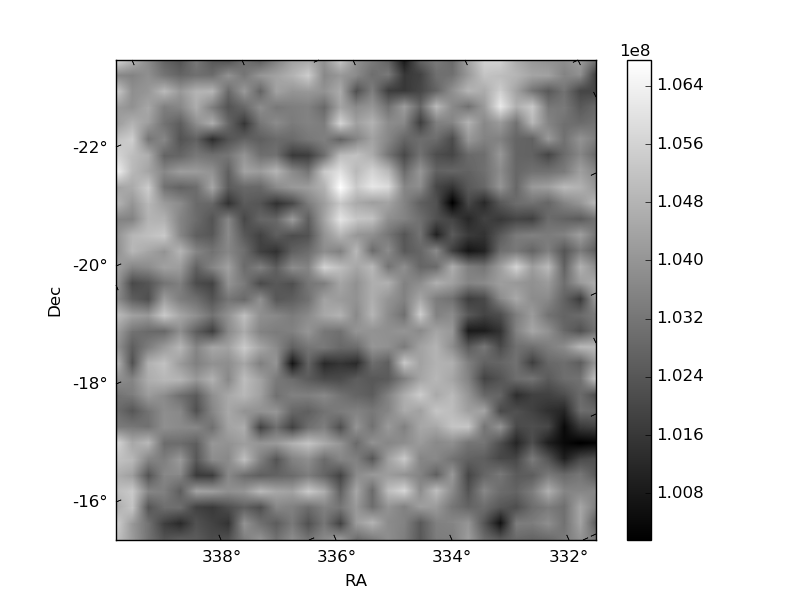
| Quadrant A | 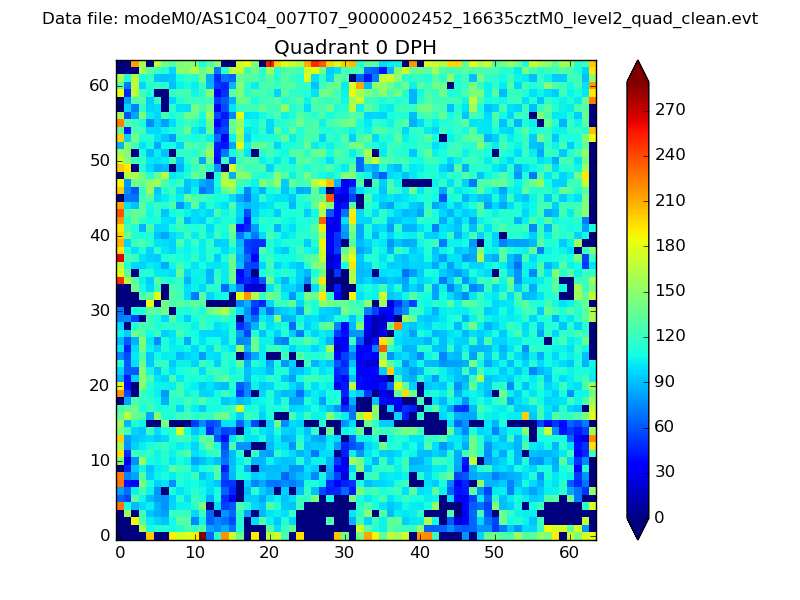 |
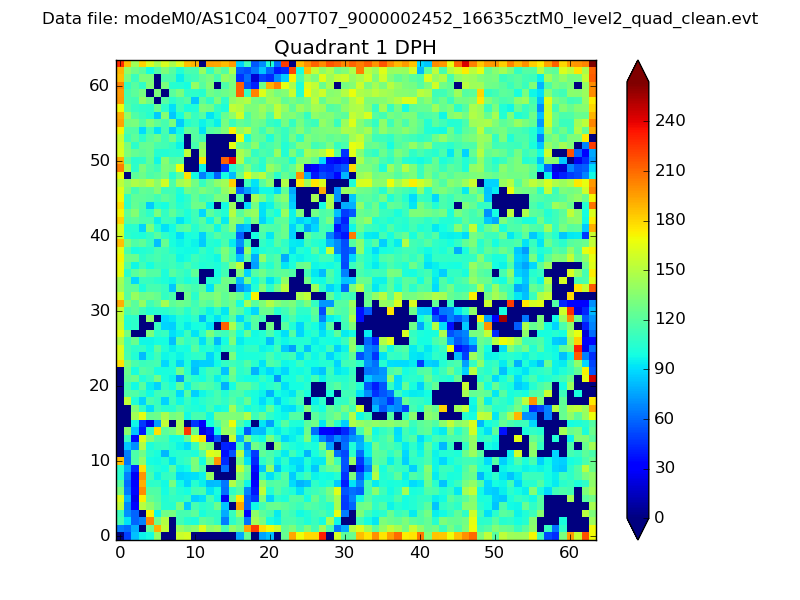 |
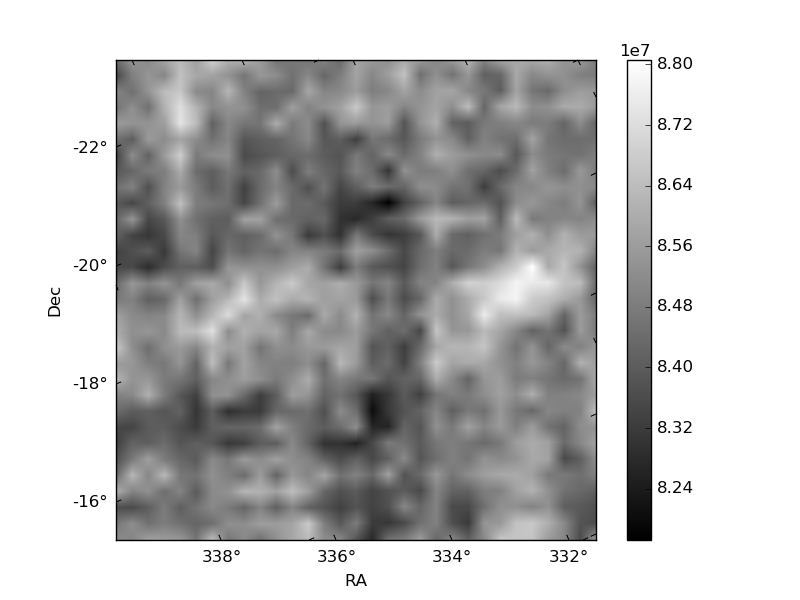
Quadrant B |
|---|---|---|---|
| Quadrant D | 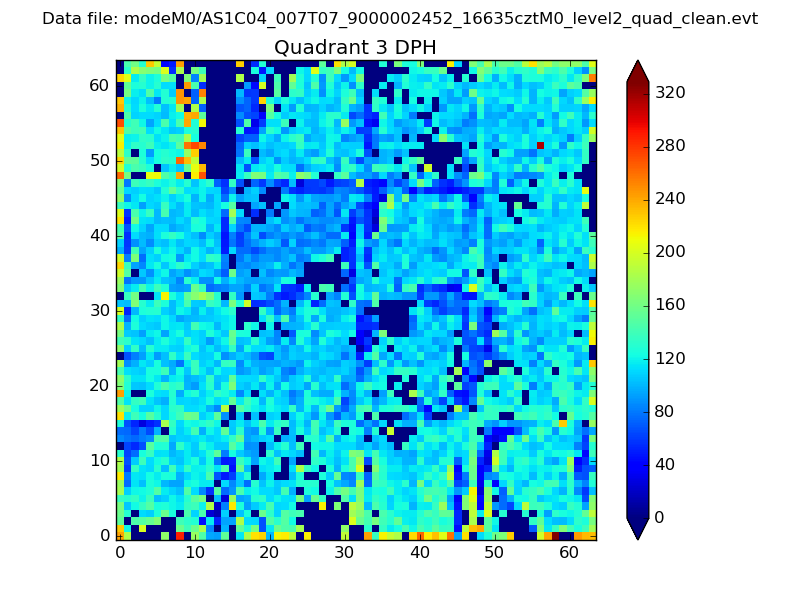 |
 |
Quadrant C |
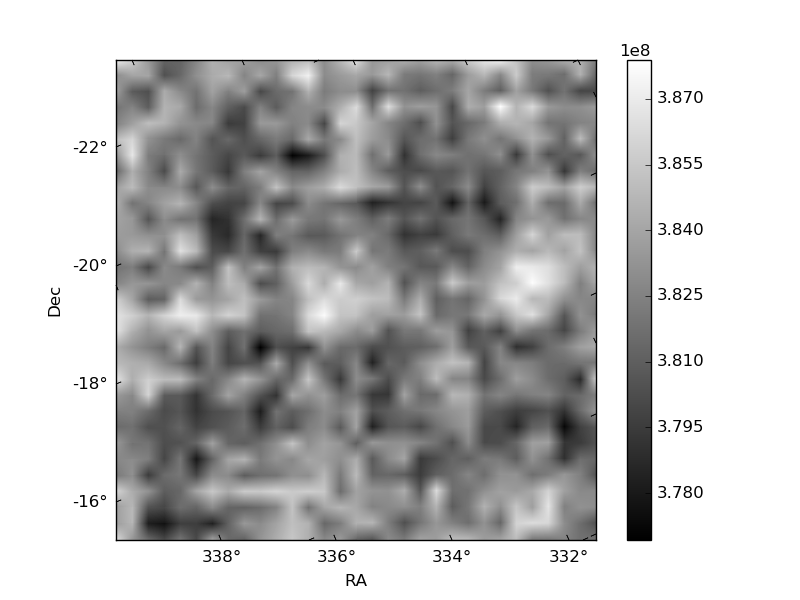
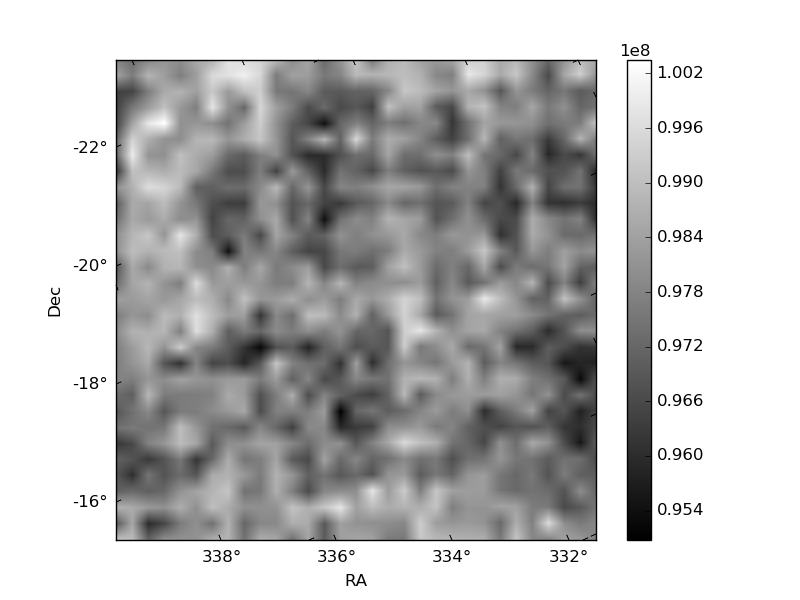
| Plot type | Count rate plots | Images |
|---|---|---|
| Comparison with Poisson distribution Blue bars denote a histogram of data divided into 1 sec bins. Red curve is a Poisson curve with rate = median count rate of data. |
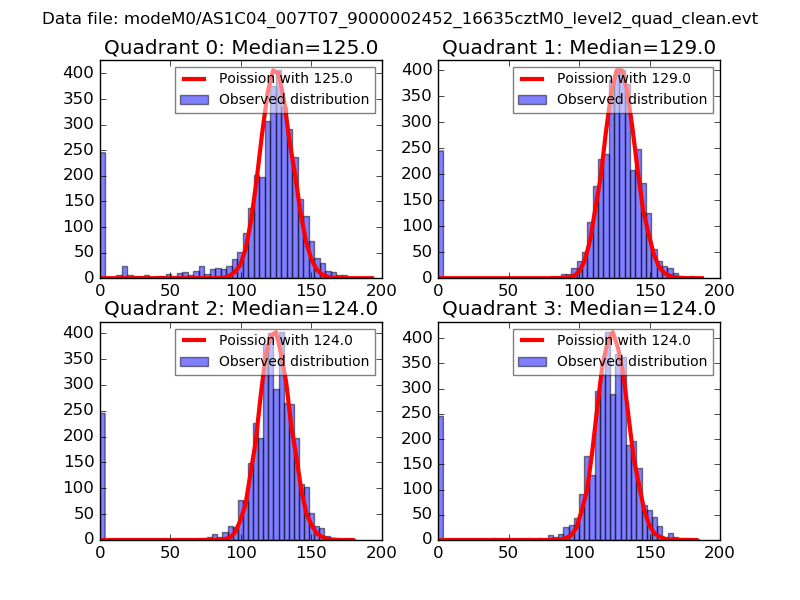 |
 |
| Quadrant-wise count rates Data is divided into 100 sec bins |
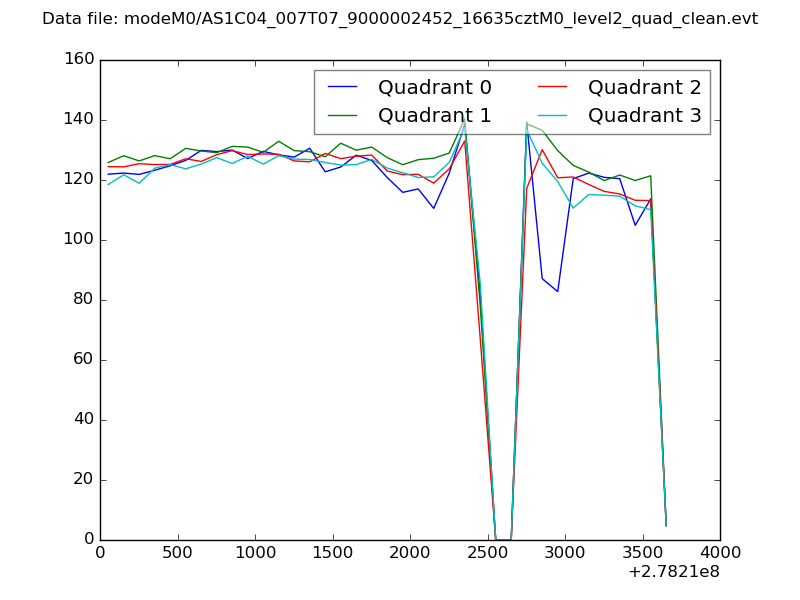 |
|
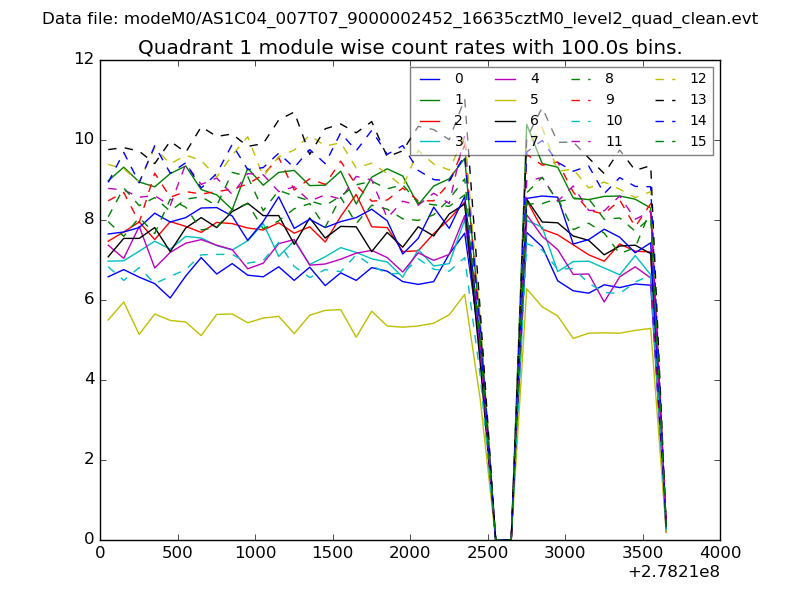
| Module-wise count rates for Quadrant A Data is divided into 100 sec bins |
 |
 |
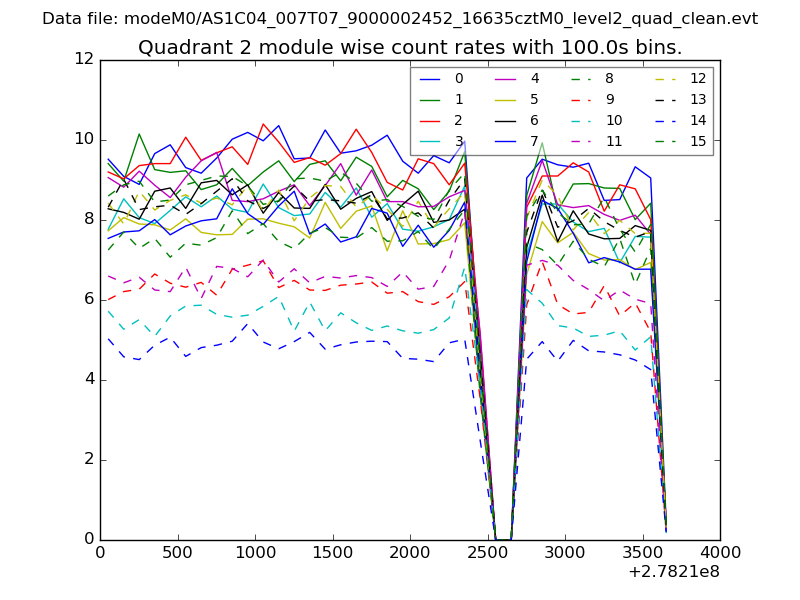
| Module-wise count rates for Quadrant B Data is divided into 100 sec bins |
 |
 |
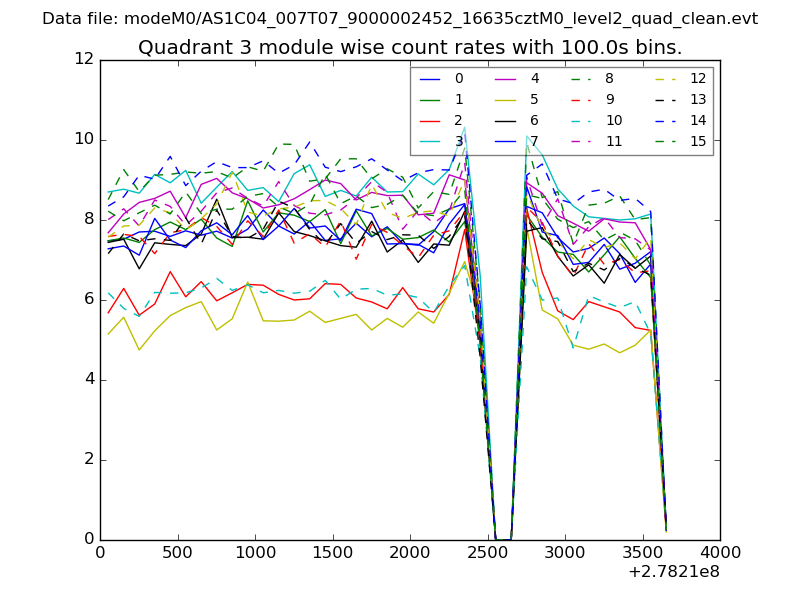
| Module-wise count rates for Quadrant C Data is divided into 100 sec bins |
 |
 |
| Module-wise count rates for Quadrant D Data is divided into 100 sec bins |
 |
 |
| Parameter | Plot |
|---|---|
| CZT HV Monitor | 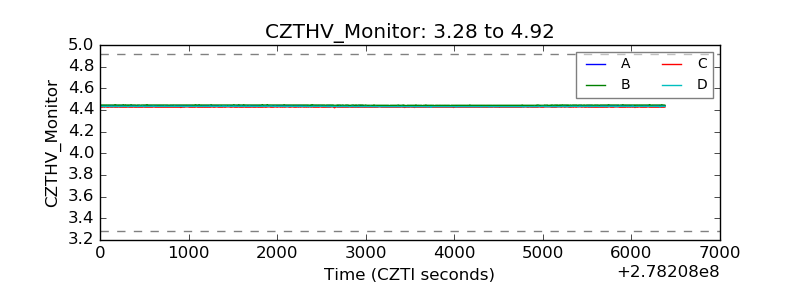 |
| D_VDD |  |
| Temperature 1 |  |
| Veto HV Monitor | 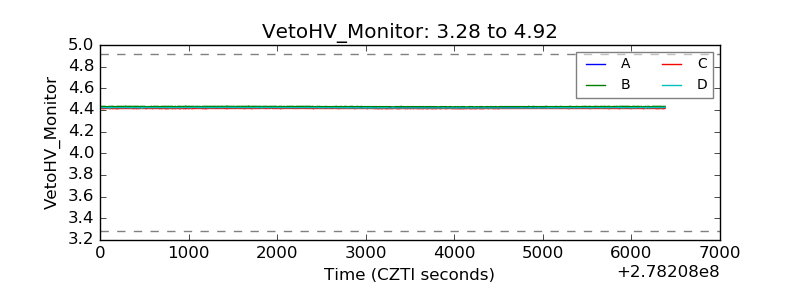 |
| Veto LLD | 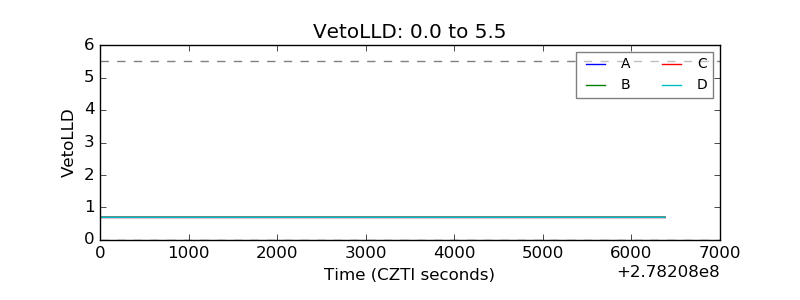 |
| Alpha Counter | 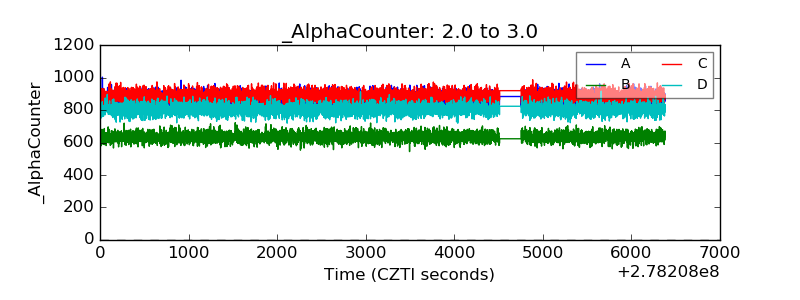 |
| _CPM_Rate | 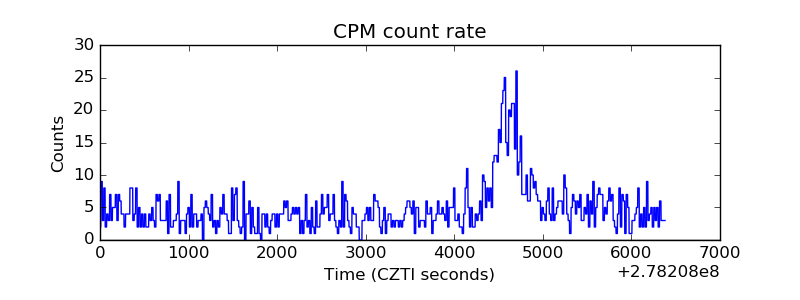 |
| CZT Counter | 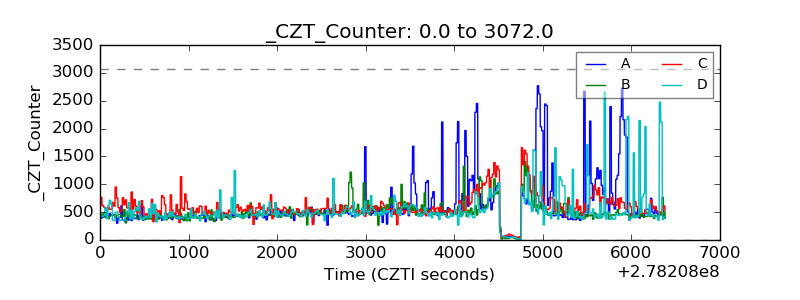 |
| +2.5 Volts monitor |  |
| +5 Volts monitor |  |
| _ROLL_ROT | 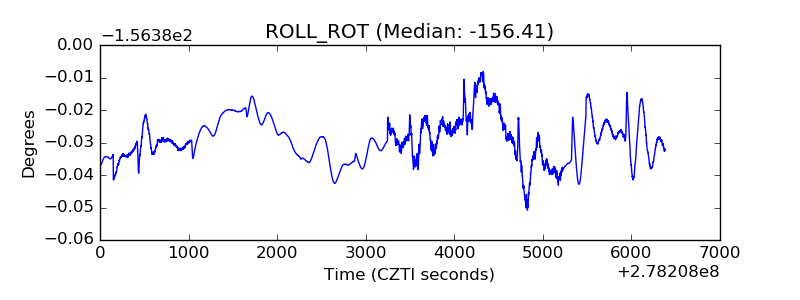 |
| _Roll_DEC |  |
| _Roll_RA | 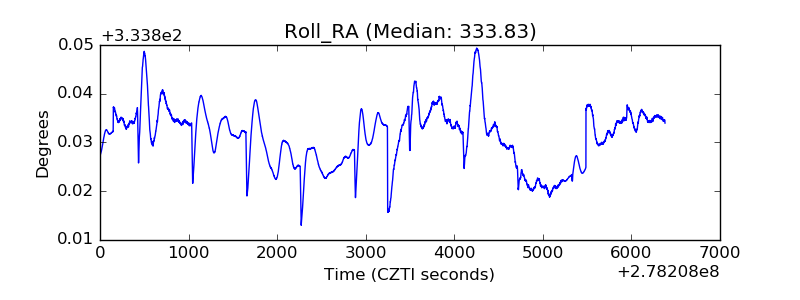 |
| Veto Counter |  |