| Param | Original file | Final file |
|---|---|---|
| Filename | modeM0/AS1C04_007T07_9000002452_16636cztM0_level2.evt | modeM0/AS1C04_007T07_9000002452_16636cztM0_level2_quad_clean.evt |
| Size (bytes) | 791,516,160 | 85,138,560 |
| Size | 754.8 MB | 81.2 MB |
| Events in quadrant A | 5,202,803 | 532,490 |
| Events in quadrant B | 3,932,279 | 554,048 |
| Events in quadrant C | 8,565,779 | 434,763 |
| Events in quadrant D | 5,751,329 | 521,757 |
| Mode M9 | |||
|---|---|---|---|
| Quadrant | BADHDUFLAG | Total packets | Discarded packets |
| A | 0 | 4 | 0 |
| B | 0 | 4 | 0 |
| C | 0 | 4 | 0 |
| D | 0 | 4 | 0 |
| Mode SS | |||
|---|---|---|---|
| Quadrant | BADHDUFLAG | Total packets | Discarded packets |
| A | 0 | 158 | 0 |
| B | 0 | 158 | 0 |
| C | 0 | 158 | 0 |
| D | 0 | 158 | 0 |
| Mode M0 | |||
|---|---|---|---|
| Quadrant | BADHDUFLAG | Total packets | Discarded packets |
| A | 0 | 20676 | 3 |
| B | 0 | 16761 | 2 |
| C | 0 | 30456 | 2 |
| D | 0 | 22465 | 2 |
| Quadrant | Total seconds | Saturated seconds | Saturation percentage |
|---|---|---|---|
| A | 7674 | 631 | 8.222570% |
| B | 7674 | 210 | 2.736513% |
| C | 7674 | 2071 | 26.987230% |
| D | 7674 | 421 | 5.486057% |
Noise dominated data is calculated using 1-second bins in cleaned event files. If a bin has >2000 counts, and if more than 50% of those come from <1% of pixels, then it is considered to be noise-dominated and hence unusable.
| Quadrant | # 1 sec bins | Bins with >0 counts | Bins with >2000 counts | High rate bins dominated by noise | Noise dominated (total time) | Noise dominated (detector-on time) | Marked lightcurve |
|---|---|---|---|---|---|---|---|
| A | 8105 | 7677 | 350 | 350 | 4.32% | 4.56% | 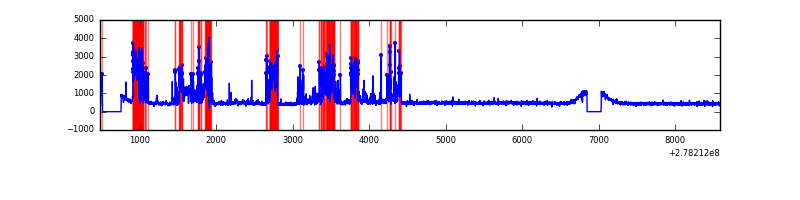 |
| B | 8105 | 7677 | 2 | 2 | 0.02% | 0.03% |  |
| C | 8105 | 7677 | 1272 | 1272 | 15.69% | 16.57% | 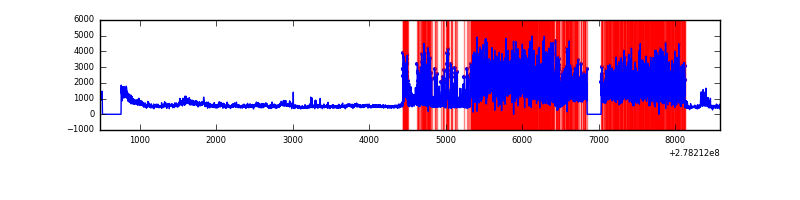 |
| D | 8105 | 7677 | 261 | 261 | 3.22% | 3.40% | 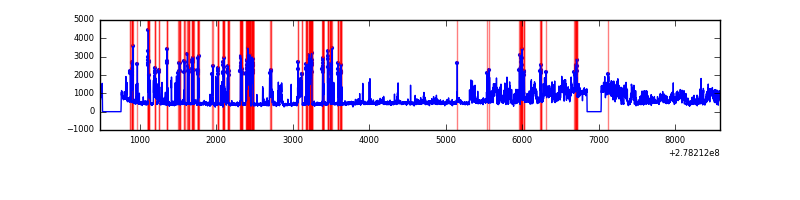 |
Top three noisy pixels from each quadrant. If the there are fewer than three noisy pixels in the level2.evt file, extra rows are filled as -1
| Pixel properties | Quadrant properties | ||||||
|---|---|---|---|---|---|---|---|
| Quadrant | DetID | PixID | Counts | Sigma | Mean | Median | Sigma |
| A | 15 | 174 | 1696482 | 9112.77 | 909 | 889 | 186.1 |
| A | 15 | 223 | 9001 | 43.6 | 909 | 889 | 186.1 |
| A | 0 | 226 | 7980 | 38.11 | 909 | 889 | 186.1 |
| B | 15 | 35 | 102924 | 555.62 | 935 | 910 | 183.6 |
| B | 4 | 216 | 37052 | 196.85 | 935 | 910 | 183.6 |
| B | 0 | 198 | 36572 | 194.23 | 935 | 910 | 183.6 |
| C | 7 | 247 | 4753423 | 25112.67 | 799 | 805 | 189.3 |
| C | 3 | 233 | 563149 | 2971.41 | 799 | 805 | 189.3 |
| C | 14 | 238 | 120096 | 630.33 | 799 | 805 | 189.3 |
| D | 1 | 52 | 2102801 | 9394.02 | 899 | 870 | 223.8 |
| D | 10 | 70 | 106346 | 471.4 | 899 | 870 | 223.8 |
| D | 5 | 222 | 102218 | 452.95 | 899 | 870 | 223.8 |
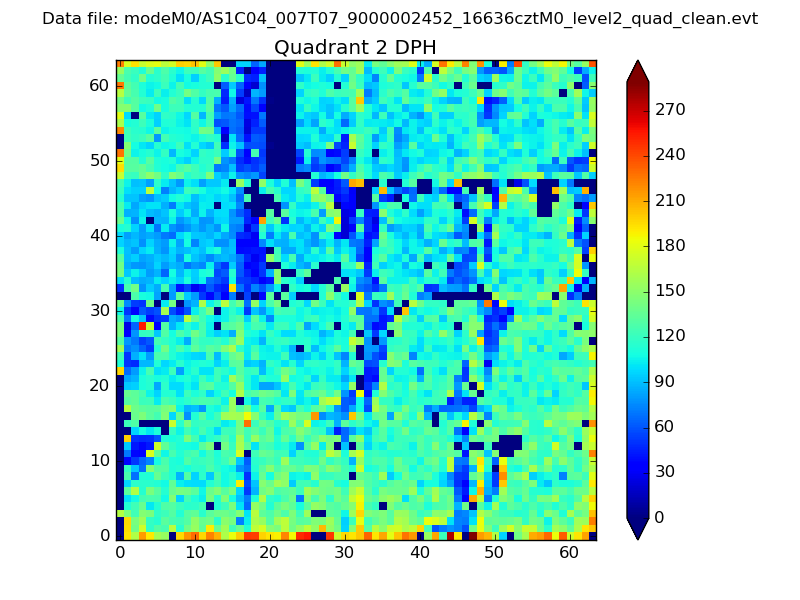
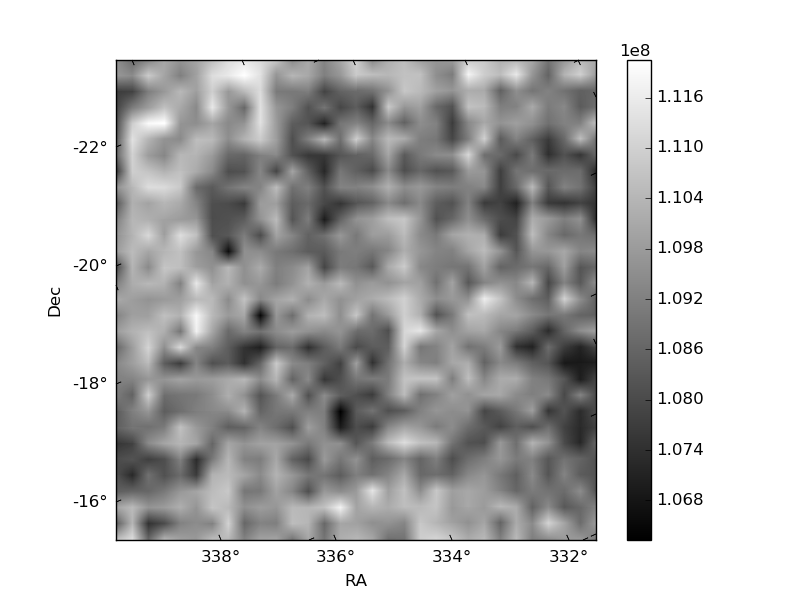
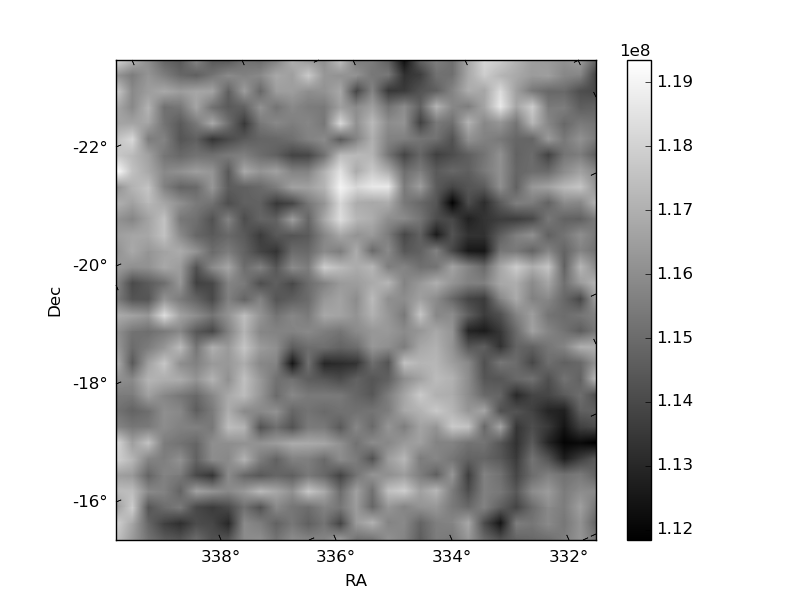
Histogram calculated using DETX and DETY for each event in the final _common_clean file
| Quadrant A | 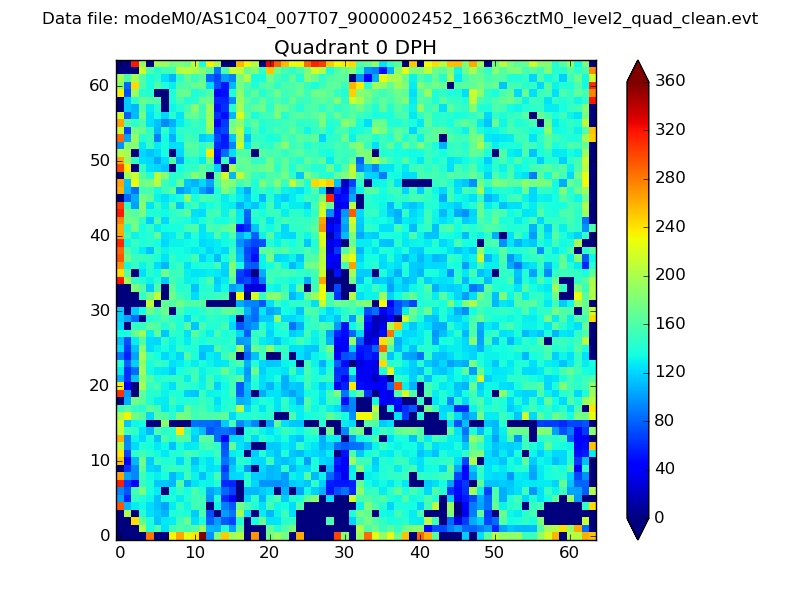 |
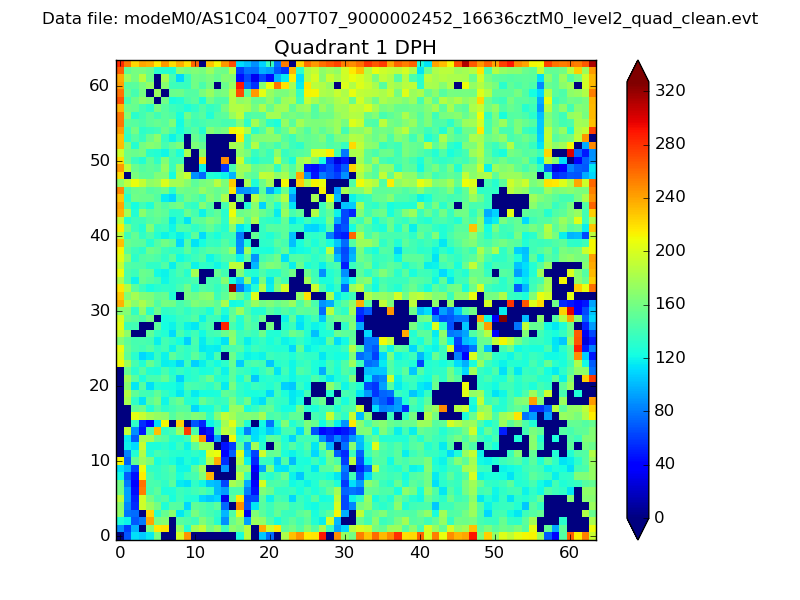 |
Quadrant B |
|---|---|---|---|
| Quadrant D | 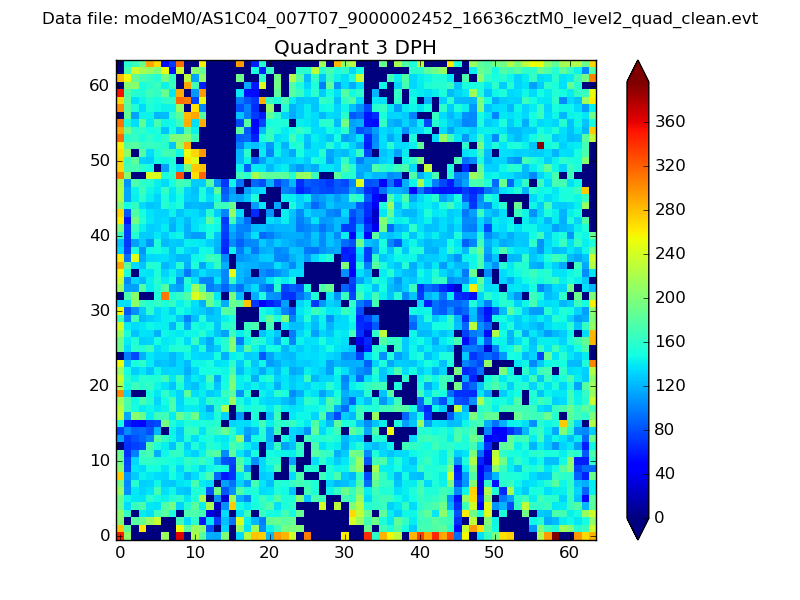 |
 |
Quadrant C |
| Plot type | Count rate plots | Images |
|---|---|---|
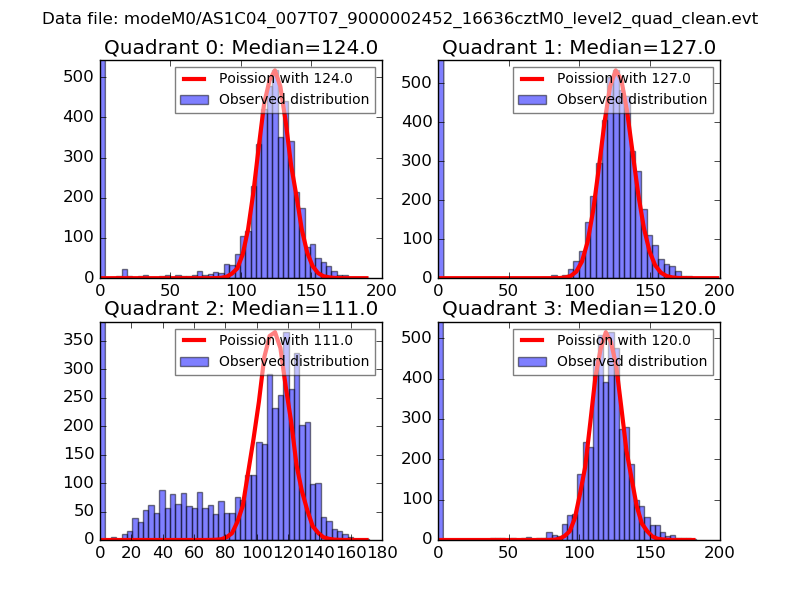
| Comparison with Poisson distribution Blue bars denote a histogram of data divided into 1 sec bins. Red curve is a Poisson curve with rate = median count rate of data. |
 |
 |
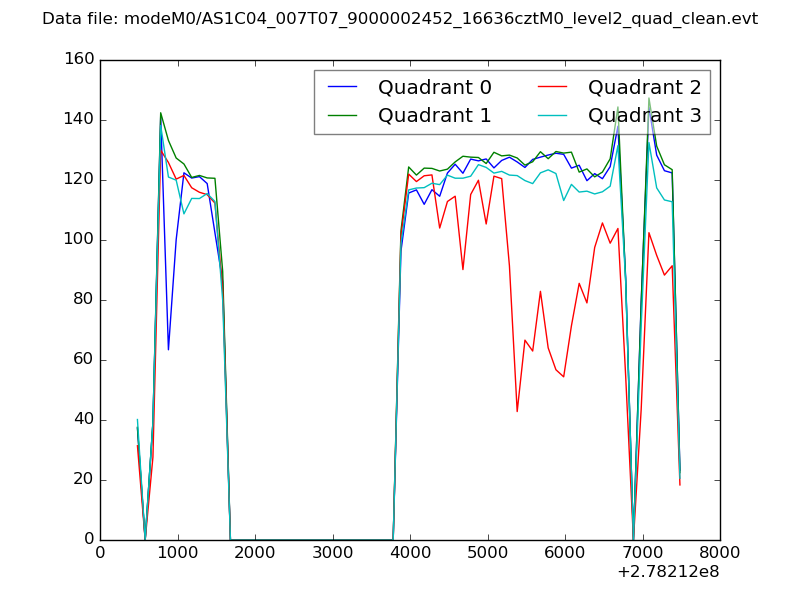
| Quadrant-wise count rates Data is divided into 100 sec bins |
 |
|
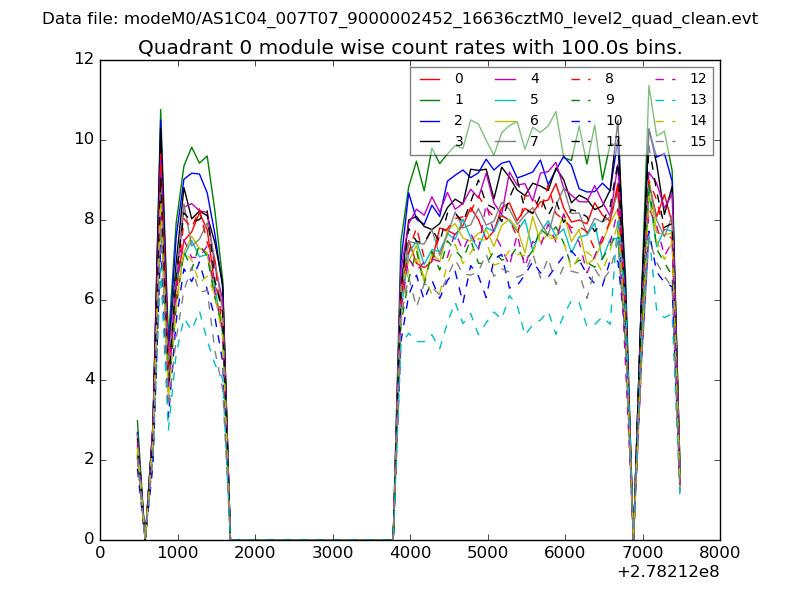
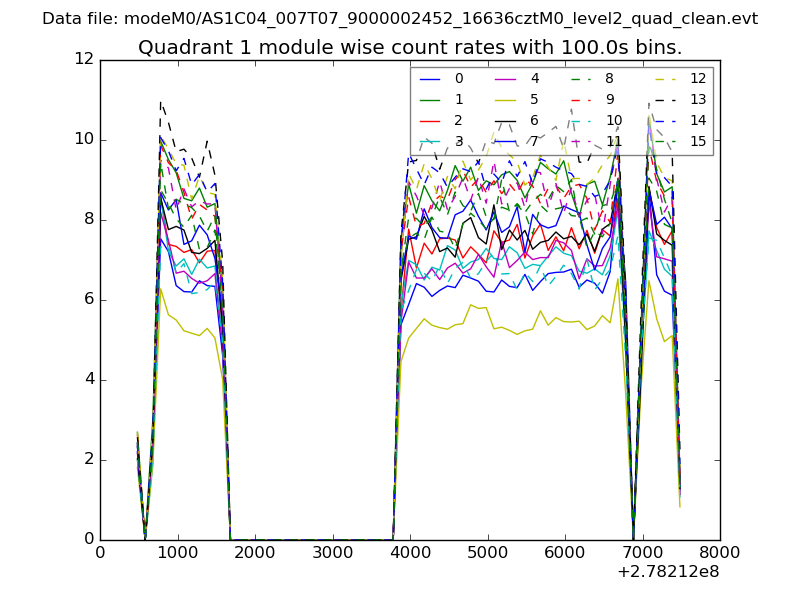
| Module-wise count rates for Quadrant A Data is divided into 100 sec bins |
 |
 |
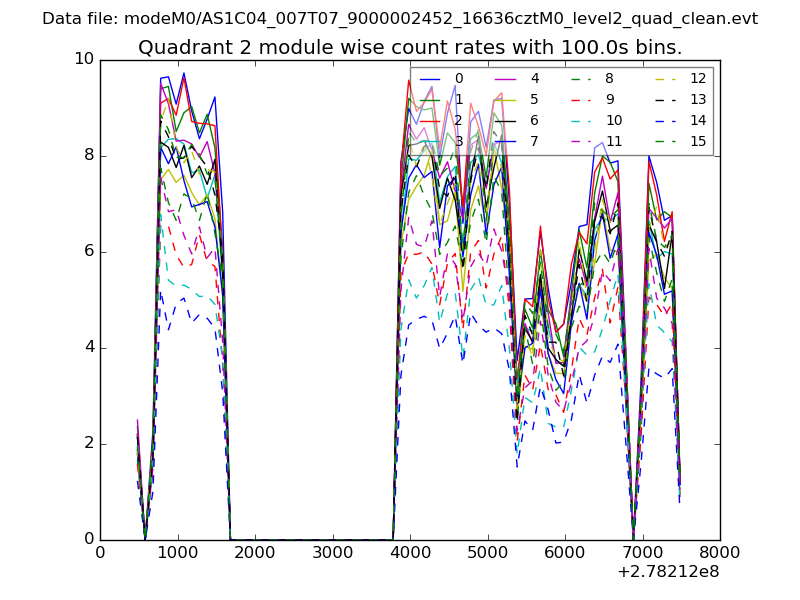
| Module-wise count rates for Quadrant B Data is divided into 100 sec bins |
 |
 |
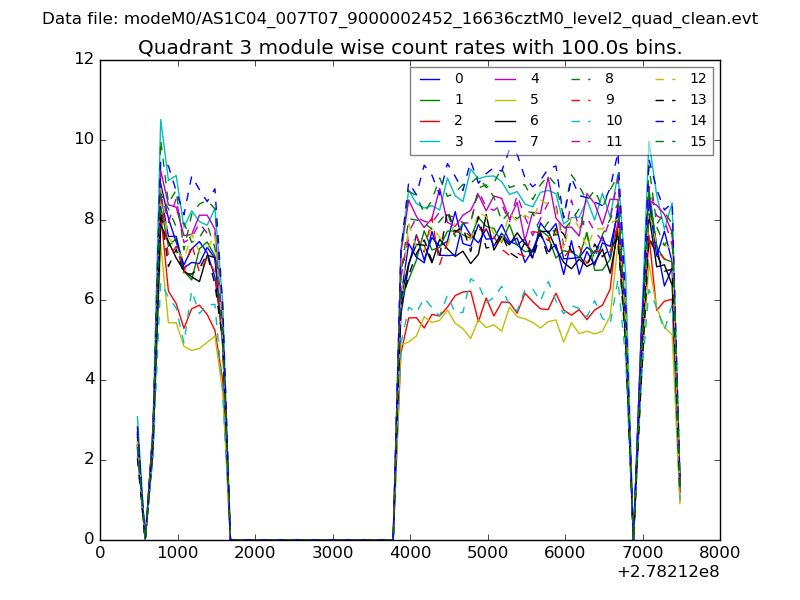
| Module-wise count rates for Quadrant C Data is divided into 100 sec bins |
 |
 |
| Module-wise count rates for Quadrant D Data is divided into 100 sec bins |
 |
 |
| Parameter | Plot |
|---|---|
| CZT HV Monitor | 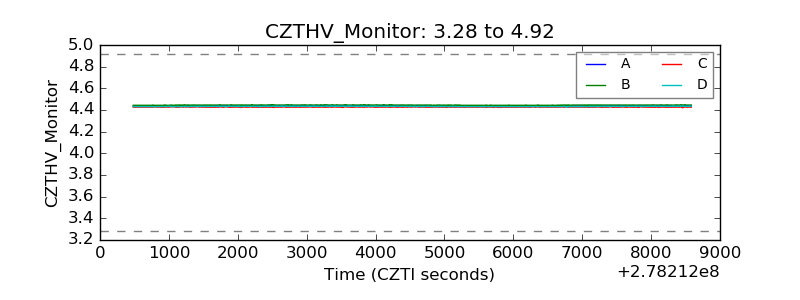 |
| D_VDD | 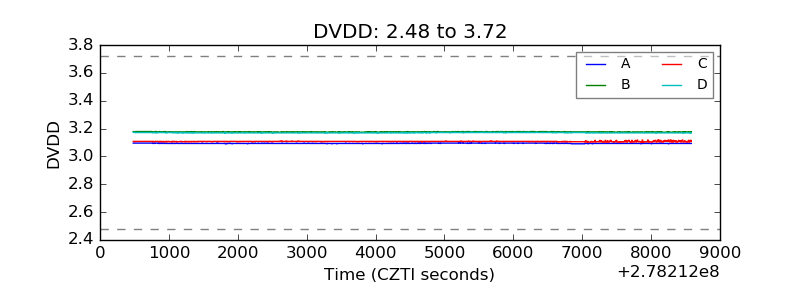 |
| Temperature 1 | 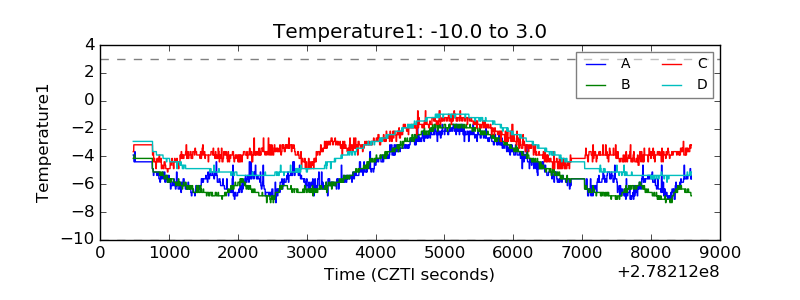 |
| Veto HV Monitor | 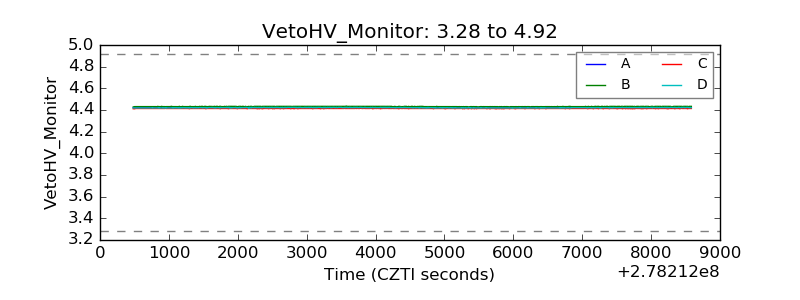 |
| Veto LLD | 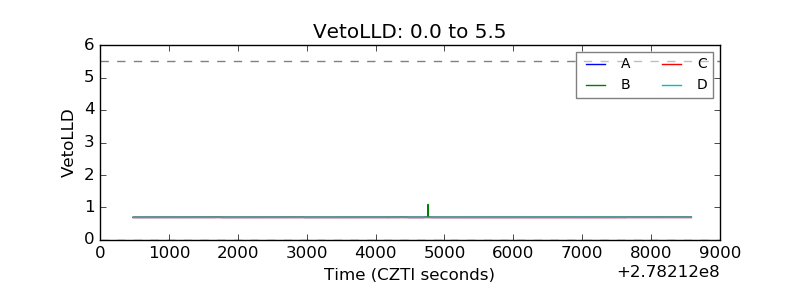 |
| Alpha Counter | 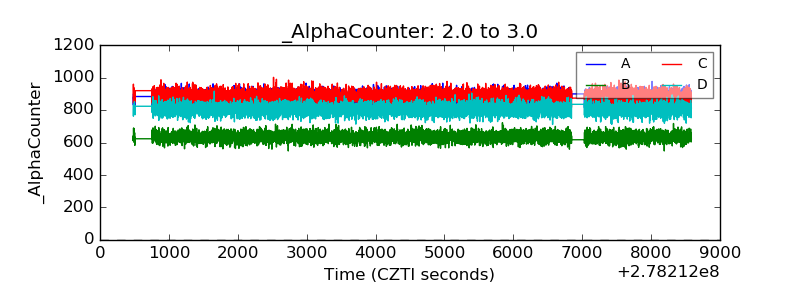 |
| _CPM_Rate | 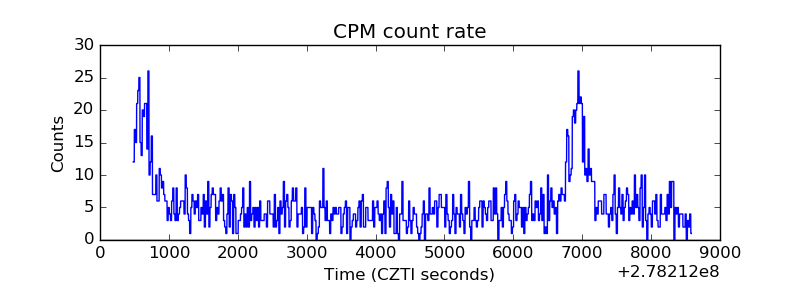 |
| CZT Counter | 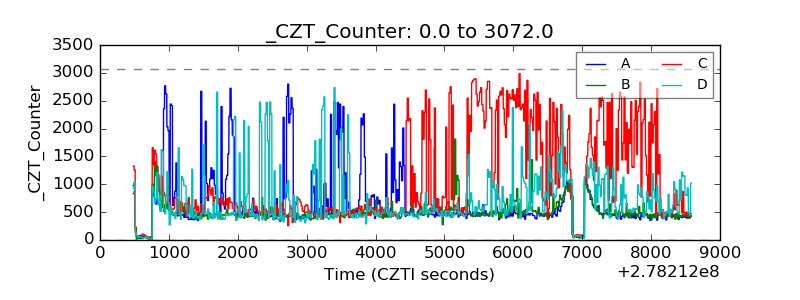 |
| +2.5 Volts monitor |  |
| +5 Volts monitor | 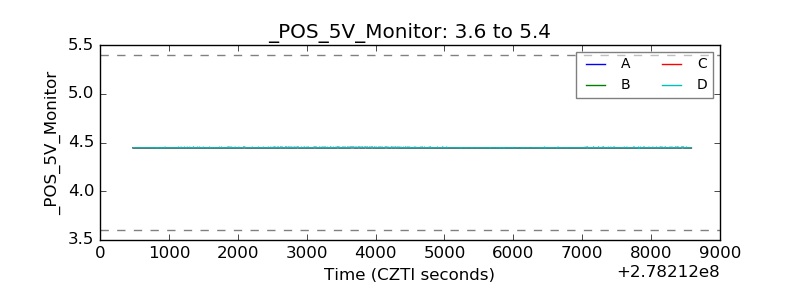 |
| _ROLL_ROT | 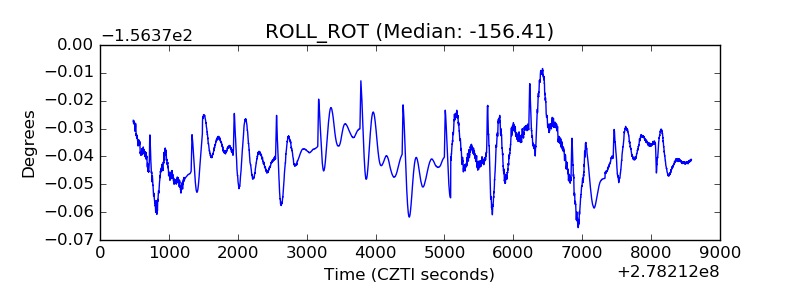 |
| _Roll_DEC | 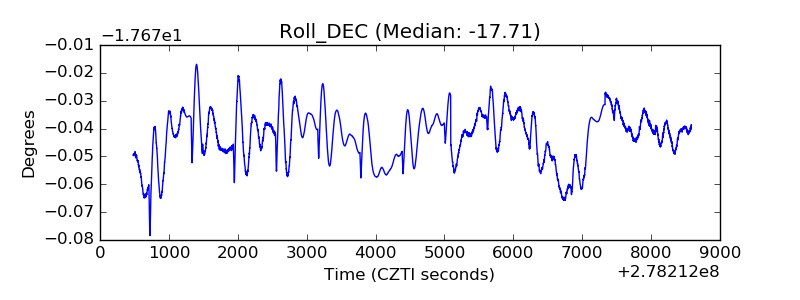 |
| _Roll_RA | 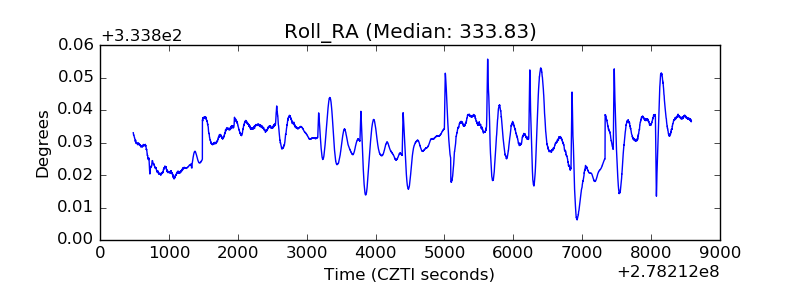 |
| Veto Counter | 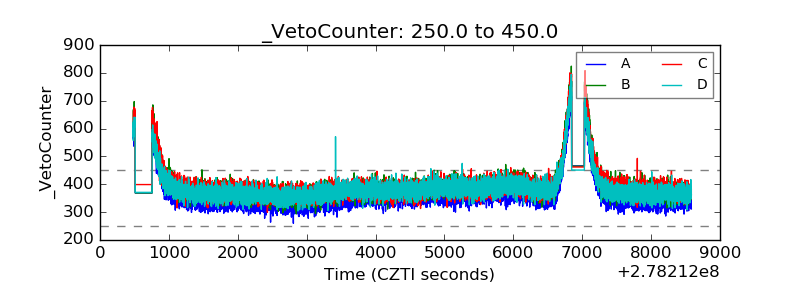 |