| Param | Original file | Final file |
|---|---|---|
| Filename | modeM0/AS1C04_007T07_9000002452_16637cztM0_level2.evt | modeM0/AS1C04_007T07_9000002452_16637cztM0_level2_quad_clean.evt |
| Size (bytes) | 540,789,120 | 68,633,280 |
| Size | 515.7 MB | 65.5 MB |
| Events in quadrant A | 3,266,764 | 398,942 |
| Events in quadrant B | 3,624,167 | 404,734 |
| Events in quadrant C | 4,382,461 | 395,530 |
| Events in quadrant D | 4,622,604 | 384,061 |
| Mode M9 | |||
|---|---|---|---|
| Quadrant | BADHDUFLAG | Total packets | Discarded packets |
| A | 0 | 4 | 0 |
| B | 0 | 4 | 0 |
| C | 0 | 4 | 0 |
| D | 0 | 4 | 0 |
| Mode SS | |||
|---|---|---|---|
| Quadrant | BADHDUFLAG | Total packets | Discarded packets |
| A | 0 | 144 | 0 |
| B | 0 | 144 | 0 |
| C | 0 | 144 | 0 |
| D | 0 | 144 | 0 |
| Mode M0 | |||
|---|---|---|---|
| Quadrant | BADHDUFLAG | Total packets | Discarded packets |
| A | 0 | 14564 | 2 |
| B | 0 | 15270 | 1 |
| C | 0 | 17459 | 1 |
| D | 0 | 18639 | 1 |
| Quadrant | Total seconds | Saturated seconds | Saturation percentage |
|---|---|---|---|
| A | 7104 | 83 | 1.168356% |
| B | 7104 | 106 | 1.492117% |
| C | 7104 | 445 | 6.264077% |
| D | 7104 | 113 | 1.590653% |
Noise dominated data is calculated using 1-second bins in cleaned event files. If a bin has >2000 counts, and if more than 50% of those come from <1% of pixels, then it is considered to be noise-dominated and hence unusable.
| Quadrant | # 1 sec bins | Bins with >0 counts | Bins with >2000 counts | High rate bins dominated by noise | Noise dominated (total time) | Noise dominated (detector-on time) | Marked lightcurve |
|---|---|---|---|---|---|---|---|
| A | 7500 | 7106 | 1 | 1 | 0.01% | 0.01% | 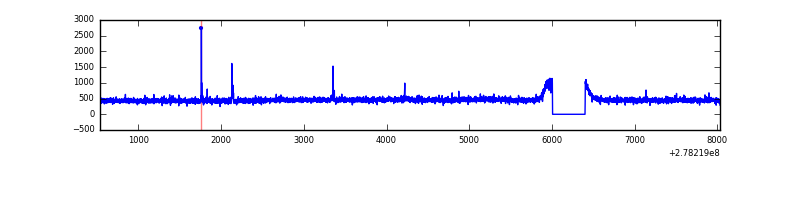 |
| B | 7500 | 7106 | 2 | 2 | 0.03% | 0.03% | 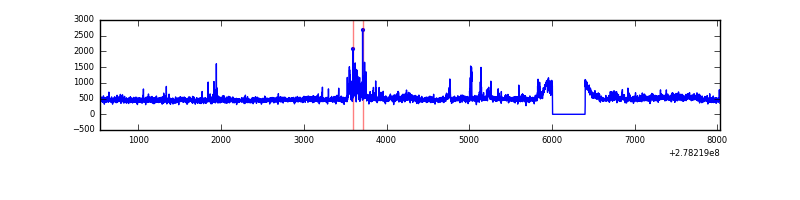 |
| C | 7500 | 7106 | 247 | 247 | 3.29% | 3.48% | 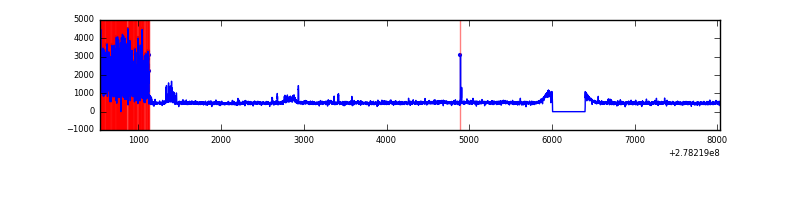 |
| D | 7500 | 7106 | 27 | 27 | 0.36% | 0.38% | 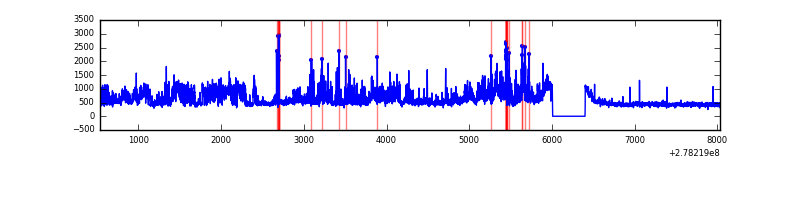 |
Top three noisy pixels from each quadrant. If the there are fewer than three noisy pixels in the level2.evt file, extra rows are filled as -1
| Pixel properties | Quadrant properties | ||||||
|---|---|---|---|---|---|---|---|
| Quadrant | DetID | PixID | Counts | Sigma | Mean | Median | Sigma |
| A | 9 | 143 | 21388 | 120.64 | 839 | 821 | 170.5 |
| A | 15 | 223 | 10760 | 58.3 | 839 | 821 | 170.5 |
| A | 0 | 226 | 7381 | 38.48 | 839 | 821 | 170.5 |
| B | 15 | 35 | 120402 | 729.82 | 844 | 820 | 163.9 |
| B | 0 | 214 | 104959 | 635.57 | 844 | 820 | 163.9 |
| B | 0 | 198 | 45809 | 274.57 | 844 | 820 | 163.9 |
| C | 7 | 247 | 993825 | 5269.67 | 797 | 802 | 188.4 |
| C | 3 | 233 | 129072 | 680.69 | 797 | 802 | 188.4 |
| C | 14 | 238 | 121097 | 638.37 | 797 | 802 | 188.4 |
| D | 1 | 52 | 1424717 | 7064.35 | 819 | 795 | 201.6 |
| D | 5 | 222 | 49561 | 241.94 | 819 | 795 | 201.6 |
| D | 2 | 234 | 29227 | 141.05 | 819 | 795 | 201.6 |
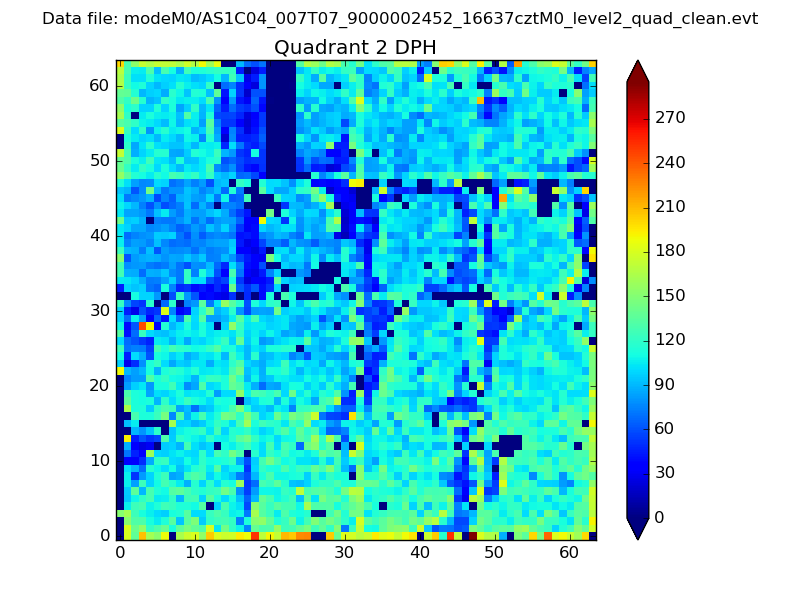
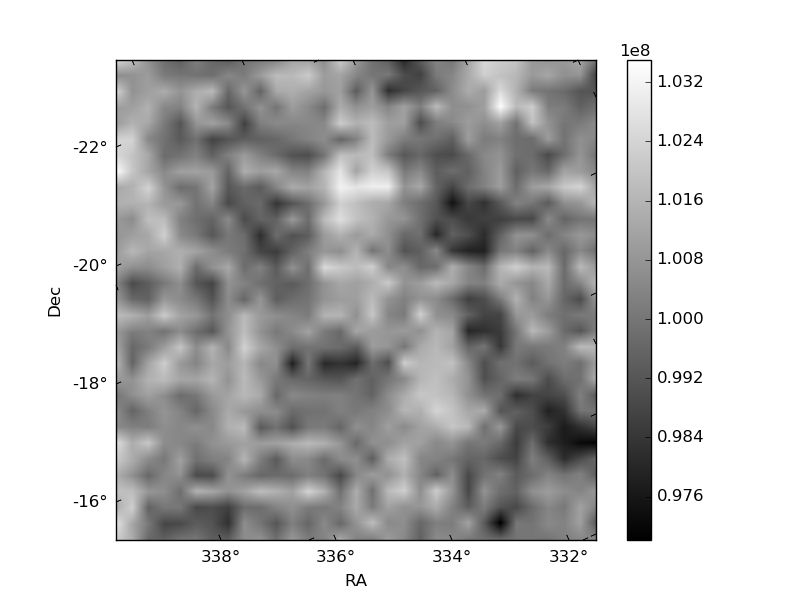
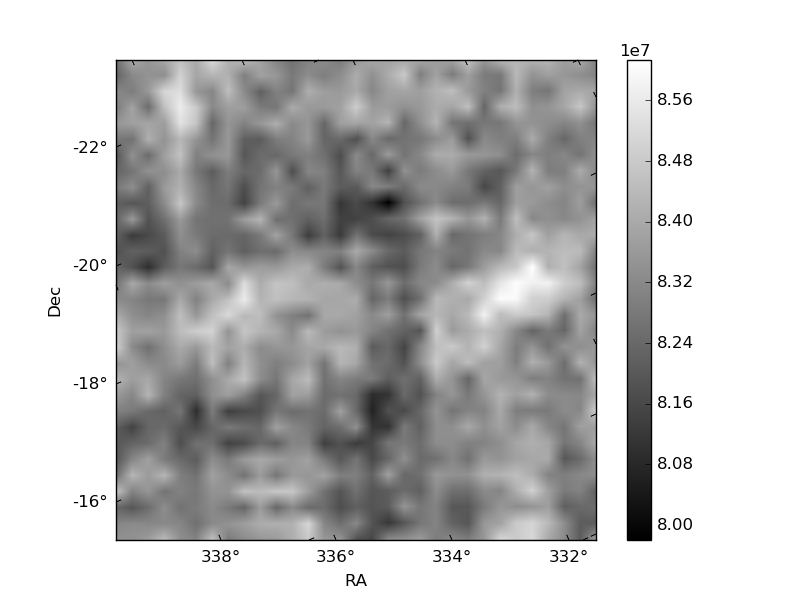
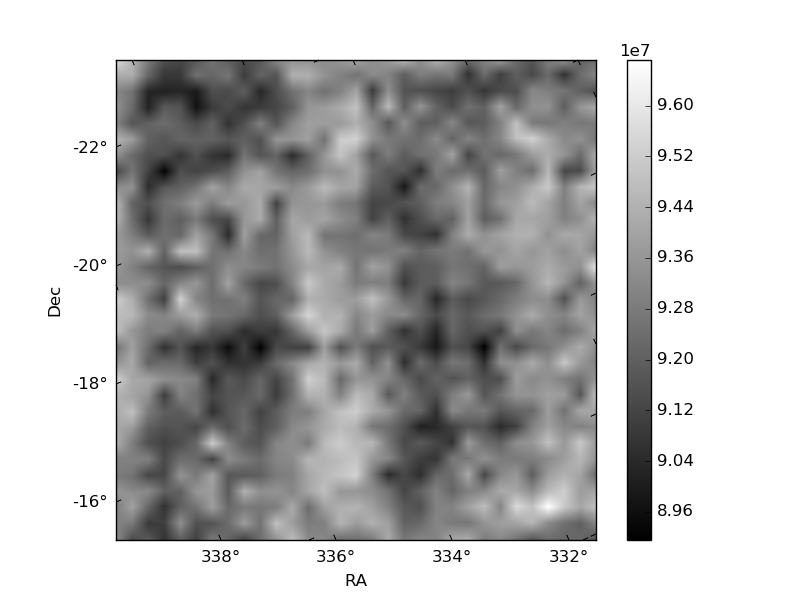
Histogram calculated using DETX and DETY for each event in the final _common_clean file
| Quadrant A | 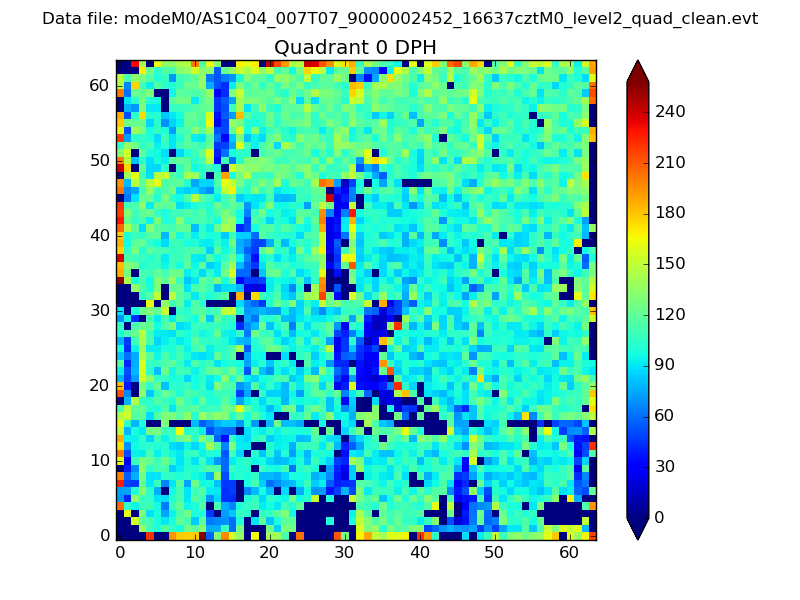 |
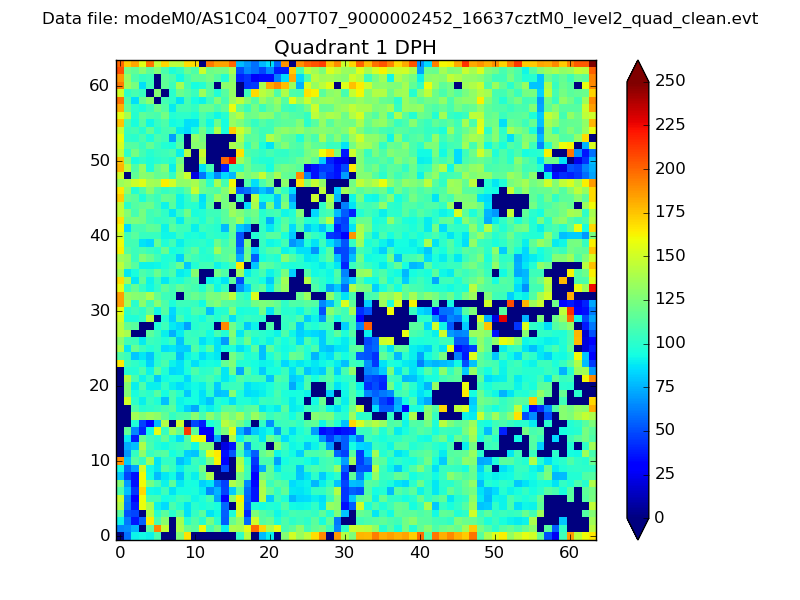 |
Quadrant B |
|---|---|---|---|
| Quadrant D | 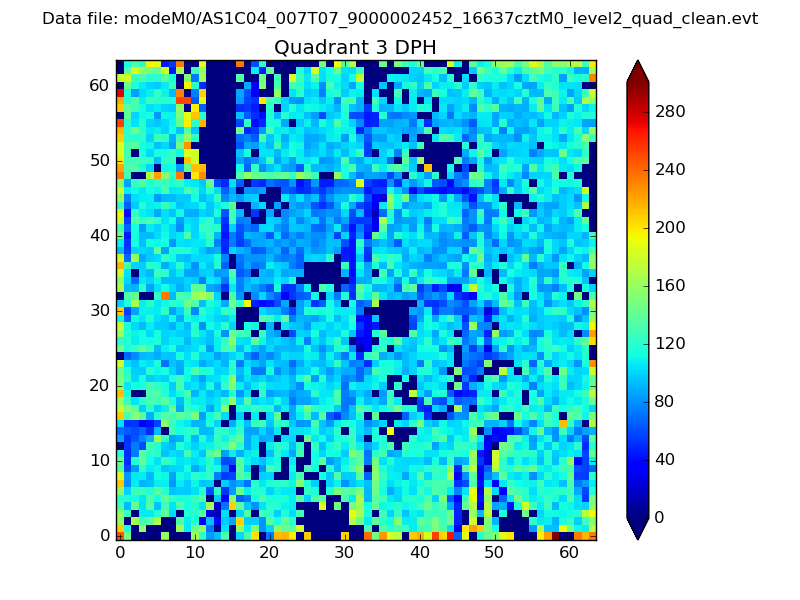 |
 |
Quadrant C |
| Plot type | Count rate plots | Images |
|---|---|---|
| Comparison with Poisson distribution Blue bars denote a histogram of data divided into 1 sec bins. Red curve is a Poisson curve with rate = median count rate of data. |
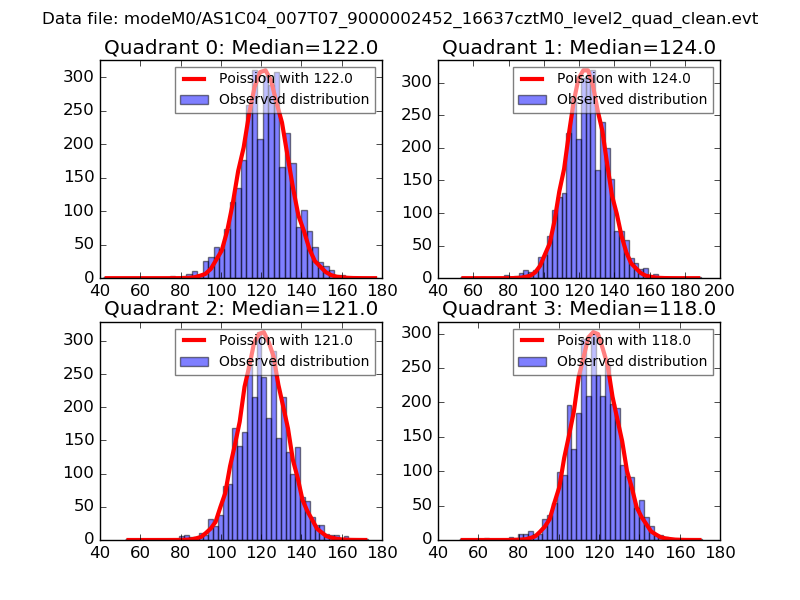 |
 |
| Quadrant-wise count rates Data is divided into 100 sec bins |
 |
|
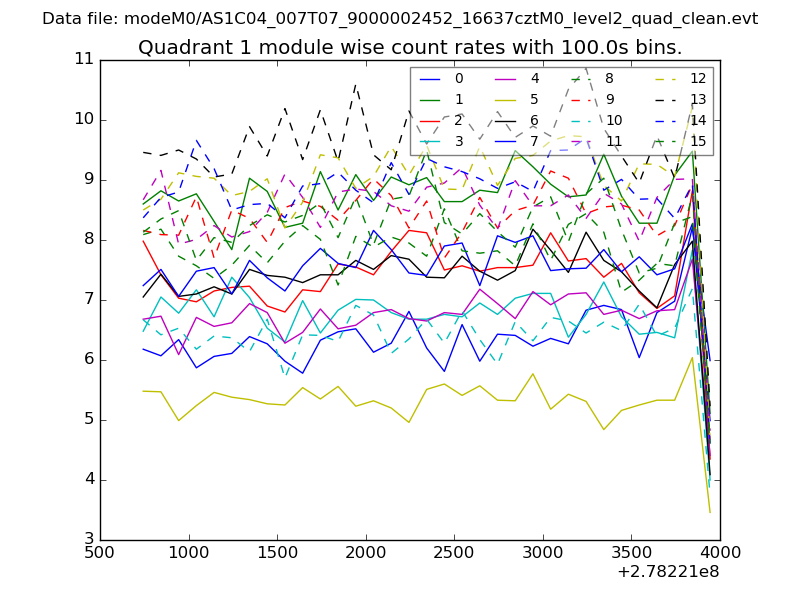
| Module-wise count rates for Quadrant A Data is divided into 100 sec bins |
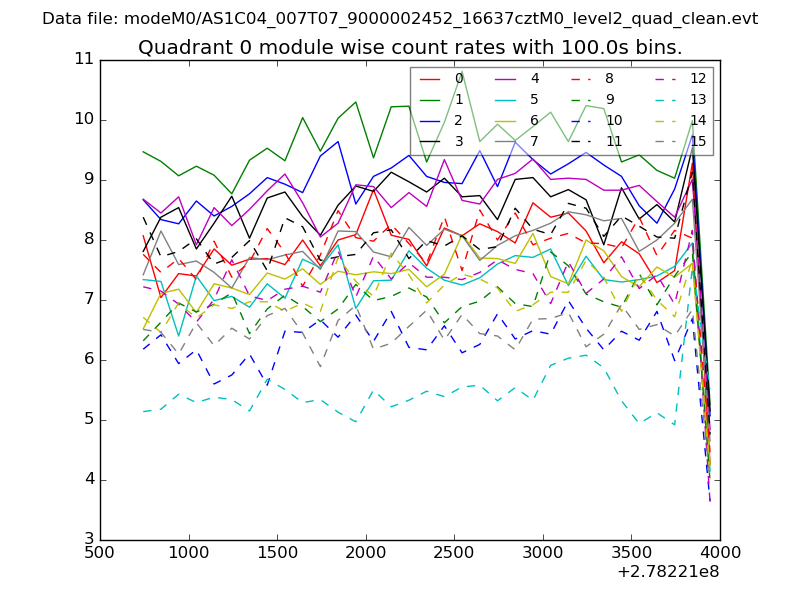 |
 |
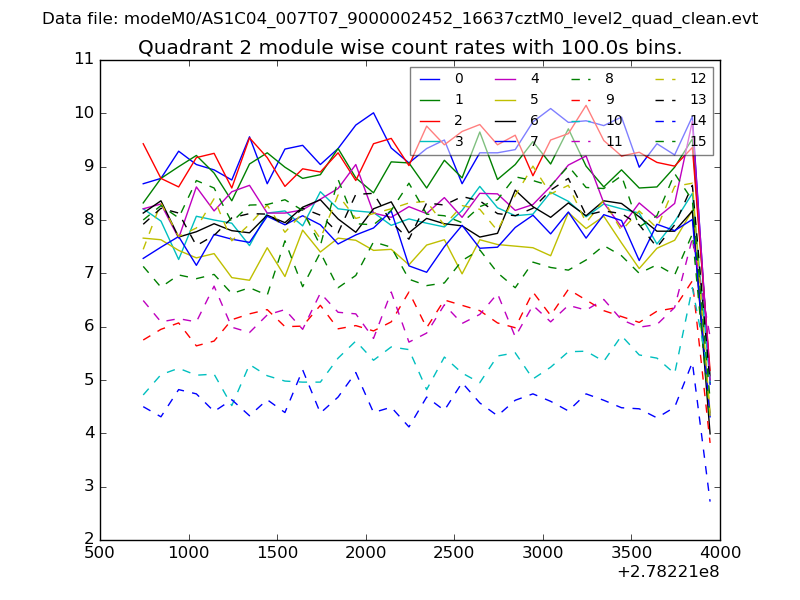
| Module-wise count rates for Quadrant B Data is divided into 100 sec bins |
 |
 |
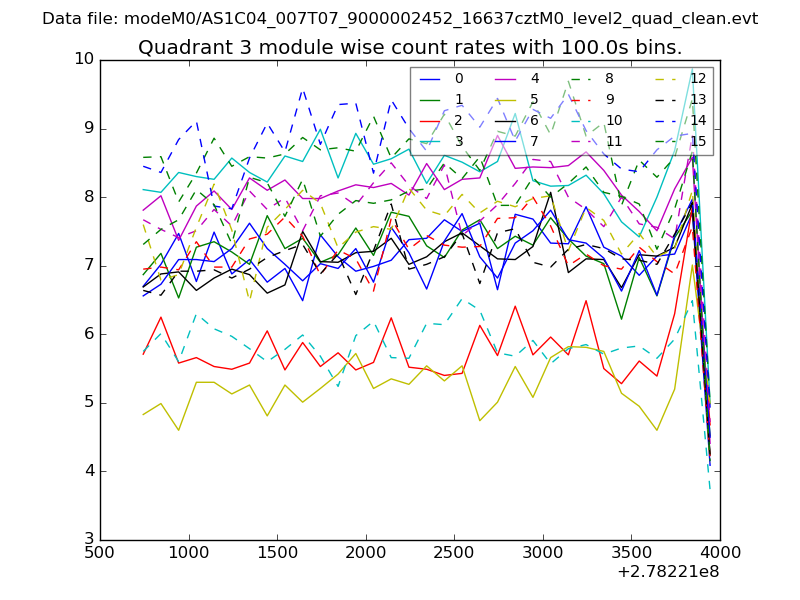
| Module-wise count rates for Quadrant C Data is divided into 100 sec bins |
 |
 |
| Module-wise count rates for Quadrant D Data is divided into 100 sec bins |
 |
 |
| Parameter | Plot |
|---|---|
| CZT HV Monitor | 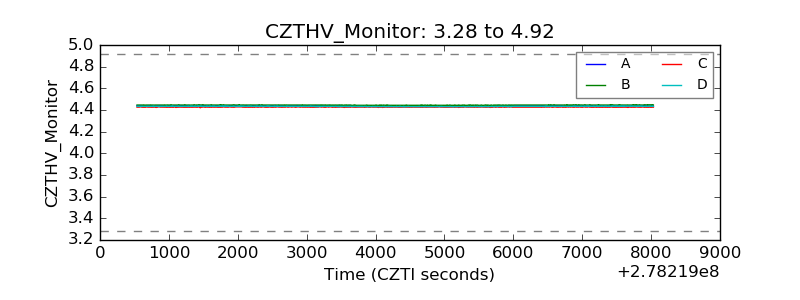 |
| D_VDD | 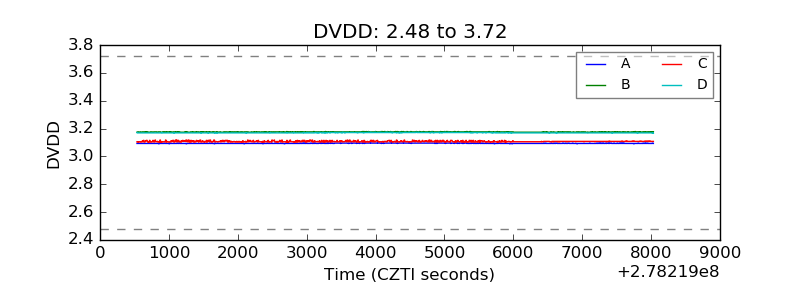 |
| Temperature 1 |  |
| Veto HV Monitor | 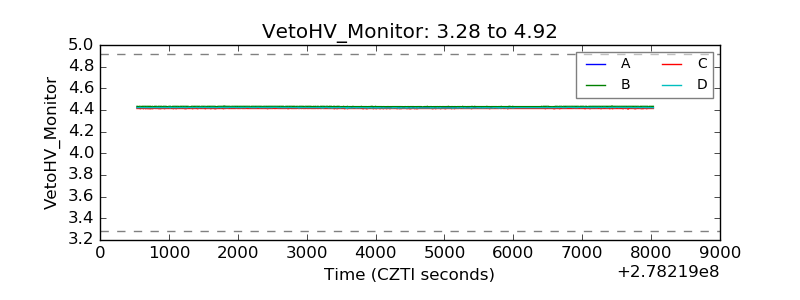 |
| Veto LLD | 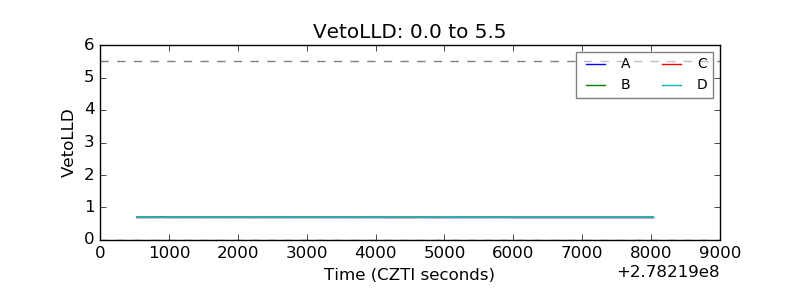 |
| Alpha Counter | 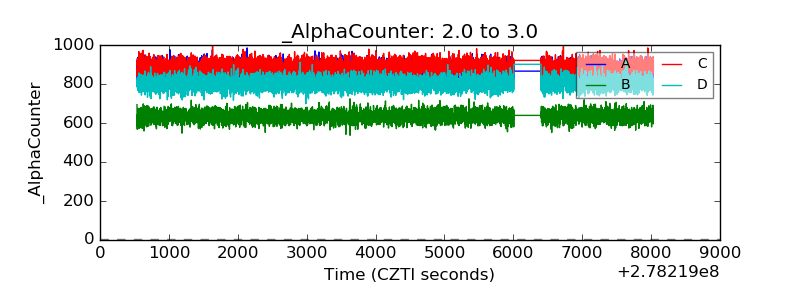 |
| _CPM_Rate | 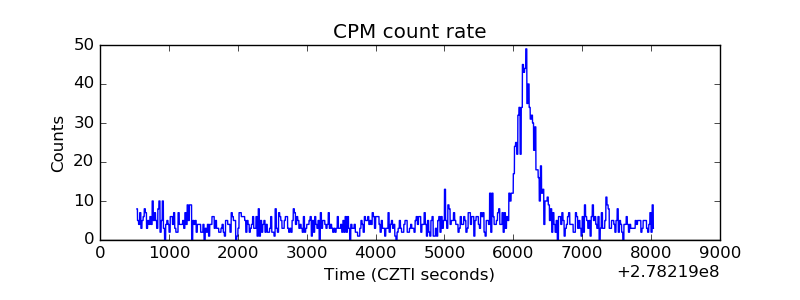 |
| CZT Counter | 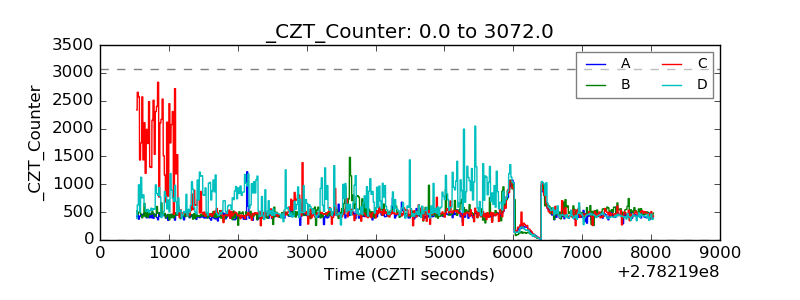 |
| +2.5 Volts monitor |  |
| +5 Volts monitor | 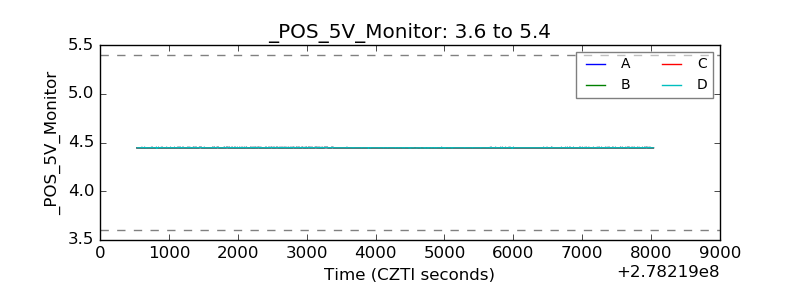 |
| _ROLL_ROT |  |
| _Roll_DEC |  |
| _Roll_RA | 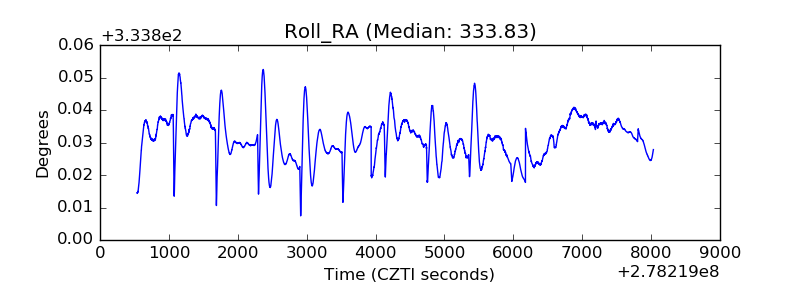 |
| Veto Counter | 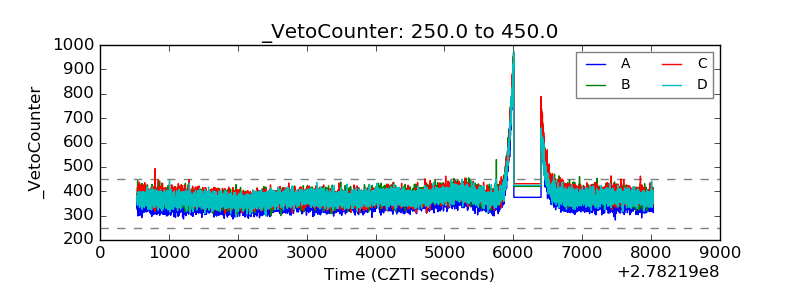 |