| Param | Original file | Final file |
|---|---|---|
| Filename | modeM0/AS1C04_007T07_9000002452_16639cztM0_level2.evt | modeM0/AS1C04_007T07_9000002452_16639cztM0_level2_quad_clean.evt |
| Size (bytes) | 884,335,680 | 145,056,960 |
| Size | 843.4 MB | 138.3 MB |
| Events in quadrant A | 6,020,938 | 884,858 |
| Events in quadrant B | 6,433,526 | 898,626 |
| Events in quadrant C | 6,110,039 | 879,381 |
| Events in quadrant D | 7,359,809 | 854,265 |
| Mode M9 | |||
|---|---|---|---|
| Quadrant | BADHDUFLAG | Total packets | Discarded packets |
| A | 0 | 14 | 0 |
| B | 0 | 14 | 0 |
| C | 0 | 14 | 0 |
| D | 0 | 14 | 0 |
| Mode SS | |||
|---|---|---|---|
| Quadrant | BADHDUFLAG | Total packets | Discarded packets |
| A | 0 | 258 | 0 |
| B | 0 | 258 | 0 |
| C | 0 | 258 | 0 |
| D | 0 | 258 | 0 |
| Mode M0 | |||
|---|---|---|---|
| Quadrant | BADHDUFLAG | Total packets | Discarded packets |
| A | 0 | 26285 | 4 |
| B | 0 | 26973 | 3 |
| C | 0 | 26057 | 3 |
| D | 0 | 30385 | 3 |
| Quadrant | Total seconds | Saturated seconds | Saturation percentage |
|---|---|---|---|
| A | 12671 | 134 | 1.057533% |
| B | 12671 | 154 | 1.215374% |
| C | 12671 | 179 | 1.412675% |
| D | 12671 | 314 | 2.478100% |
Noise dominated data is calculated using 1-second bins in cleaned event files. If a bin has >2000 counts, and if more than 50% of those come from <1% of pixels, then it is considered to be noise-dominated and hence unusable.
| Quadrant | # 1 sec bins | Bins with >0 counts | Bins with >2000 counts | High rate bins dominated by noise | Noise dominated (total time) | Noise dominated (detector-on time) | Marked lightcurve |
|---|---|---|---|---|---|---|---|
| A | 14032 | 12674 | 2 | 2 | 0.01% | 0.02% | 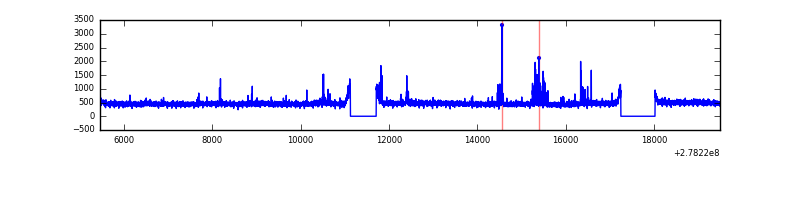 |
| B | 14032 | 12674 | 7 | 7 | 0.05% | 0.06% | 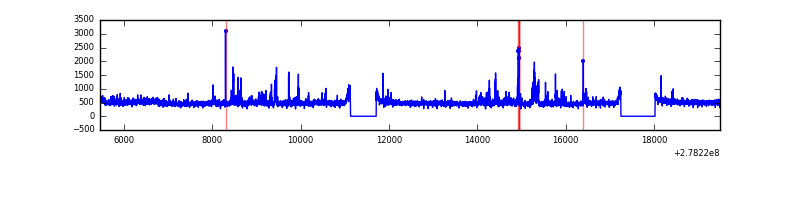 |
| C | 14032 | 12674 | 1 | 1 | 0.01% | 0.01% | 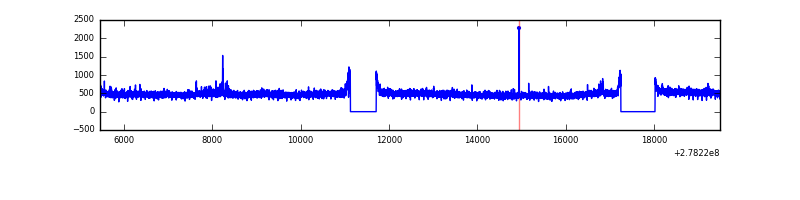 |
| D | 14032 | 12673 | 208 | 208 | 1.48% | 1.64% | 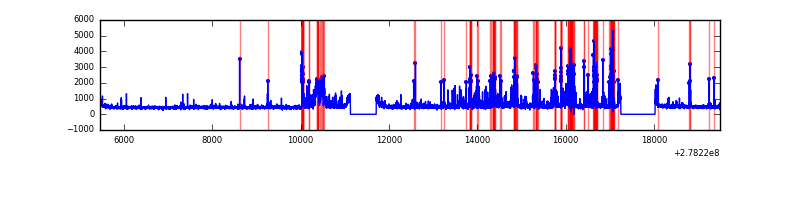 |
Top three noisy pixels from each quadrant. If the there are fewer than three noisy pixels in the level2.evt file, extra rows are filled as -1
| Pixel properties | Quadrant properties | ||||||
|---|---|---|---|---|---|---|---|
| Quadrant | DetID | PixID | Counts | Sigma | Mean | Median | Sigma |
| A | 3 | 1 | 144914 | 468.19 | 1511 | 1475 | 306.4 |
| A | 12 | 96 | 58582 | 186.4 | 1511 | 1475 | 306.4 |
| A | 0 | 226 | 13074 | 37.86 | 1511 | 1475 | 306.4 |
| B | 15 | 35 | 213166 | 724.47 | 1515 | 1472 | 292.2 |
| B | 0 | 214 | 103676 | 349.77 | 1515 | 1472 | 292.2 |
| B | 0 | 190 | 76525 | 256.85 | 1515 | 1472 | 292.2 |
| C | 14 | 238 | 221635 | 640.95 | 1456 | 1463 | 343.5 |
| C | 3 | 233 | 177288 | 511.85 | 1456 | 1463 | 343.5 |
| C | 7 | 247 | 28697 | 79.28 | 1456 | 1463 | 343.5 |
| D | 1 | 52 | 1674628 | 4649.37 | 1468 | 1423 | 359.9 |
| D | 5 | 222 | 63267 | 171.85 | 1468 | 1423 | 359.9 |
| D | 2 | 234 | 49117 | 132.53 | 1468 | 1423 | 359.9 |
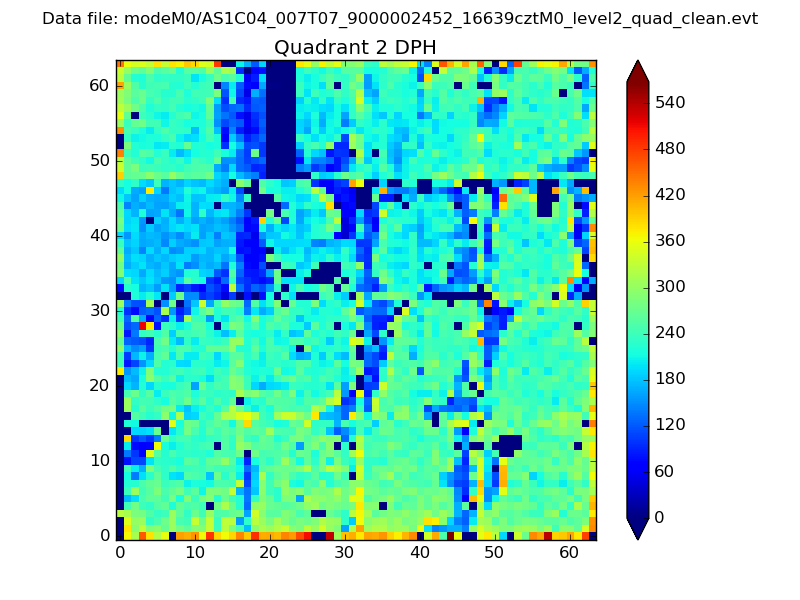
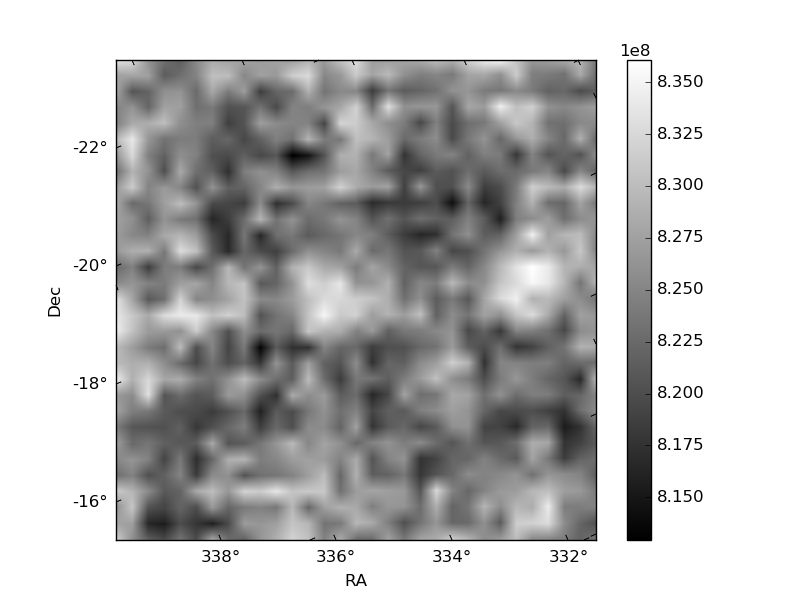
Histogram calculated using DETX and DETY for each event in the final _common_clean file
| Quadrant A | 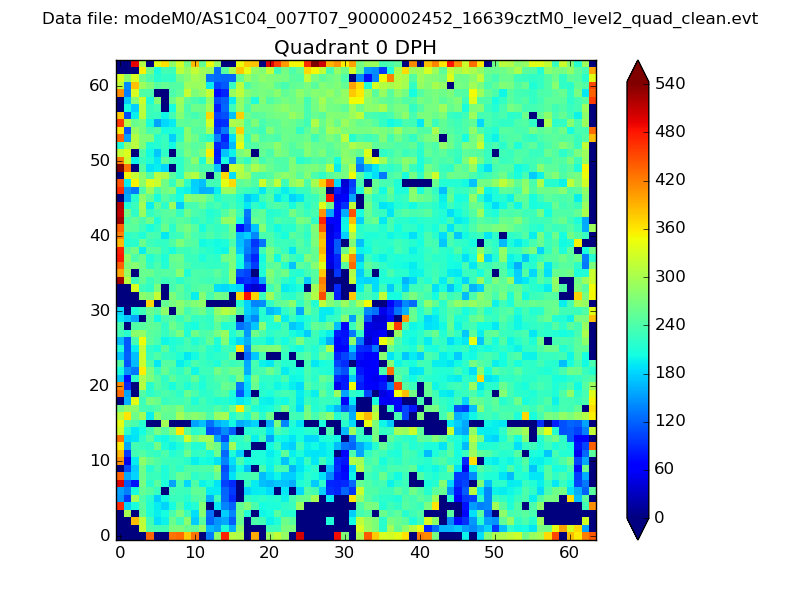 |
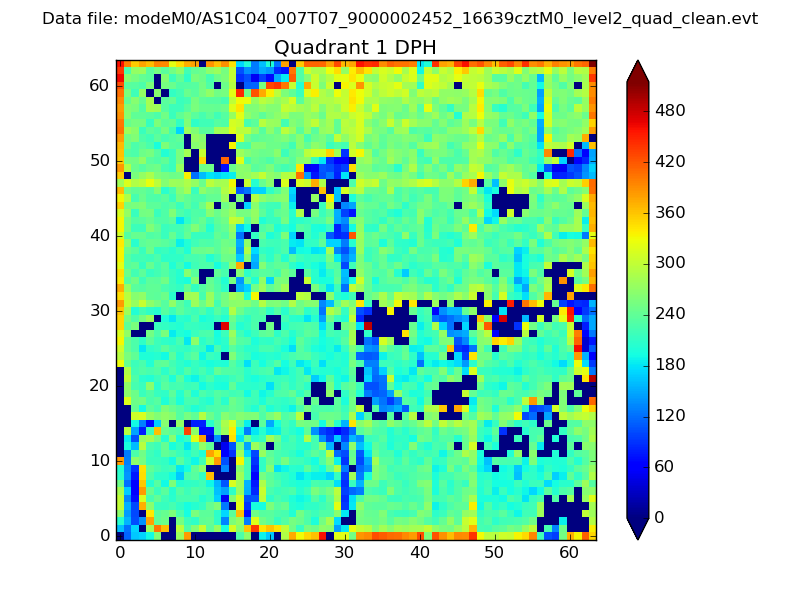 |
Quadrant B |
|---|---|---|---|
| Quadrant D | 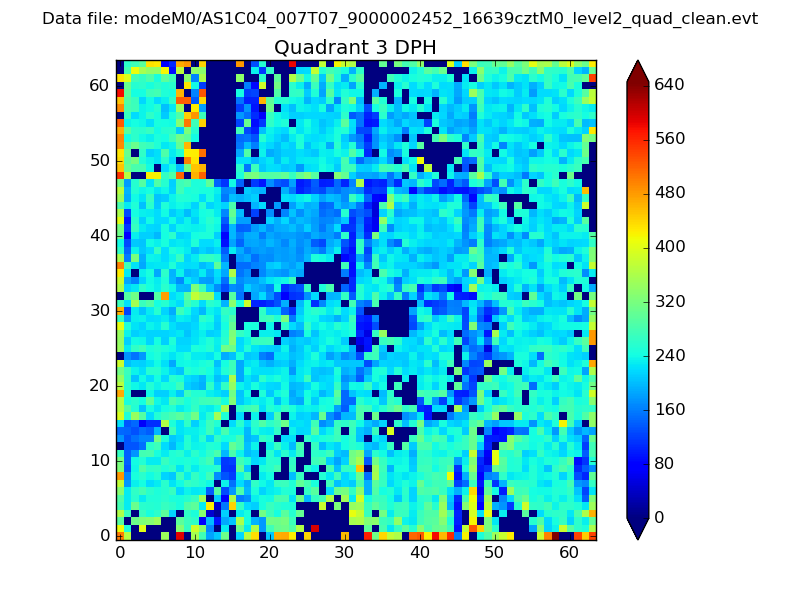 |
 |
Quadrant C |
| Plot type | Count rate plots | Images |
|---|---|---|
| Comparison with Poisson distribution Blue bars denote a histogram of data divided into 1 sec bins. Red curve is a Poisson curve with rate = median count rate of data. |
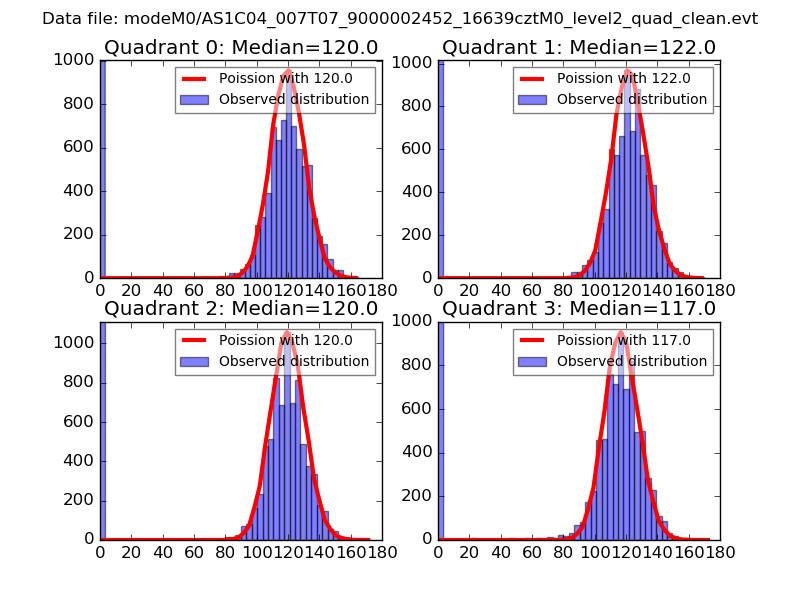 |
 |
| Quadrant-wise count rates Data is divided into 100 sec bins |
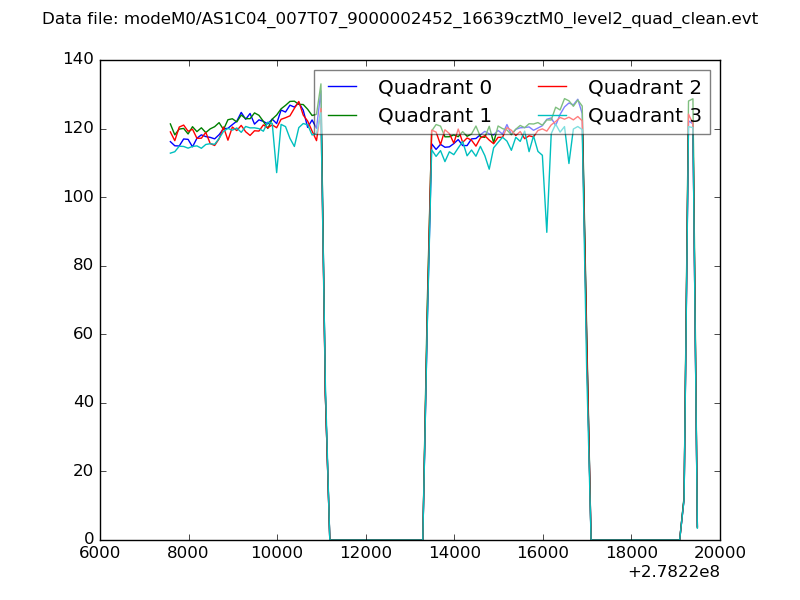 |
|
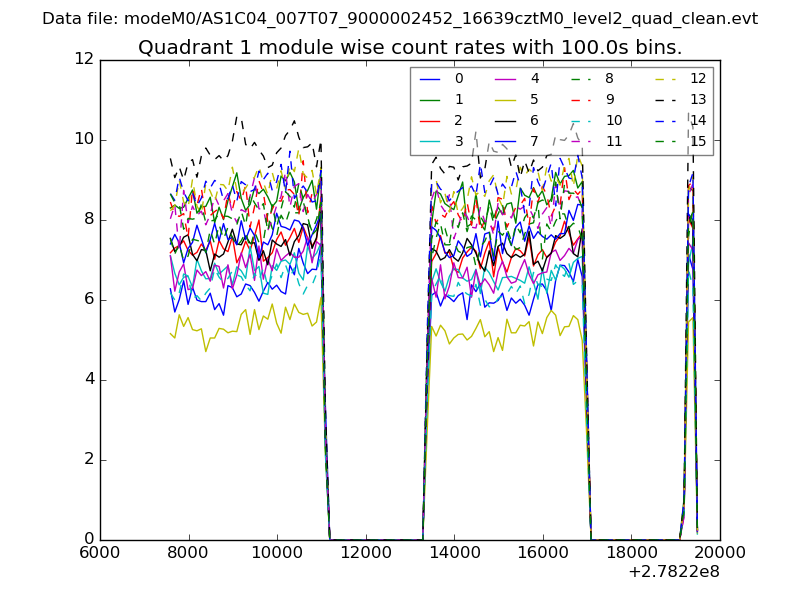
| Module-wise count rates for Quadrant A Data is divided into 100 sec bins |
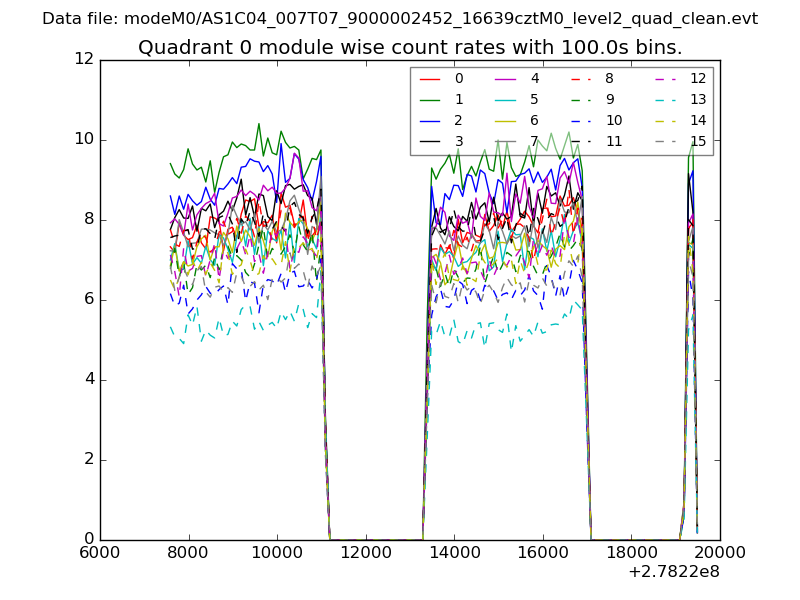 |
 |
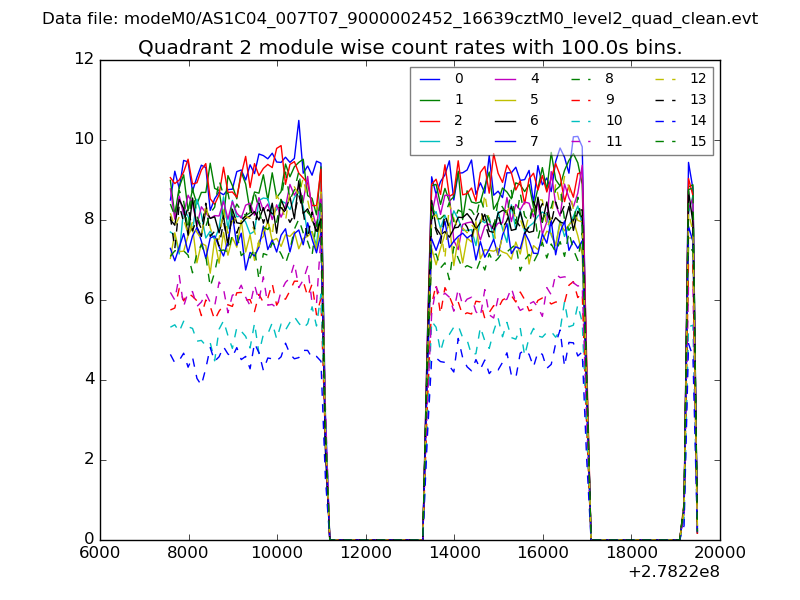
| Module-wise count rates for Quadrant B Data is divided into 100 sec bins |
 |
 |
| Module-wise count rates for Quadrant C Data is divided into 100 sec bins |
 |
 |
| Module-wise count rates for Quadrant D Data is divided into 100 sec bins |
 |
 |
| Parameter | Plot |
|---|---|
| CZT HV Monitor | 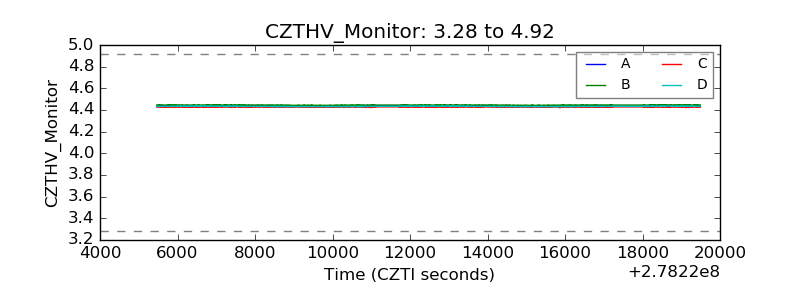 |
| D_VDD | 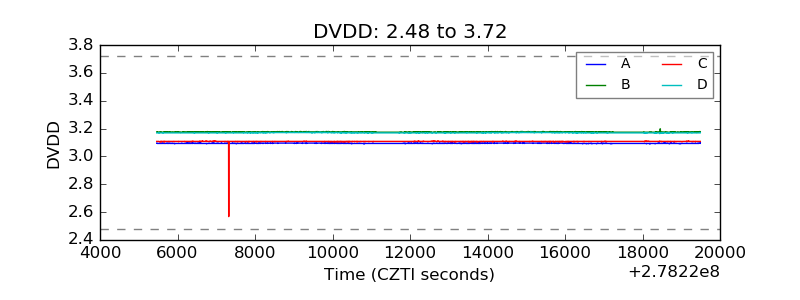 |
| Temperature 1 |  |
| Veto HV Monitor | 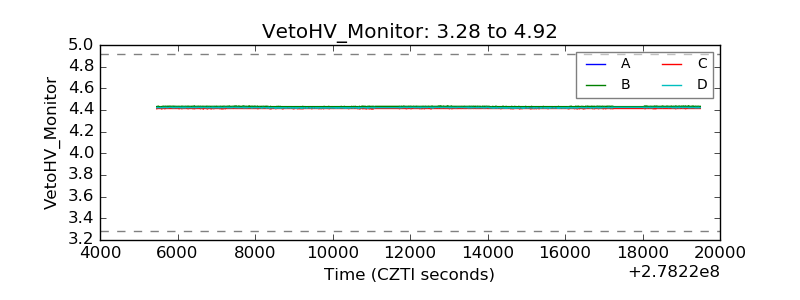 |
| Veto LLD | 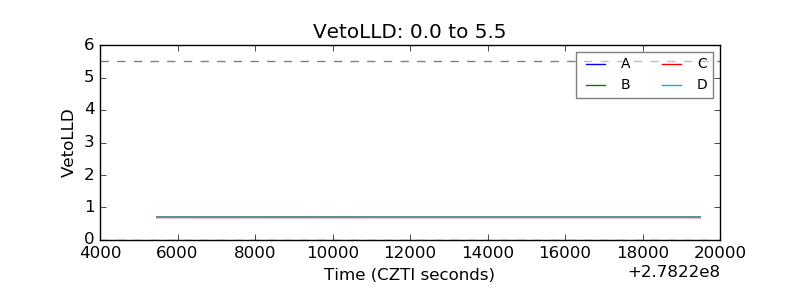 |
| Alpha Counter | 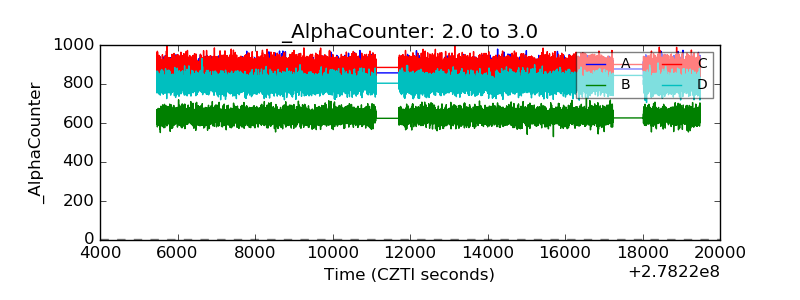 |
| _CPM_Rate | 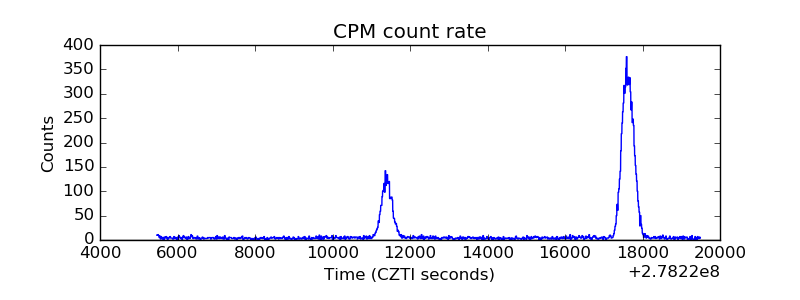 |
| CZT Counter | 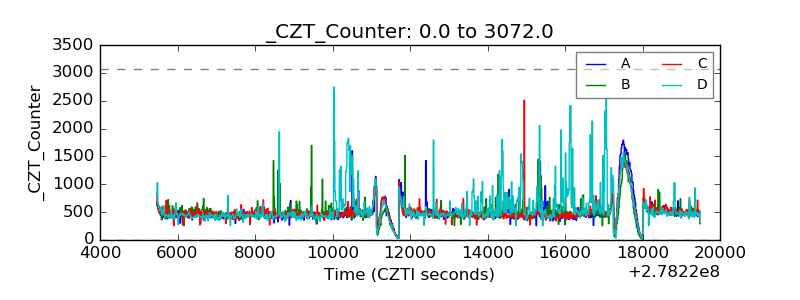 |
| +2.5 Volts monitor |  |
| +5 Volts monitor | 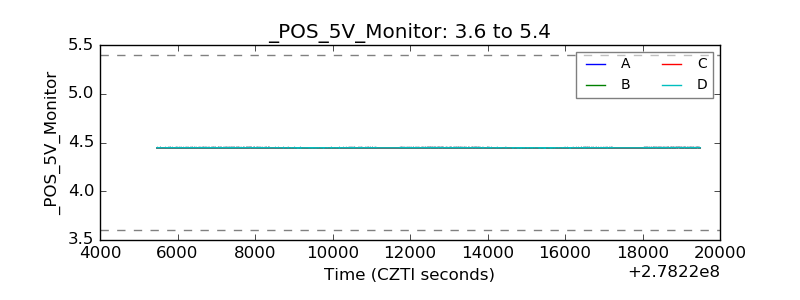 |
| _ROLL_ROT | 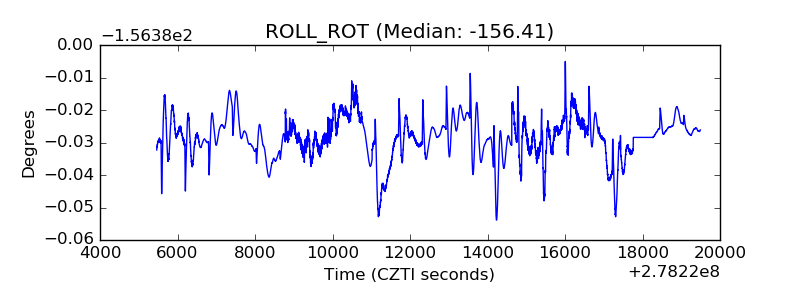 |
| _Roll_DEC |  |
| _Roll_RA | 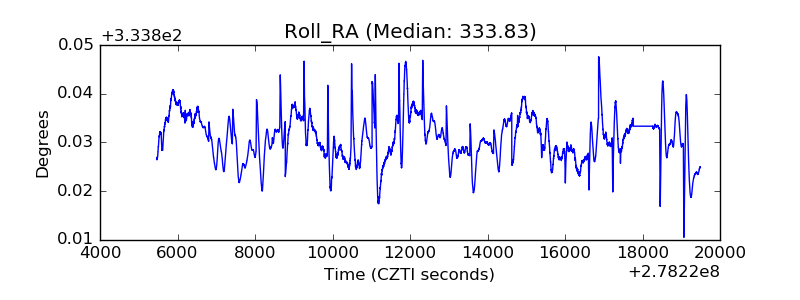 |
| Veto Counter | 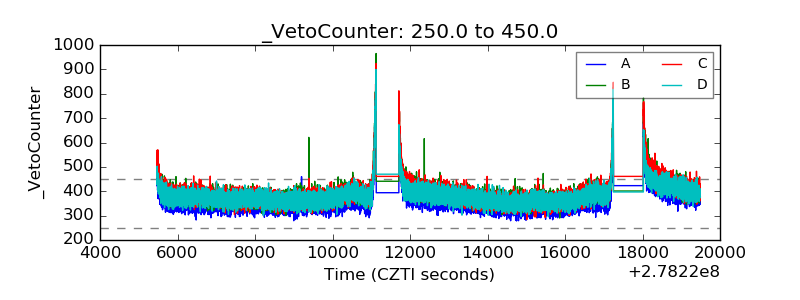 |