| Param | Original file | Final file |
|---|---|---|
| Filename | modeM0/AS1A05_078T01_9000002462cztM0_level2.fits | modeM0/AS1A05_078T01_9000002462cztM0_level2_quad_clean.evt |
| Size (bytes) | 954,524,160 | 1,273,996,800 |
| Size | 910.3 MB | 1.2 GB |
| Events in quadrant A | 5,814,008 | 8,164,237 |
| Events in quadrant B | 5,651,702 | 8,399,674 |
| Events in quadrant C | 5,716,614 | 8,014,016 |
| Events in quadrant D | 4,886,700 | 7,175,118 |
| Mode M0 | |||
|---|---|---|---|
| Quadrant | BADHDUFLAG | Total packets | Discarded packets |
| A | 0 | 234948 | 0 |
| B | 0 | 226557 | 0 |
| C | 0 | 211021 | 0 |
| D | 0 | 290639 | 0 |
| Mode SS | |||
|---|---|---|---|
| Quadrant | BADHDUFLAG | Total packets | Discarded packets |
| A | 0 | 2036 | 0 |
| B | 0 | 2036 | 0 |
| C | 0 | 2036 | 0 |
| D | 0 | 2036 | 0 |
| Mode M9 | |||
|---|---|---|---|
| Quadrant | BADHDUFLAG | Total packets | Discarded packets |
| A | 0 | 171 | 0 |
| B | 0 | 171 | 0 |
| C | 0 | 171 | 0 |
| D | 0 | 171 | 0 |
| Quadrant | Total seconds | Saturated seconds | Saturation percentage |
|---|---|---|---|
| A | 99719 | 4099 | 4.110551% |
| B | 99719 | 1739 | 1.743900% |
| C | 99719 | 1482 | 1.486176% |
| D | 99719 | 4977 | 4.991025% |
Noise dominated data is calculated using 1-second bins in cleaned event files. If a bin has >2000 counts, and if more than 50% of those come from <1% of pixels, then it is considered to be noise-dominated and hence unusable.
| Quadrant | # 1 sec bins | Bins with >0 counts | Bins with >2000 counts | High rate bins dominated by noise | Noise dominated (total time) | Noise dominated (detector-on time) | Marked lightcurve |
|---|---|---|---|---|---|---|---|
| A | 117004 | 99581 | 0 | 0 | 0.00% | 0.00% |  |
| B | 117004 | 99718 | 0 | 0 | 0.00% | 0.00% |  |
| C | 117004 | 99720 | 0 | 0 | 0.00% | 0.00% |  |
| D | 117004 | 99709 | 0 | 0 | 0.00% | 0.00% |  |
Top three noisy pixels from each quadrant. If the there are fewer than three noisy pixels in the level2.evt file, extra rows are filled as -1
| Pixel properties | Quadrant properties | ||||||
|---|---|---|---|---|---|---|---|
| Quadrant | DetID | PixID | Counts | Sigma | Mean | Median | Sigma |
| A | 0 | 29 | 5561 | 11.04 | 1515 | 1427 | 374.6 |
| A | 7 | 110 | 4827 | 9.08 | 1515 | 1427 | 374.6 |
| A | 0 | 30 | 4524 | 8.27 | 1515 | 1427 | 374.6 |
| B | 2 | 9 | 4579 | 10.89 | 1499 | 1441 | 288.3 |
| B | 2 | 8 | 3823 | 8.26 | 1499 | 1441 | 288.3 |
| B | 14 | 254 | 3618 | 7.55 | 1499 | 1441 | 288.3 |
| C | 12 | 241 | 4094 | 6.93 | 1511 | 1413 | 386.8 |
| C | 2 | 191 | 3913 | 6.46 | 1511 | 1413 | 386.8 |
| C | 3 | 126 | 3822 | 6.23 | 1511 | 1413 | 386.8 |
| D | 6 | 67 | 3579 | 6.2 | 1396 | 1275 | 371.5 |
| D | 10 | 189 | 3554 | 6.13 | 1396 | 1275 | 371.5 |
| D | 3 | 14 | 3490 | 5.96 | 1396 | 1275 | 371.5 |
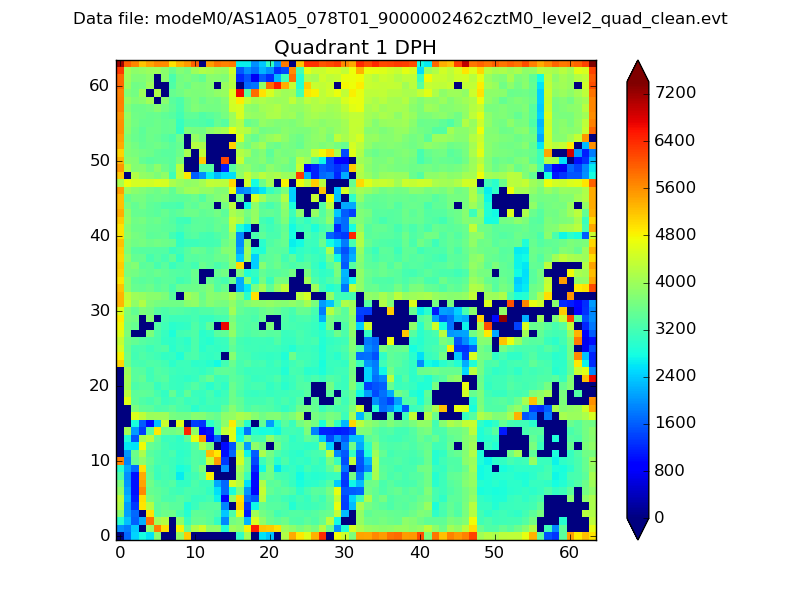
Histogram calculated using DETX and DETY for each event in the final _common_clean file
| Quadrant A |  |
 |
Quadrant B |
|---|---|---|---|
| Quadrant D | 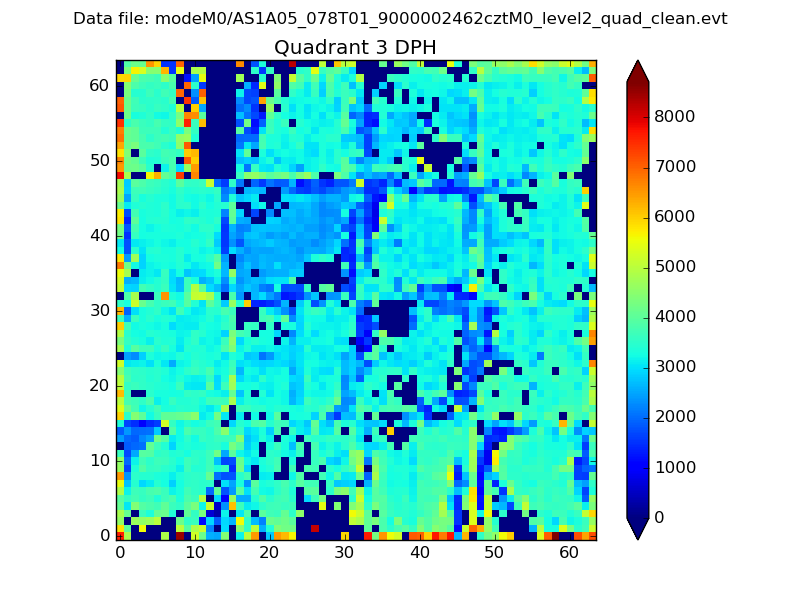 |
 |
Quadrant C |
| Plot type | Count rate plots | Images |
|---|---|---|
| Comparison with Poisson distribution Blue bars denote a histogram of data divided into 1 sec bins. Red curve is a Poisson curve with rate = median count rate of data. |
 |
 |
| Quadrant-wise count rates Data is divided into 100 sec bins |
 |
|
| Module-wise count rates for Quadrant A Data is divided into 100 sec bins |
 |
 |
| Module-wise count rates for Quadrant B Data is divided into 100 sec bins |
 |
 |
| Module-wise count rates for Quadrant C Data is divided into 100 sec bins |
 |
 |
| Module-wise count rates for Quadrant D Data is divided into 100 sec bins |
 |
 |
| Parameter | Plot |
|---|---|
| CZT HV Monitor |  |
| D_VDD |  |
| Temperature 1 |  |
| Veto HV Monitor |  |
| Veto LLD |  |
| Alpha Counter |  |
| _CPM_Rate |  |
| CZT Counter |  |
| +2.5 Volts monitor |  |
| +5 Volts monitor |  |
| _ROLL_ROT |  |
| _Roll_DEC |  |
| _Roll_RA |  |
| Veto Counter |  |