| Param | Original file | Final file |
|---|---|---|
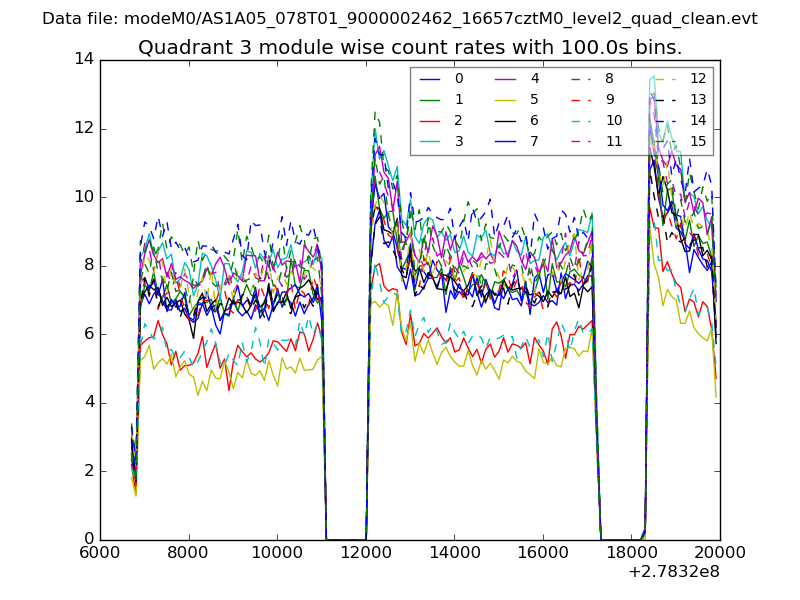
| Filename | modeM0/AS1A05_078T01_9000002462_16657cztM0_level2.evt | modeM0/AS1A05_078T01_9000002462_16657cztM0_level2_quad_clean.evt |
| Size (bytes) | 881,729,280 | 215,663,040 |
| Size | 840.9 MB | 205.7 MB |
| Events in quadrant A | 5,676,234 | 1,467,566 |
| Events in quadrant B | 5,997,517 | 1,492,212 |
| Events in quadrant C | 5,775,339 | 1,435,877 |
| Events in quadrant D | 8,503,921 | 1,368,499 |
| Mode M0 | |||
|---|---|---|---|
| Quadrant | BADHDUFLAG | Total packets | Discarded packets |
| A | 0 | 24430 | 3 |
| B | 0 | 25091 | 2 |
| C | 0 | 24455 | 2 |
| D | 0 | 33161 | 2 |
| Mode SS | |||
|---|---|---|---|
| Quadrant | BADHDUFLAG | Total packets | Discarded packets |
| A | 0 | 224 | 0 |
| B | 0 | 224 | 0 |
| C | 0 | 224 | 0 |
| D | 0 | 224 | 0 |
| Mode M9 | |||
|---|---|---|---|
| Quadrant | BADHDUFLAG | Total packets | Discarded packets |
| A | 0 | 22 | 0 |
| B | 0 | 22 | 0 |
| C | 0 | 22 | 0 |
| D | 0 | 22 | 0 |
| Quadrant | Total seconds | Saturated seconds | Saturation percentage |
|---|---|---|---|
| A | 11107 | 180 | 1.620600% |
| B | 11107 | 137 | 1.233456% |
| C | 11107 | 169 | 1.521563% |
| D | 11107 | 512 | 4.609706% |
Noise dominated data is calculated using 1-second bins in cleaned event files. If a bin has >2000 counts, and if more than 50% of those come from <1% of pixels, then it is considered to be noise-dominated and hence unusable.
| Quadrant | # 1 sec bins | Bins with >0 counts | Bins with >2000 counts | High rate bins dominated by noise | Noise dominated (total time) | Noise dominated (detector-on time) | Marked lightcurve |
|---|---|---|---|---|---|---|---|
| A | 13278 | 11110 | 36 | 36 | 0.27% | 0.32% | 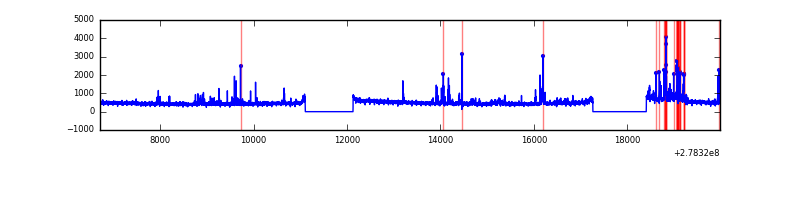 |
| B | 13278 | 11110 | 4 | 4 | 0.03% | 0.04% | 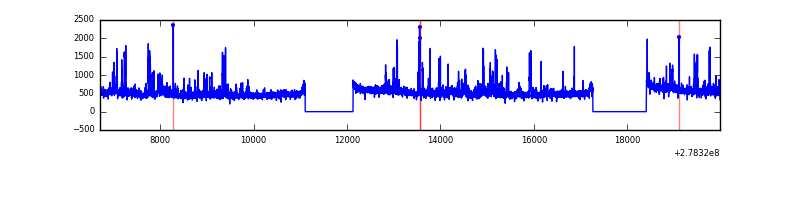 |
| C | 13278 | 11110 | 0 | 0 | 0.00% | 0.00% | 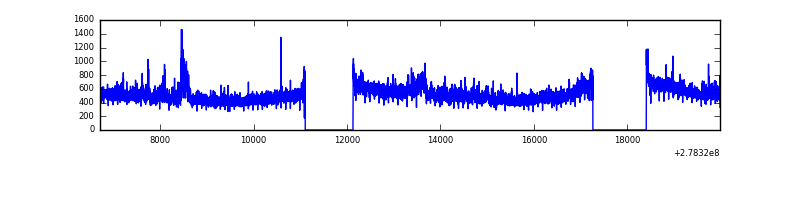 |
| D | 13278 | 11110 | 359 | 359 | 2.70% | 3.23% | 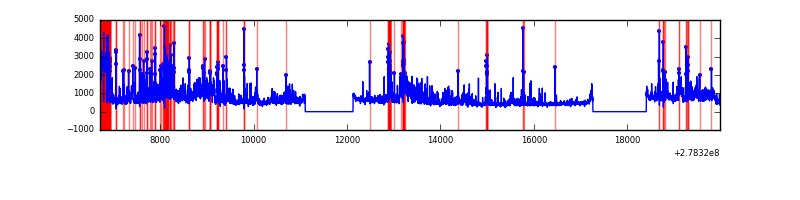 |
Top three noisy pixels from each quadrant. If the there are fewer than three noisy pixels in the level2.evt file, extra rows are filled as -1
| Pixel properties | Quadrant properties | ||||||
|---|---|---|---|---|---|---|---|
| Quadrant | DetID | PixID | Counts | Sigma | Mean | Median | Sigma |
| A | 15 | 174 | 428844 | 1587.64 | 1346 | 1320 | 269.3 |
| A | 9 | 143 | 62812 | 228.36 | 1346 | 1320 | 269.3 |
| A | 0 | 226 | 12060 | 39.88 | 1346 | 1320 | 269.3 |
| B | 15 | 35 | 320406 | 1280.95 | 1343 | 1310 | 249.1 |
| B | 0 | 189 | 116423 | 462.1 | 1343 | 1310 | 249.1 |
| B | 0 | 229 | 74749 | 294.81 | 1343 | 1310 | 249.1 |
| C | 3 | 233 | 552557 | 1872.87 | 1281 | 1286 | 294.3 |
| C | 14 | 238 | 200587 | 677.1 | 1281 | 1286 | 294.3 |
| C | 7 | 247 | 27978 | 90.68 | 1281 | 1286 | 294.3 |
| D | 2 | 16 | 1804122 | 5873.33 | 1279 | 1242 | 307.0 |
| D | 1 | 52 | 703156 | 2286.66 | 1279 | 1242 | 307.0 |
| D | 15 | 0 | 632775 | 2057.38 | 1279 | 1242 | 307.0 |
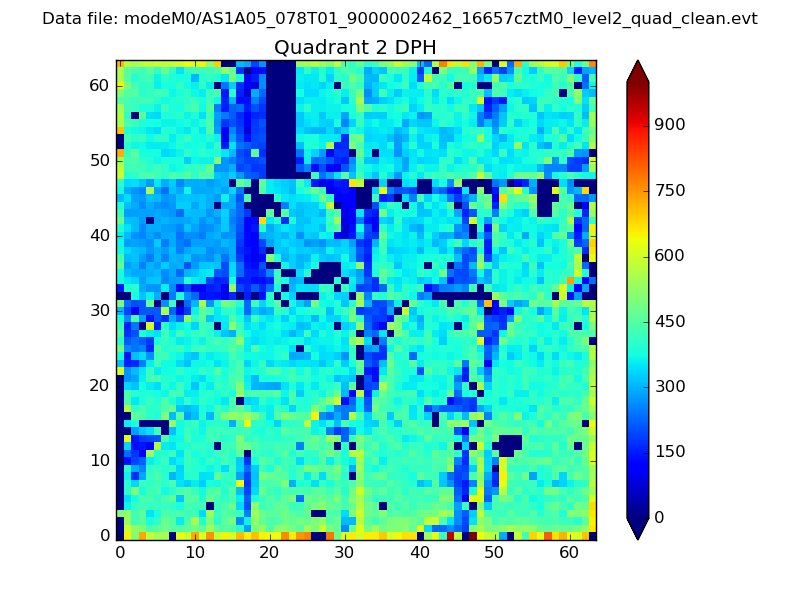
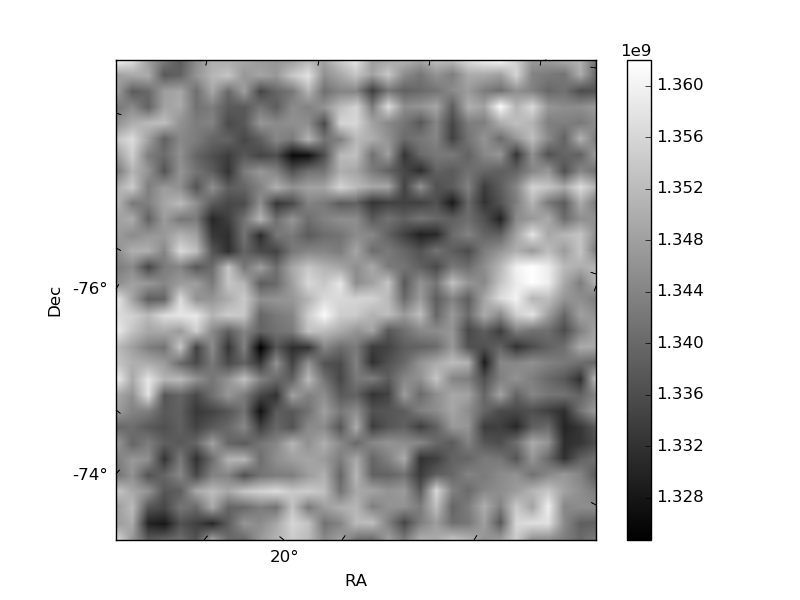
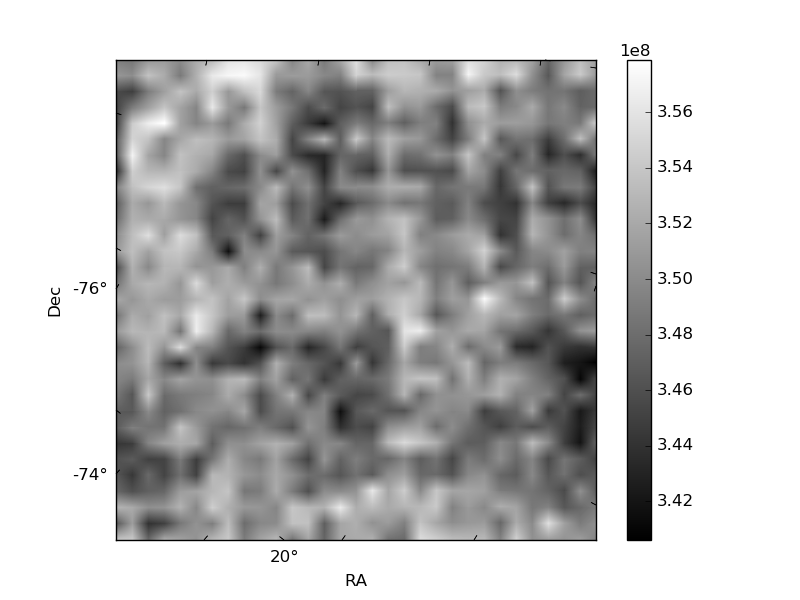
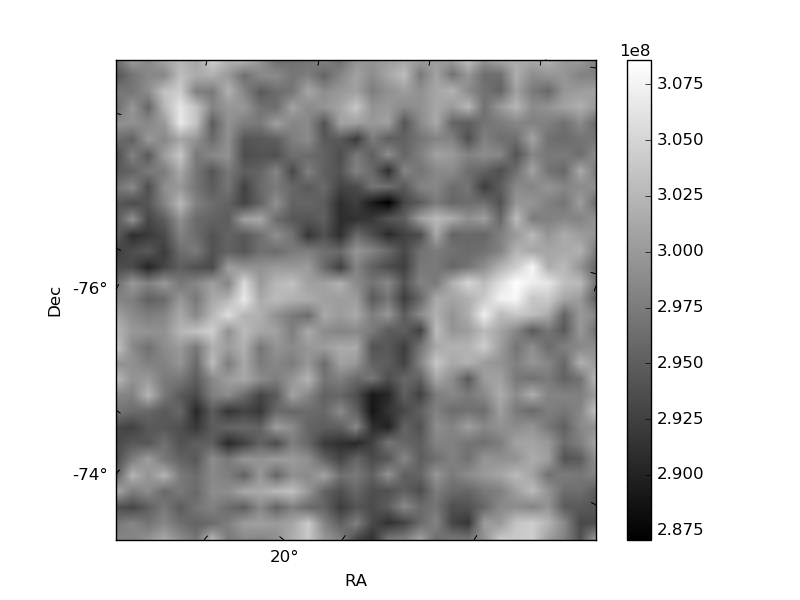
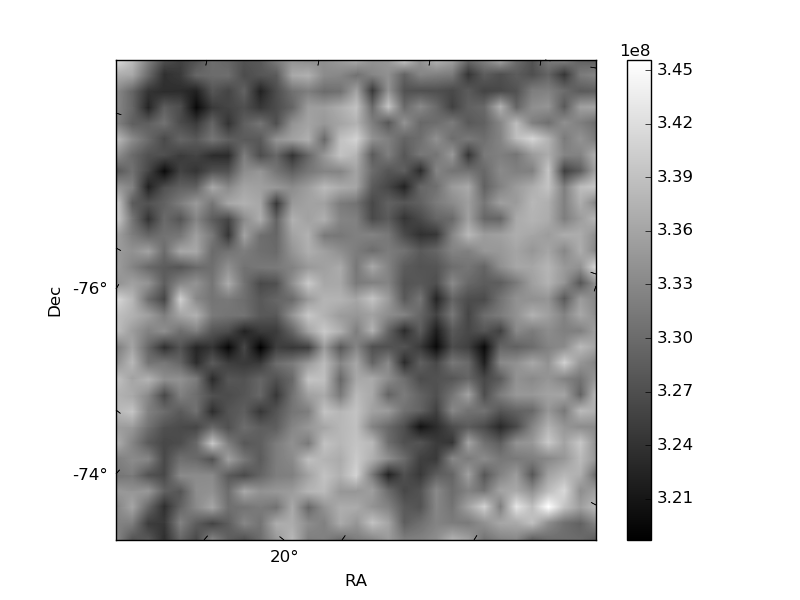
Histogram calculated using DETX and DETY for each event in the final _common_clean file
| Quadrant A | 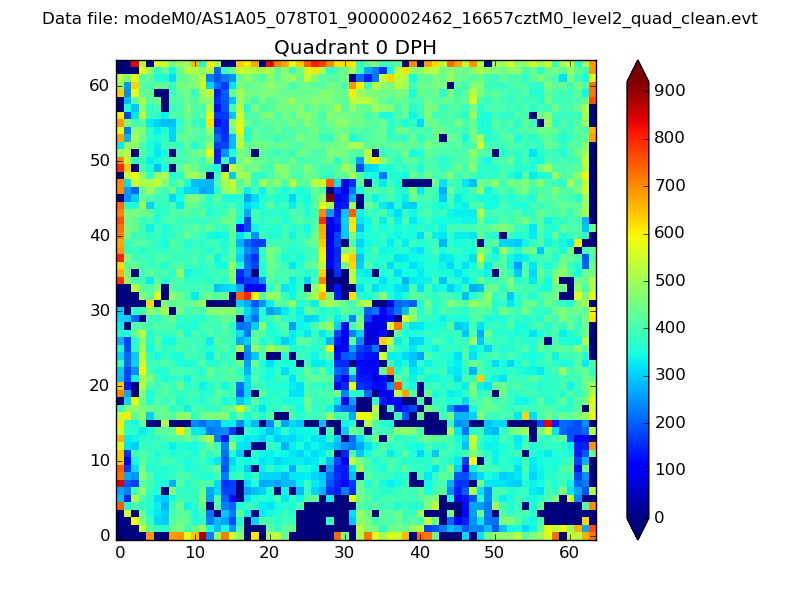 |
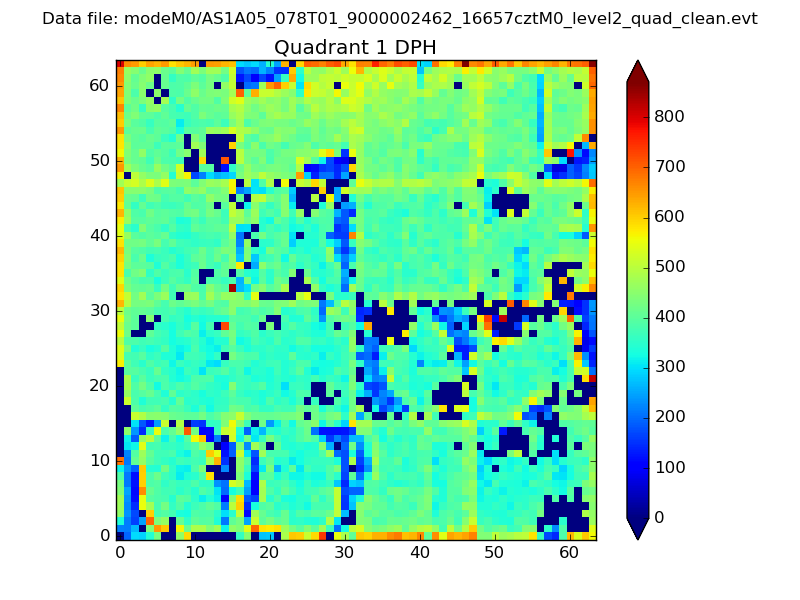 |
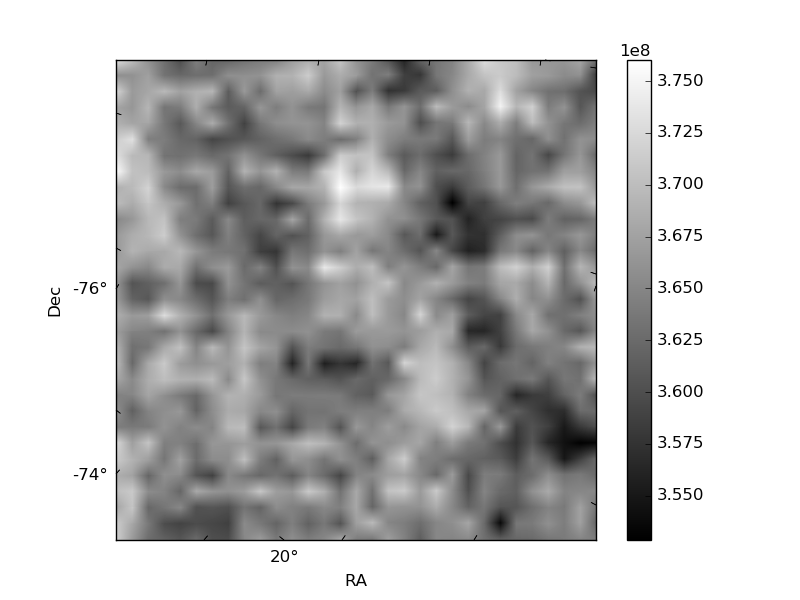
Quadrant B |
|---|---|---|---|
| Quadrant D | 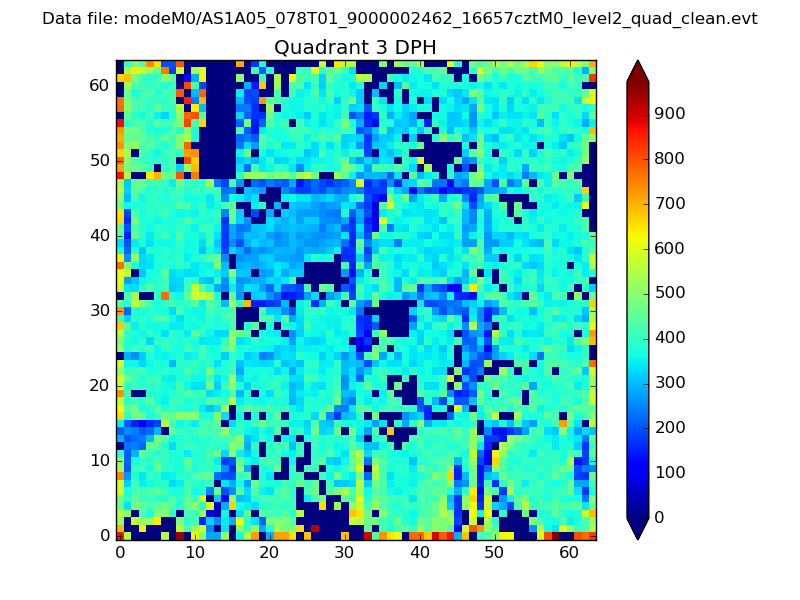 |
 |
Quadrant C |
| Plot type | Count rate plots | Images |
|---|---|---|
| Comparison with Poisson distribution Blue bars denote a histogram of data divided into 1 sec bins. Red curve is a Poisson curve with rate = median count rate of data. |
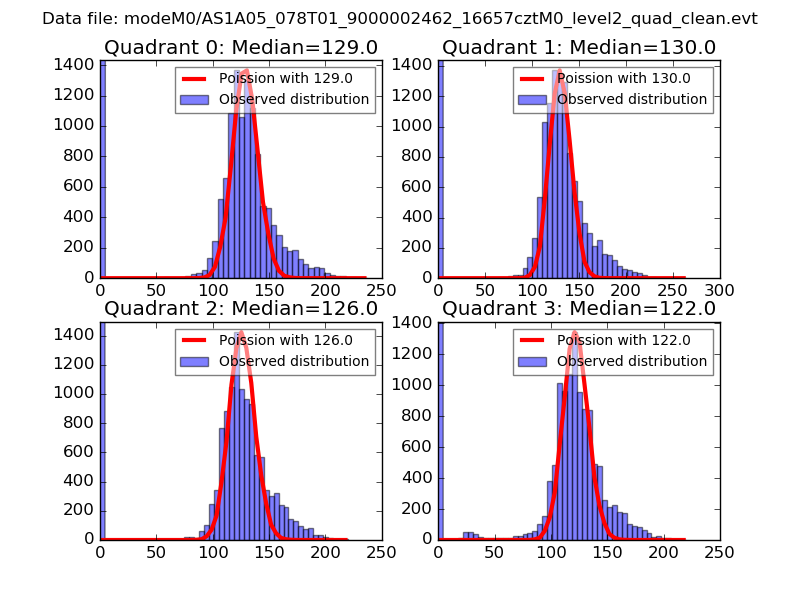 |
 |
| Quadrant-wise count rates Data is divided into 100 sec bins |
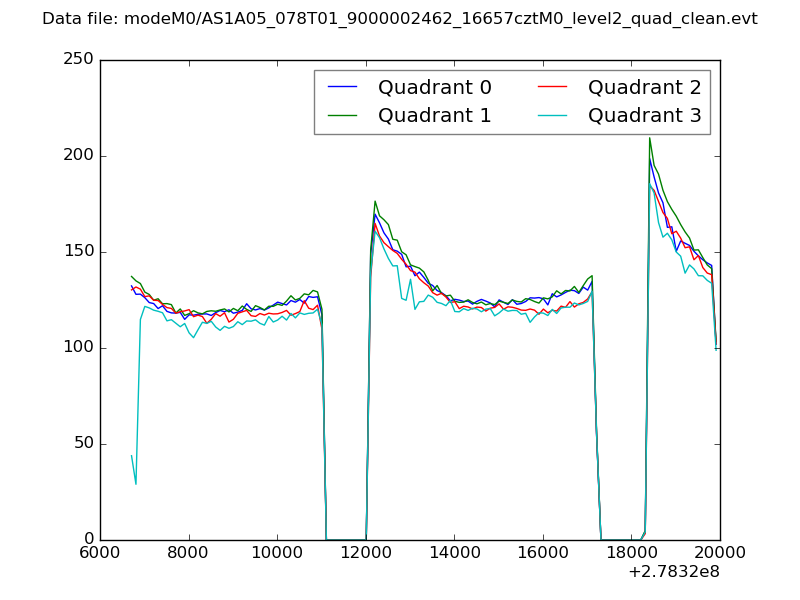 |
|
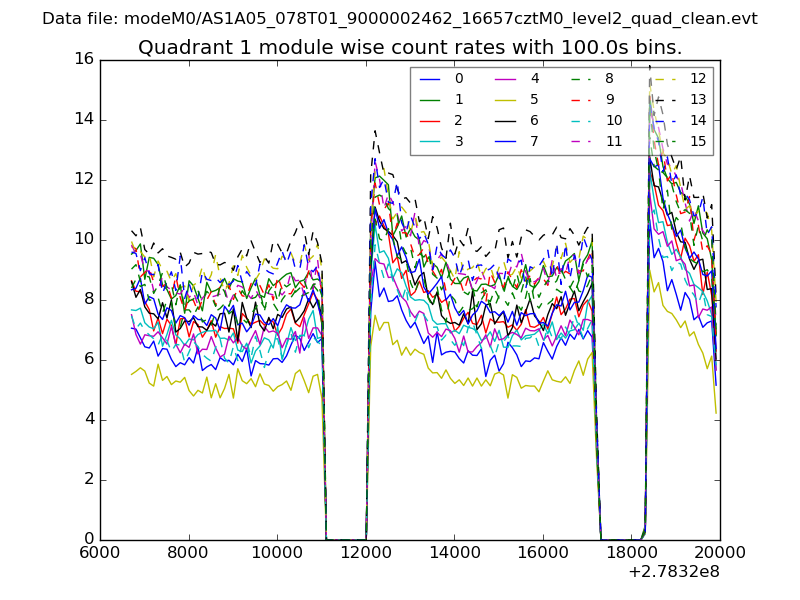
| Module-wise count rates for Quadrant A Data is divided into 100 sec bins |
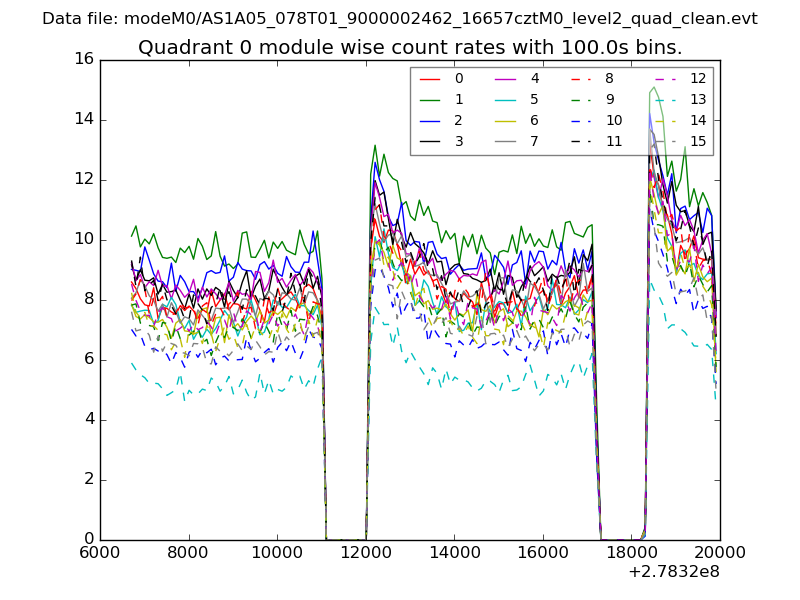 |
 |
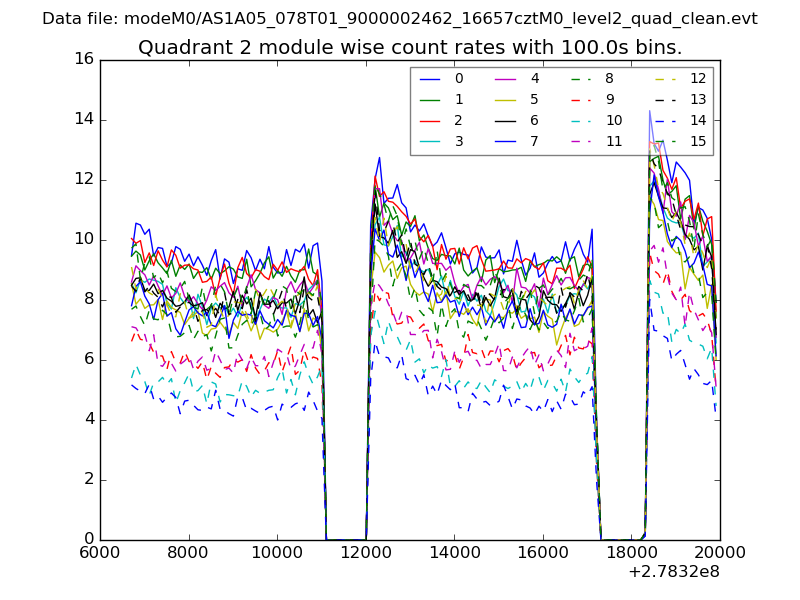
| Module-wise count rates for Quadrant B Data is divided into 100 sec bins |
 |
 |
| Module-wise count rates for Quadrant C Data is divided into 100 sec bins |
 |
 |
| Module-wise count rates for Quadrant D Data is divided into 100 sec bins |
 |
 |
| Parameter | Plot |
|---|---|
| CZT HV Monitor | 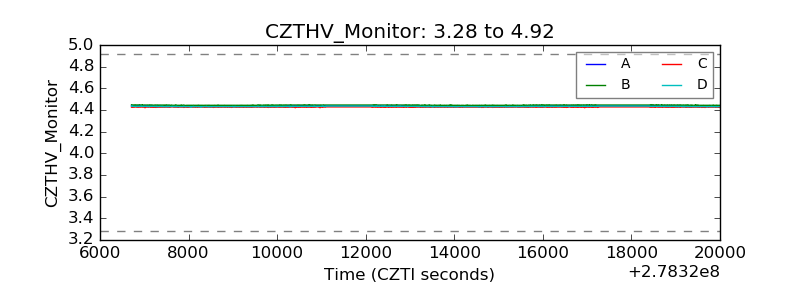 |
| D_VDD | 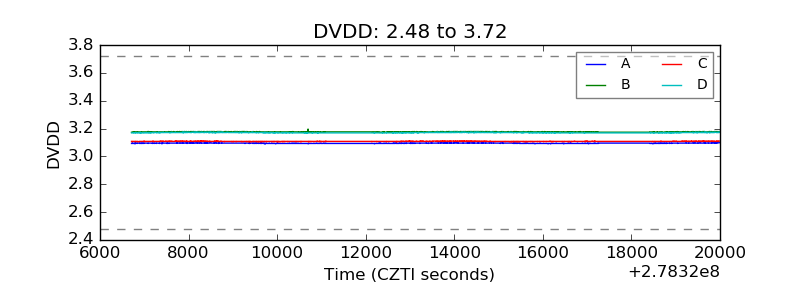 |
| Temperature 1 | 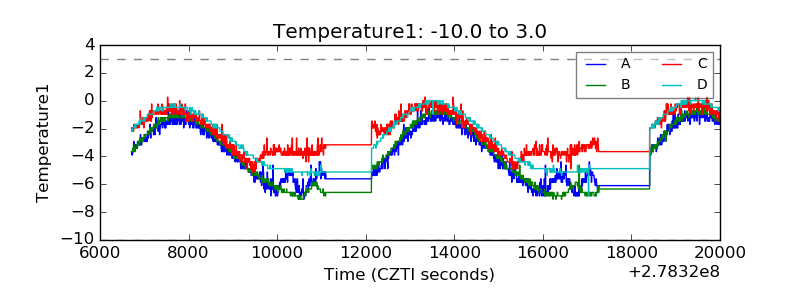 |
| Veto HV Monitor | 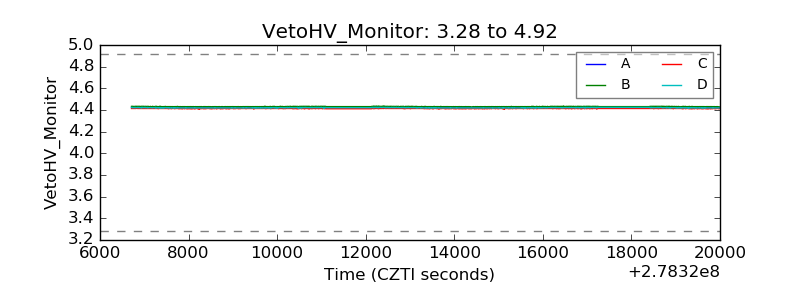 |
| Veto LLD |  |
| Alpha Counter | 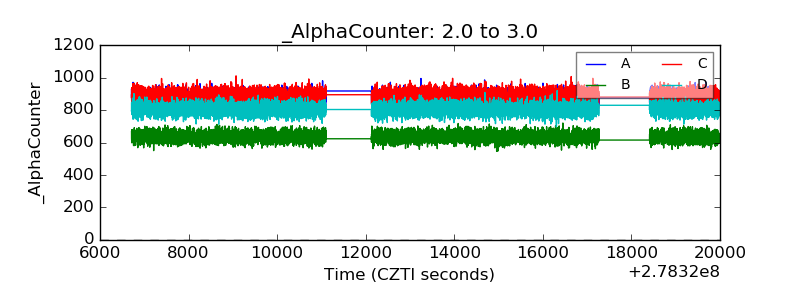 |
| _CPM_Rate | 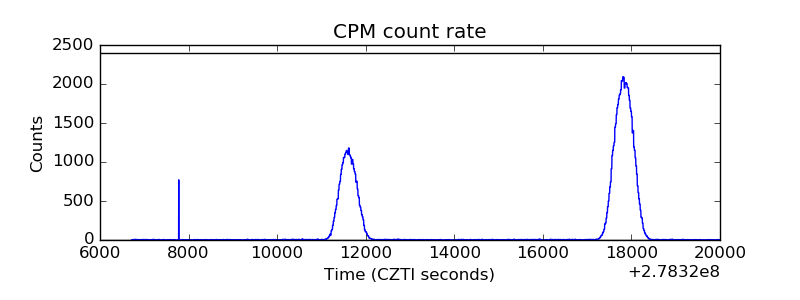 |
| CZT Counter | 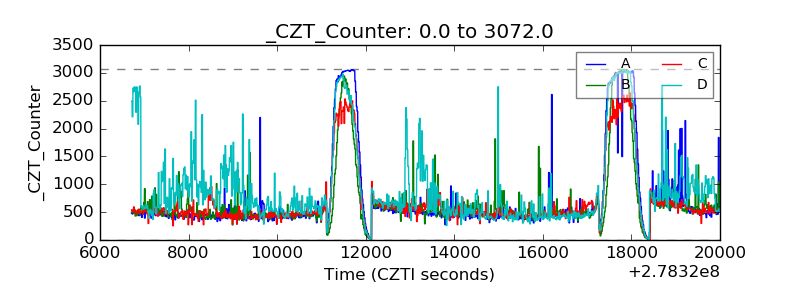 |
| +2.5 Volts monitor |  |
| +5 Volts monitor |  |
| _ROLL_ROT | 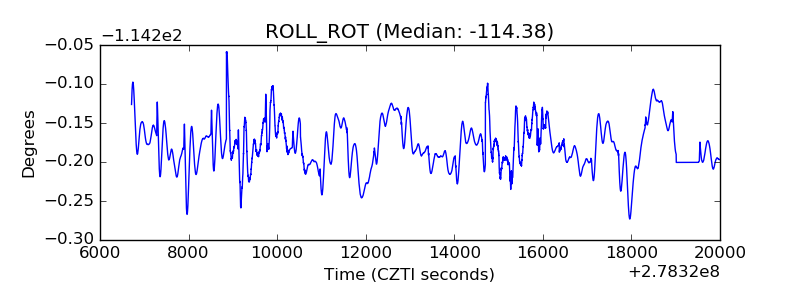 |
| _Roll_DEC | 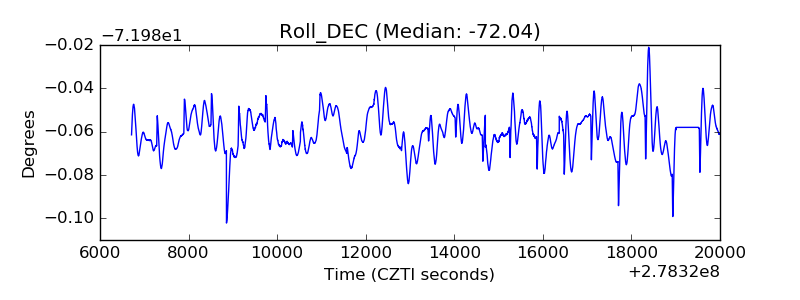 |
| _Roll_RA | 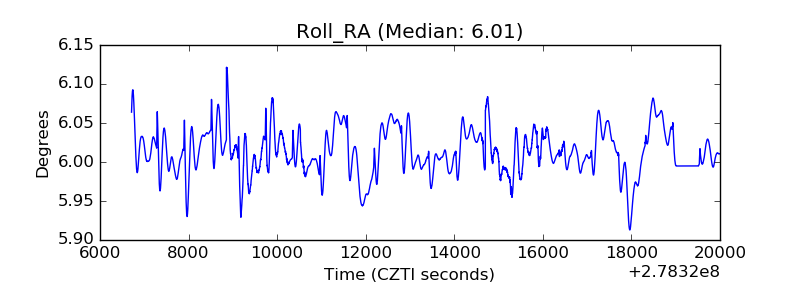 |
| Veto Counter | 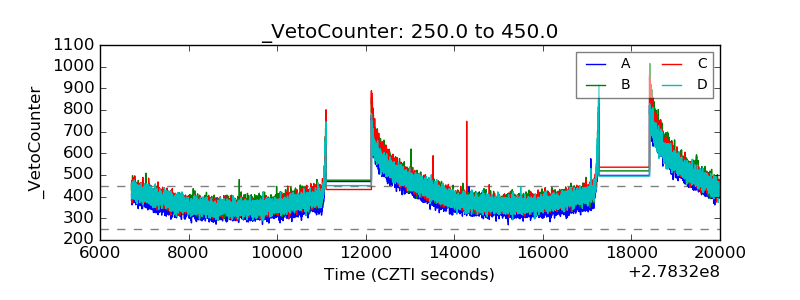 |