| Param | Original file | Final file |
|---|---|---|
| Filename | modeM0/AS1A05_078T01_9000002462_16659cztM0_level2.evt | modeM0/AS1A05_078T01_9000002462_16659cztM0_level2_quad_clean.evt |
| Size (bytes) | 472,138,560 | 127,886,400 |
| Size | 450.3 MB | 122.0 MB |
| Events in quadrant A | 3,121,723 | 888,017 |
| Events in quadrant B | 3,478,138 | 901,384 |
| Events in quadrant C | 3,053,016 | 846,704 |
| Events in quadrant D | 4,241,312 | 820,847 |
| Mode M0 | |||
|---|---|---|---|
| Quadrant | BADHDUFLAG | Total packets | Discarded packets |
| A | 0 | 13199 | 2 |
| B | 0 | 14294 | 1 |
| C | 0 | 12880 | 1 |
| D | 0 | 16695 | 1 |
| Mode SS | |||
|---|---|---|---|
| Quadrant | BADHDUFLAG | Total packets | Discarded packets |
| A | 0 | 122 | 0 |
| B | 0 | 122 | 0 |
| C | 0 | 122 | 0 |
| D | 0 | 122 | 0 |
| Mode M9 | |||
|---|---|---|---|
| Quadrant | BADHDUFLAG | Total packets | Discarded packets |
| A | 0 | 13 | 0 |
| B | 0 | 13 | 0 |
| C | 0 | 13 | 0 |
| D | 0 | 13 | 0 |
| Quadrant | Total seconds | Saturated seconds | Saturation percentage |
|---|---|---|---|
| A | 5961 | 92 | 1.543365% |
| B | 5961 | 93 | 1.560141% |
| C | 5961 | 81 | 1.358832% |
| D | 5961 | 132 | 2.214394% |
Noise dominated data is calculated using 1-second bins in cleaned event files. If a bin has >2000 counts, and if more than 50% of those come from <1% of pixels, then it is considered to be noise-dominated and hence unusable.
| Quadrant | # 1 sec bins | Bins with >0 counts | Bins with >2000 counts | High rate bins dominated by noise | Noise dominated (total time) | Noise dominated (detector-on time) | Marked lightcurve |
|---|---|---|---|---|---|---|---|
| A | 7287 | 5963 | 22 | 22 | 0.30% | 0.37% | 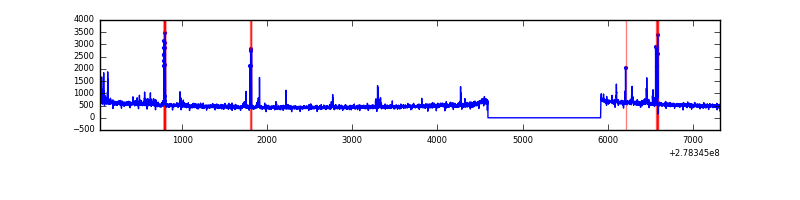 |
| B | 7287 | 5963 | 10 | 10 | 0.14% | 0.17% | 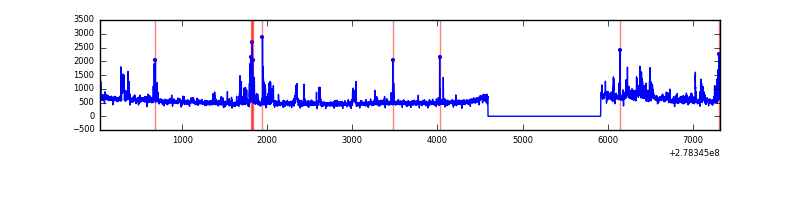 |
| C | 7287 | 5963 | 0 | 0 | 0.00% | 0.00% | 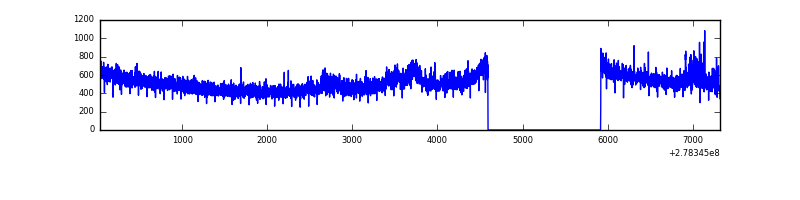 |
| D | 7287 | 5963 | 57 | 57 | 0.78% | 0.96% | 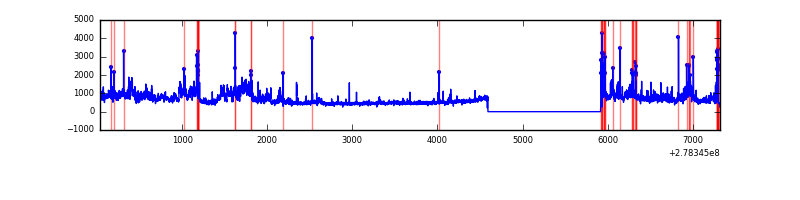 |
Top three noisy pixels from each quadrant. If the there are fewer than three noisy pixels in the level2.evt file, extra rows are filled as -1
| Pixel properties | Quadrant properties | ||||||
|---|---|---|---|---|---|---|---|
| Quadrant | DetID | PixID | Counts | Sigma | Mean | Median | Sigma |
| A | 15 | 174 | 161358 | 1042.06 | 768 | 754 | 154.1 |
| A | 9 | 143 | 7236 | 42.06 | 768 | 754 | 154.1 |
| A | 0 | 226 | 7009 | 40.59 | 768 | 754 | 154.1 |
| B | 15 | 35 | 135875 | 963.09 | 767 | 750 | 140.3 |
| B | 0 | 189 | 124706 | 883.49 | 767 | 750 | 140.3 |
| B | 0 | 198 | 42772 | 299.51 | 767 | 750 | 140.3 |
| C | 14 | 238 | 114708 | 685.88 | 719 | 725 | 166.2 |
| C | 7 | 247 | 68900 | 410.23 | 719 | 725 | 166.2 |
| C | 3 | 233 | 64635 | 384.57 | 719 | 725 | 166.2 |
| D | 1 | 52 | 1223375 | 6933.3 | 729 | 709 | 176.3 |
| D | 10 | 70 | 145893 | 823.29 | 729 | 709 | 176.3 |
| D | 8 | 195 | 26836 | 148.16 | 729 | 709 | 176.3 |
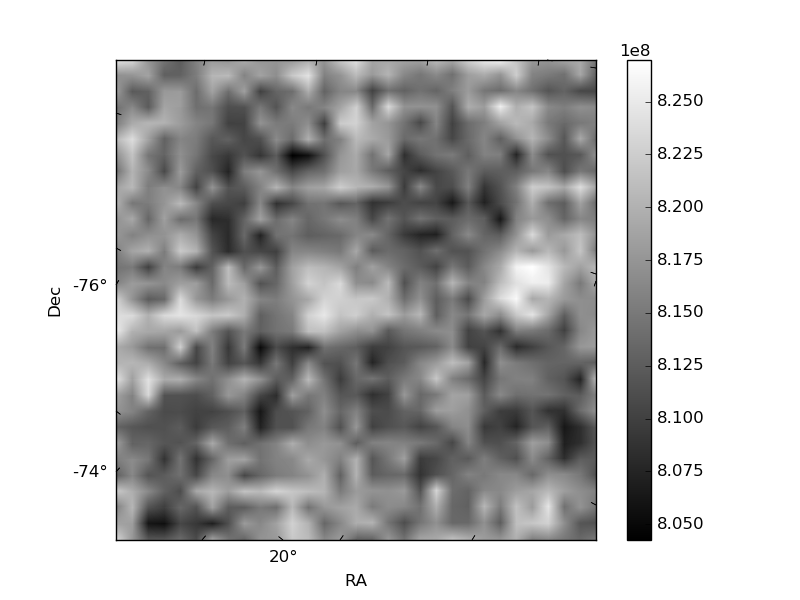
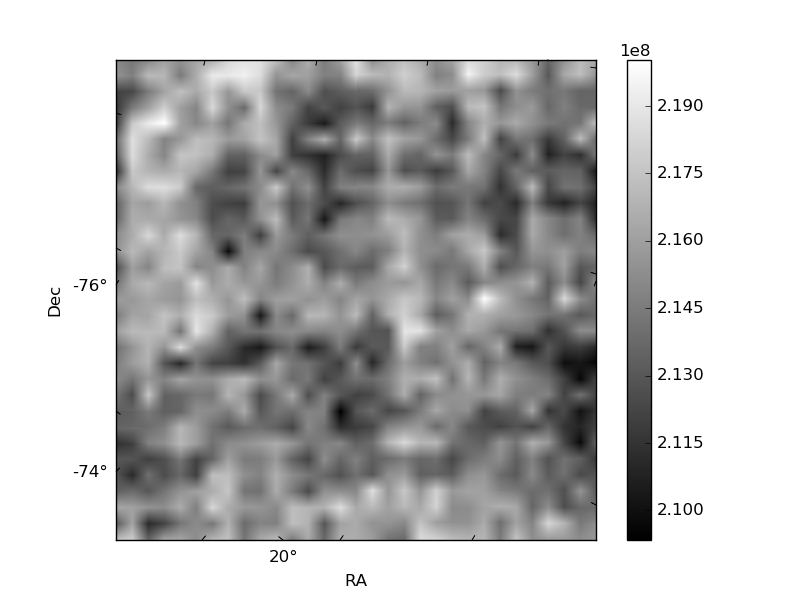
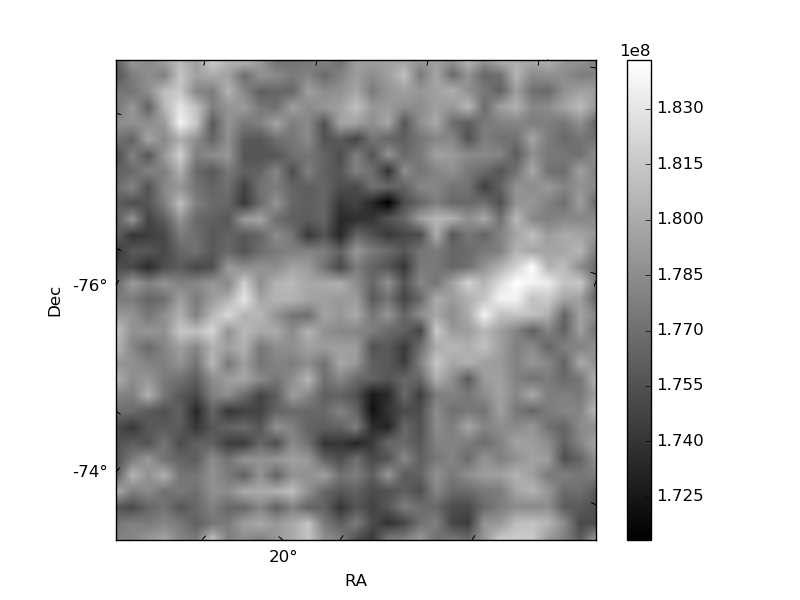
Histogram calculated using DETX and DETY for each event in the final _common_clean file
| Quadrant A | 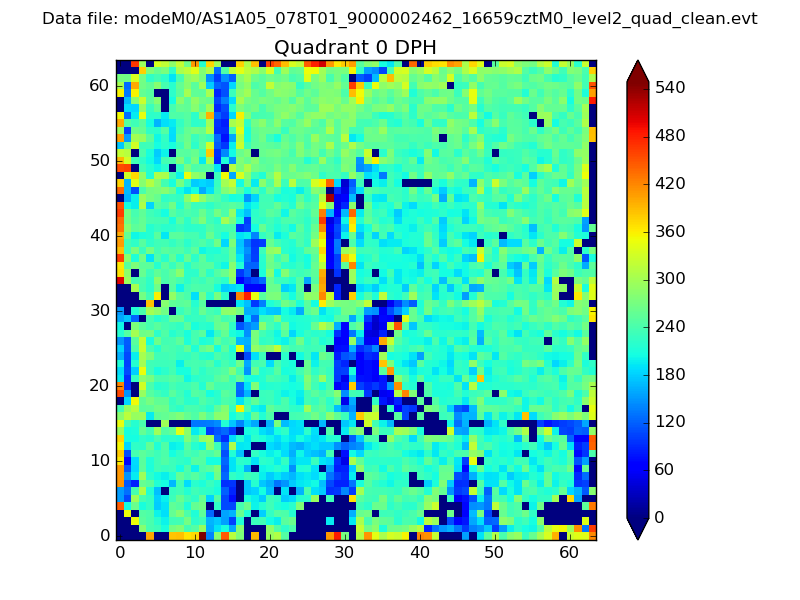 |
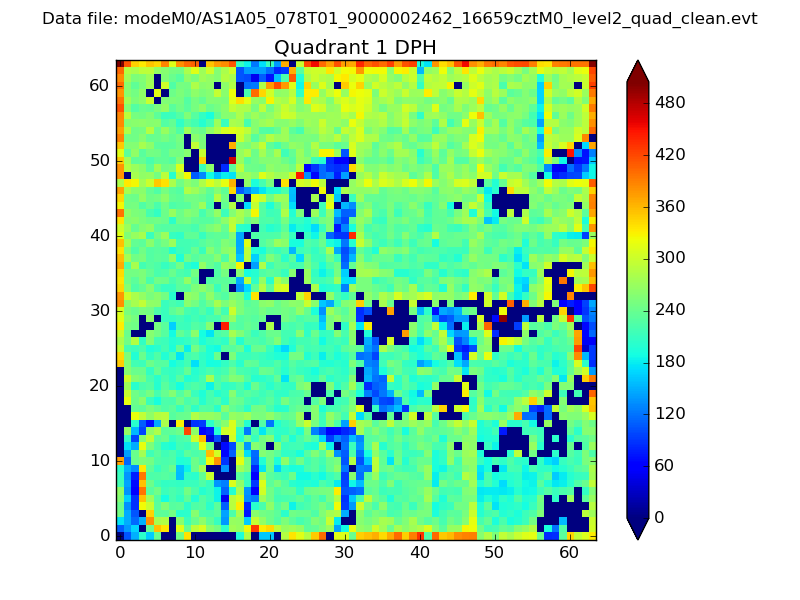 |
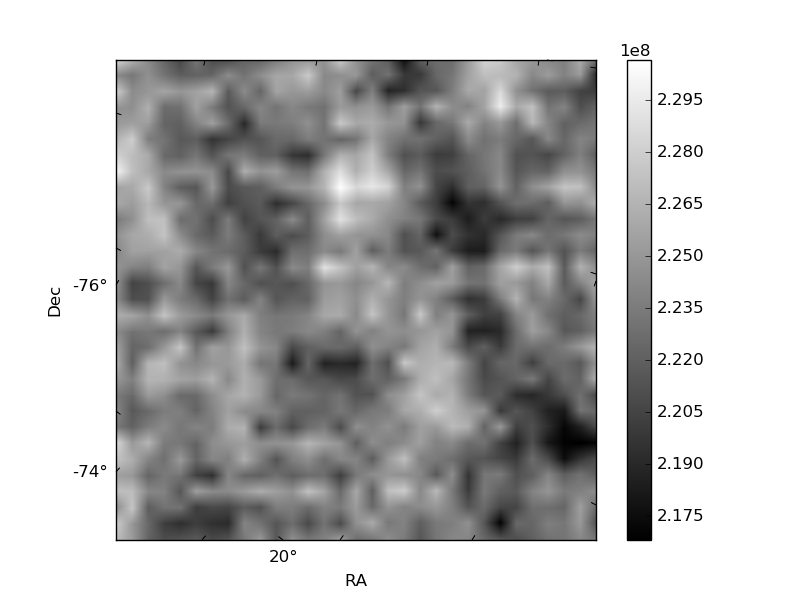
Quadrant B |
|---|---|---|---|
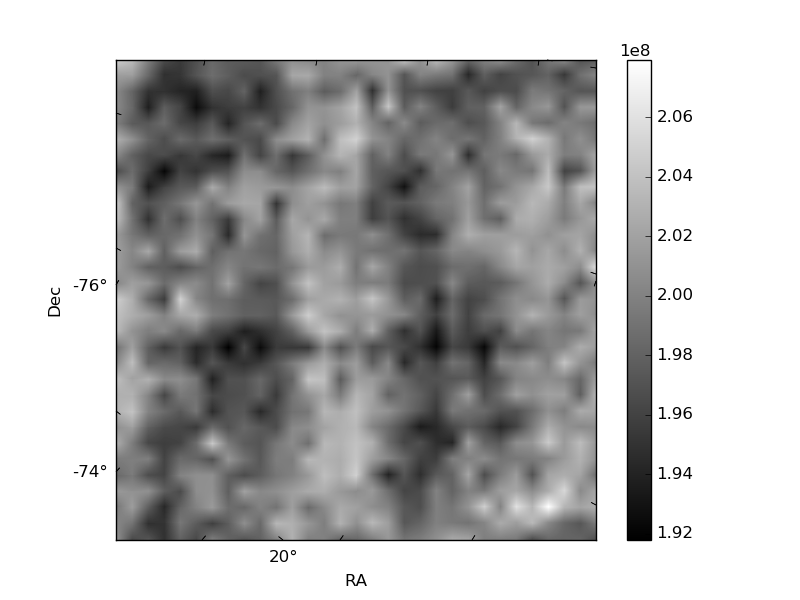
| Quadrant D | 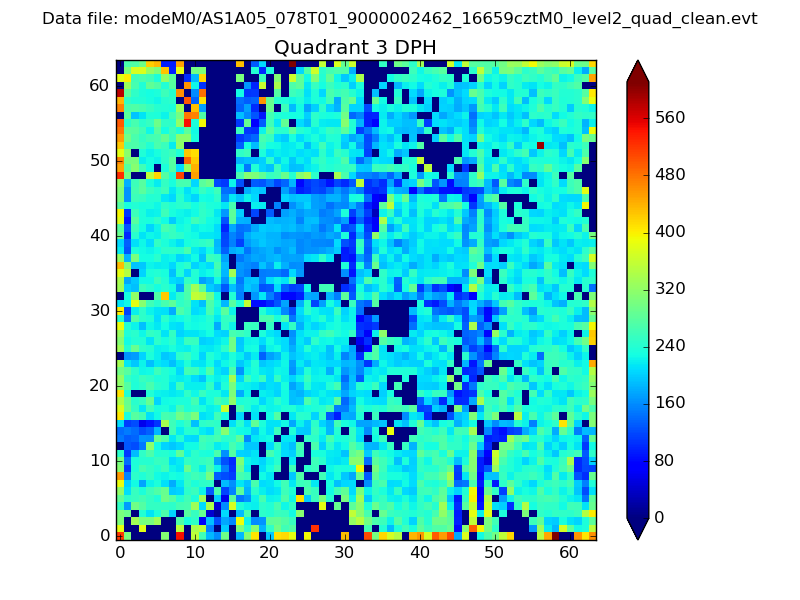 |
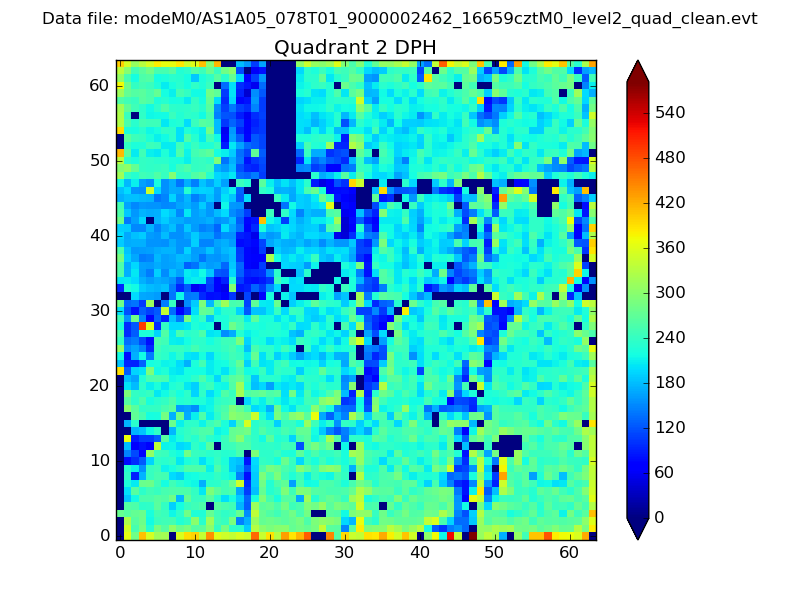 |
Quadrant C |
| Plot type | Count rate plots | Images |
|---|---|---|
| Comparison with Poisson distribution Blue bars denote a histogram of data divided into 1 sec bins. Red curve is a Poisson curve with rate = median count rate of data. |
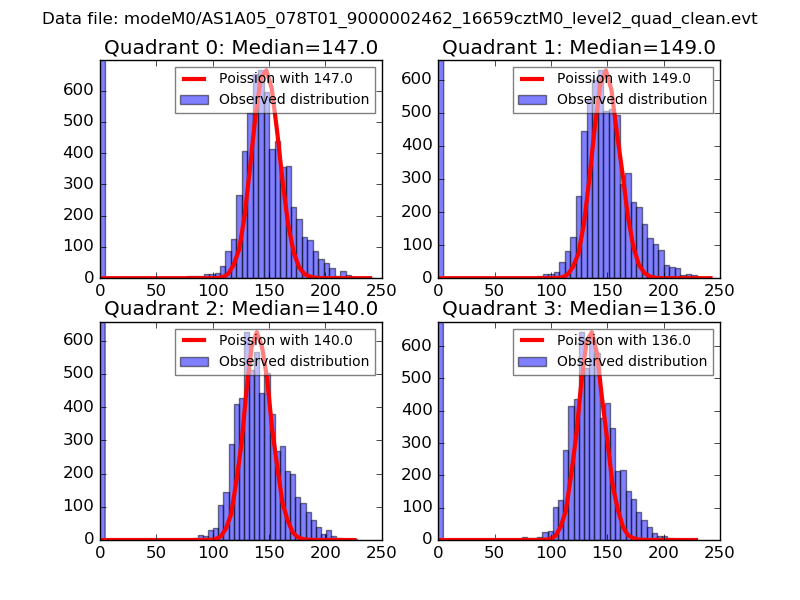 |
 |
| Quadrant-wise count rates Data is divided into 100 sec bins |
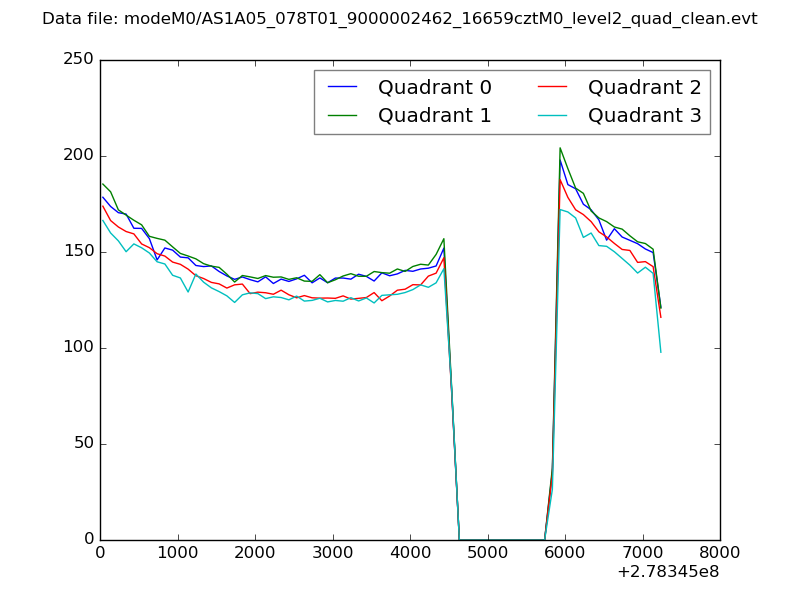 |
|
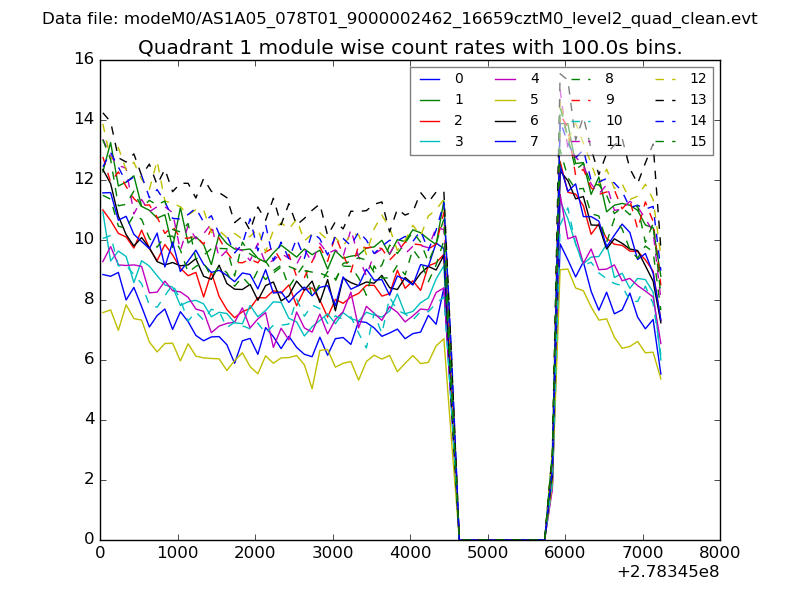
| Module-wise count rates for Quadrant A Data is divided into 100 sec bins |
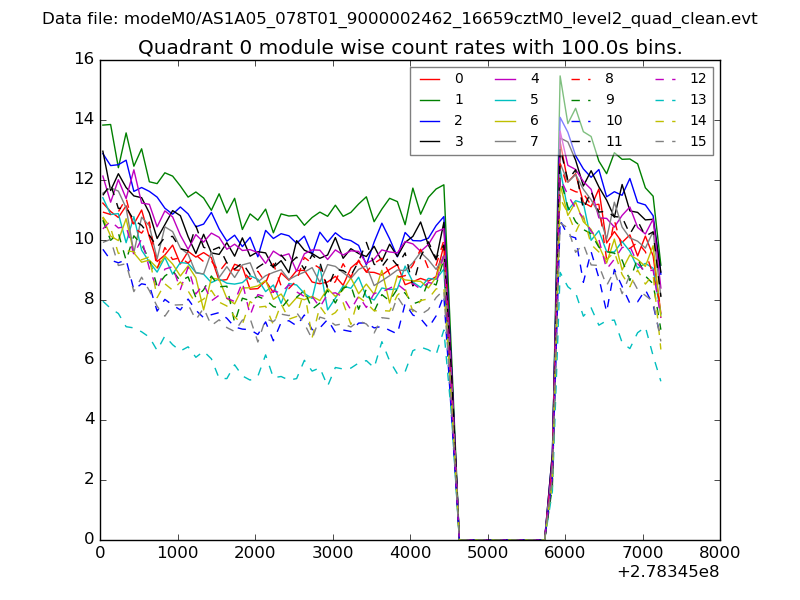 |
 |
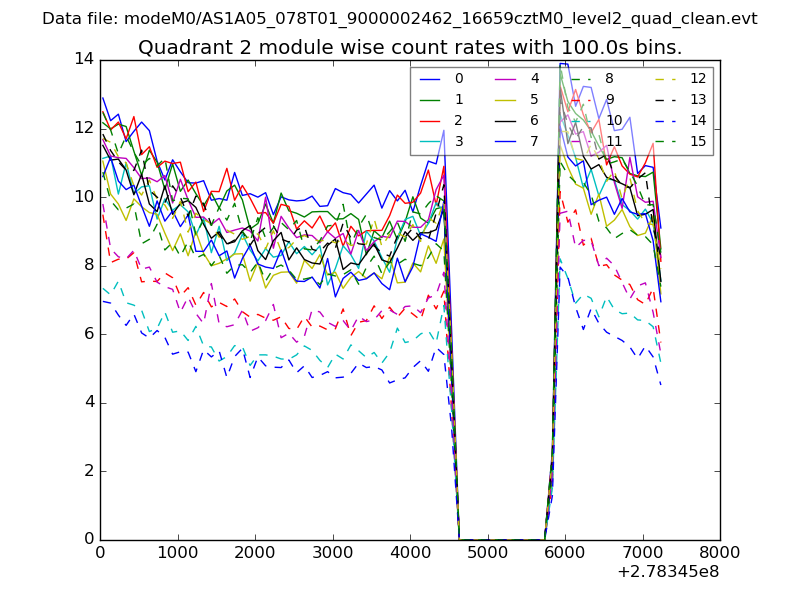
| Module-wise count rates for Quadrant B Data is divided into 100 sec bins |
 |
 |
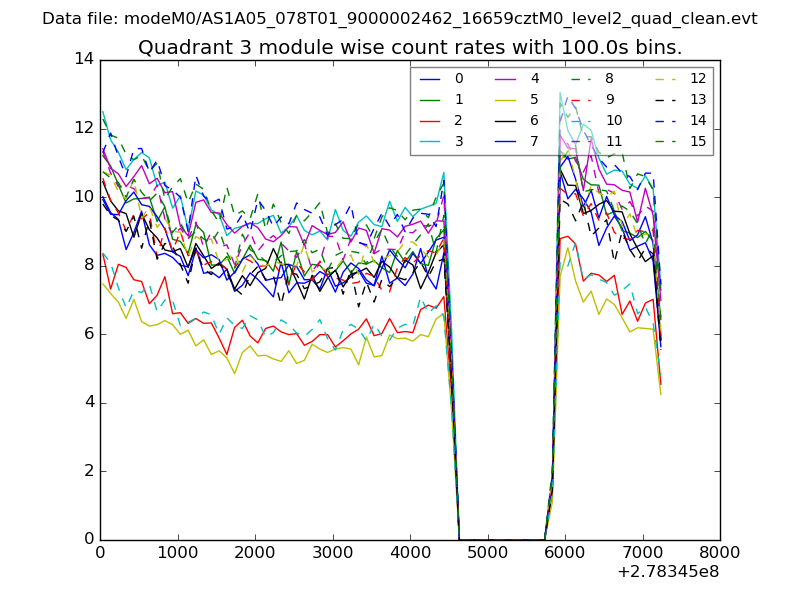
| Module-wise count rates for Quadrant C Data is divided into 100 sec bins |
 |
 |
| Module-wise count rates for Quadrant D Data is divided into 100 sec bins |
 |
 |
| Parameter | Plot |
|---|---|
| CZT HV Monitor | 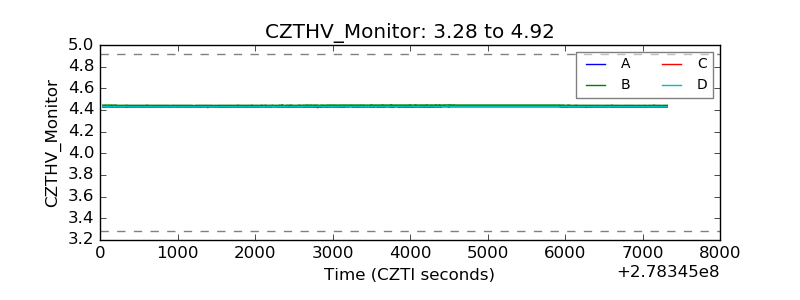 |
| D_VDD | 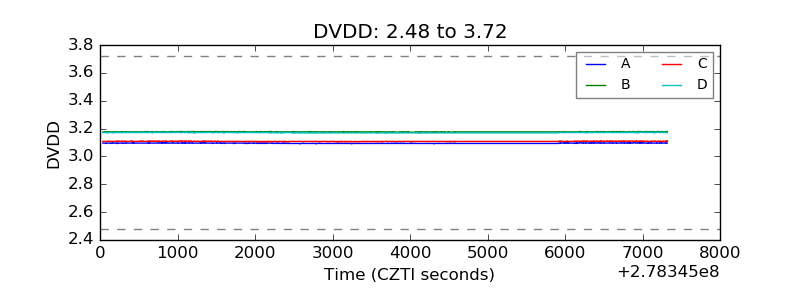 |
| Temperature 1 | 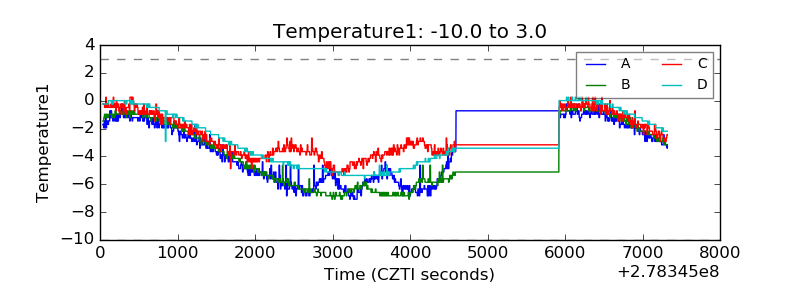 |
| Veto HV Monitor | 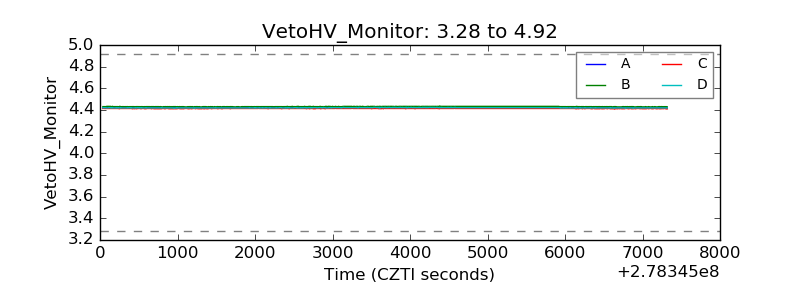 |
| Veto LLD | 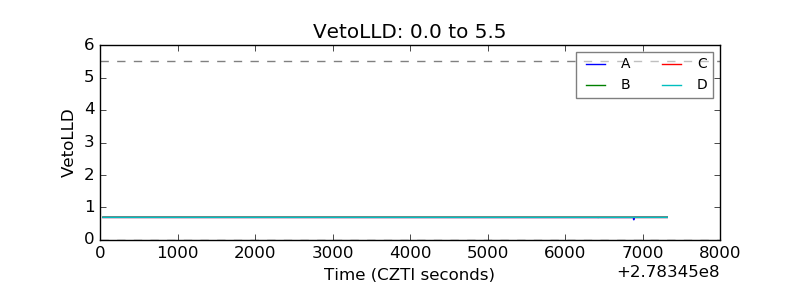 |
| Alpha Counter | 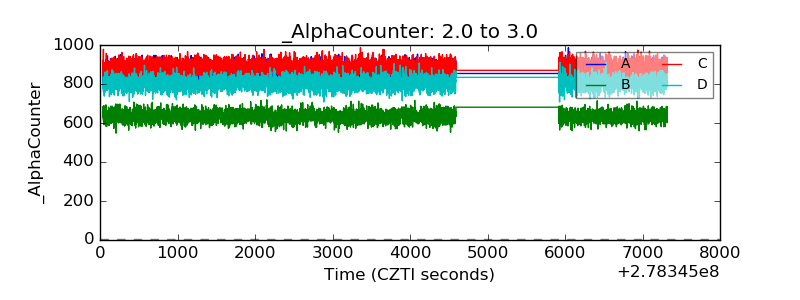 |
| _CPM_Rate | 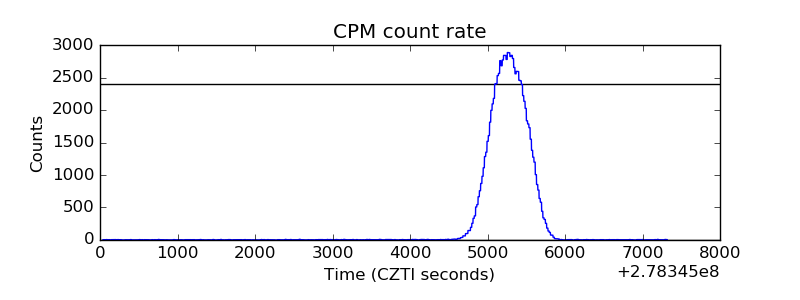 |
| CZT Counter | 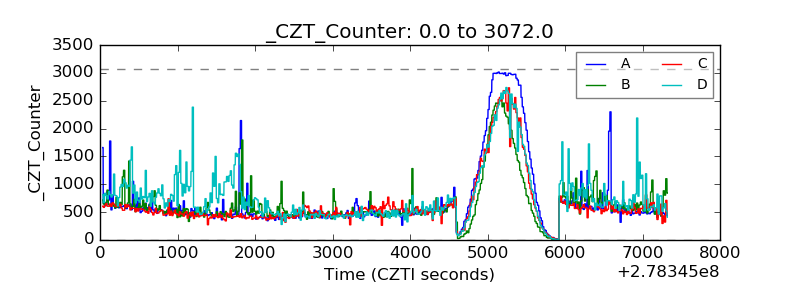 |
| +2.5 Volts monitor |  |
| +5 Volts monitor |  |
| _ROLL_ROT | 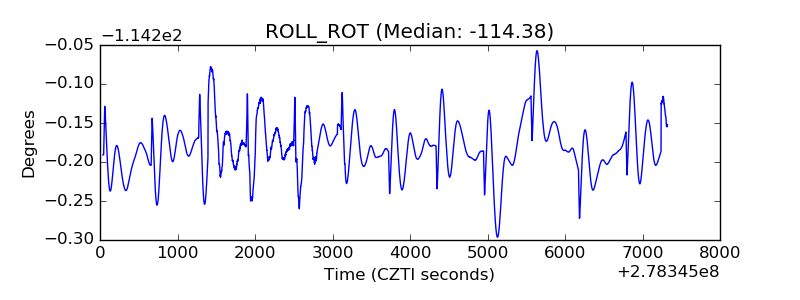 |
| _Roll_DEC | 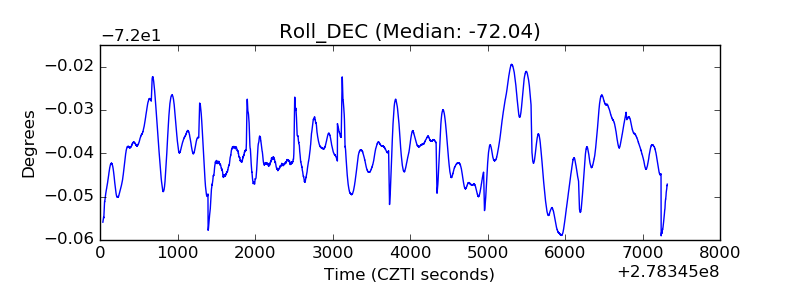 |
| _Roll_RA | 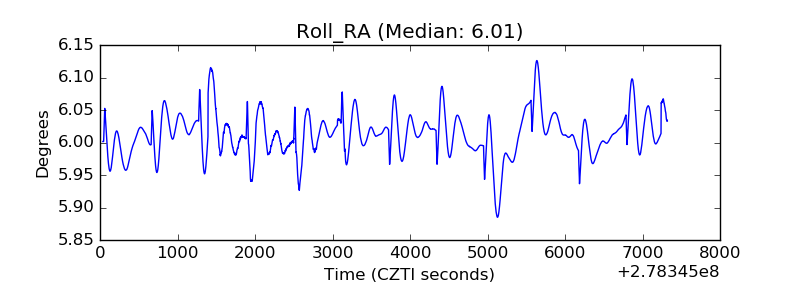 |
| Veto Counter | 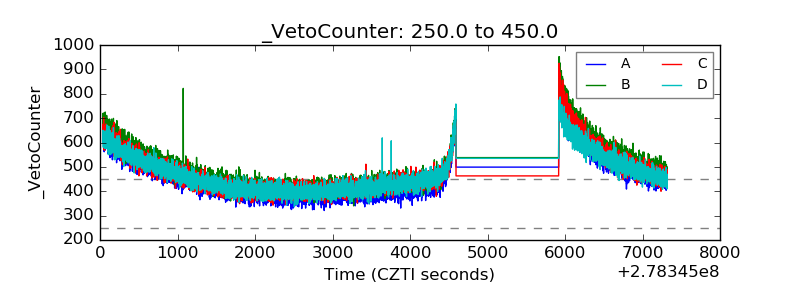 |