| Param | Original file | Final file |
|---|---|---|
| Filename | modeM0/AS1A05_078T01_9000002462_16660cztM0_level2.evt | modeM0/AS1A05_078T01_9000002462_16660cztM0_level2_quad_clean.evt |
| Size (bytes) | 491,492,160 | 126,406,080 |
| Size | 468.7 MB | 120.6 MB |
| Events in quadrant A | 3,275,845 | 876,283 |
| Events in quadrant B | 3,630,899 | 890,006 |
| Events in quadrant C | 2,988,683 | 837,451 |
| Events in quadrant D | 4,581,247 | 804,617 |
| Mode M0 | |||
|---|---|---|---|
| Quadrant | BADHDUFLAG | Total packets | Discarded packets |
| A | 0 | 13695 | 2 |
| B | 0 | 14695 | 1 |
| C | 0 | 12657 | 1 |
| D | 0 | 17812 | 1 |
| Mode SS | |||
|---|---|---|---|
| Quadrant | BADHDUFLAG | Total packets | Discarded packets |
| A | 0 | 122 | 0 |
| B | 0 | 122 | 0 |
| C | 0 | 122 | 0 |
| D | 0 | 122 | 0 |
| Mode M9 | |||
|---|---|---|---|
| Quadrant | BADHDUFLAG | Total packets | Discarded packets |
| A | 0 | 13 | 0 |
| B | 0 | 13 | 0 |
| C | 0 | 13 | 0 |
| D | 0 | 13 | 0 |
| Quadrant | Total seconds | Saturated seconds | Saturation percentage |
|---|---|---|---|
| A | 6019 | 113 | 1.877388% |
| B | 6019 | 130 | 2.159827% |
| C | 6019 | 86 | 1.428809% |
| D | 6019 | 234 | 3.887689% |
Noise dominated data is calculated using 1-second bins in cleaned event files. If a bin has >2000 counts, and if more than 50% of those come from <1% of pixels, then it is considered to be noise-dominated and hence unusable.
| Quadrant | # 1 sec bins | Bins with >0 counts | Bins with >2000 counts | High rate bins dominated by noise | Noise dominated (total time) | Noise dominated (detector-on time) | Marked lightcurve |
|---|---|---|---|---|---|---|---|
| A | 7340 | 6022 | 28 | 28 | 0.38% | 0.46% | 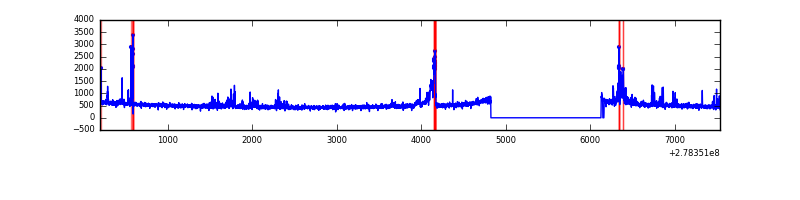 |
| B | 7340 | 6022 | 22 | 22 | 0.30% | 0.37% | 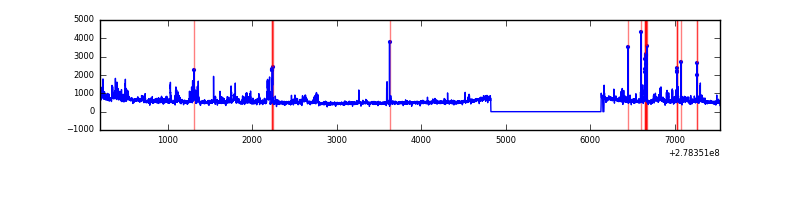 |
| C | 7340 | 6022 | 0 | 0 | 0.00% | 0.00% | 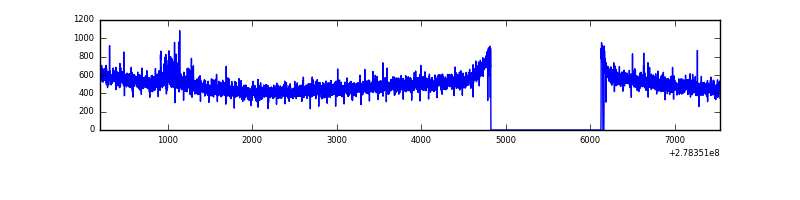 |
| D | 7340 | 6022 | 141 | 141 | 1.92% | 2.34% |  |
Top three noisy pixels from each quadrant. If the there are fewer than three noisy pixels in the level2.evt file, extra rows are filled as -1
| Pixel properties | Quadrant properties | ||||||
|---|---|---|---|---|---|---|---|
| Quadrant | DetID | PixID | Counts | Sigma | Mean | Median | Sigma |
| A | 15 | 174 | 249196 | 1631.33 | 760 | 747 | 152.3 |
| A | 3 | 1 | 100553 | 655.33 | 760 | 747 | 152.3 |
| A | 0 | 226 | 7017 | 41.17 | 760 | 747 | 152.3 |
| B | 15 | 35 | 165433 | 1166.14 | 763 | 745 | 141.2 |
| B | 0 | 229 | 149762 | 1055.17 | 763 | 745 | 141.2 |
| B | 0 | 189 | 128238 | 902.76 | 763 | 745 | 141.2 |
| C | 14 | 238 | 113969 | 686.1 | 717 | 721 | 165.1 |
| C | 7 | 247 | 67674 | 405.63 | 717 | 721 | 165.1 |
| C | 3 | 233 | 10666 | 60.25 | 717 | 721 | 165.1 |
| D | 1 | 52 | 1256835 | 7291.89 | 717 | 696 | 172.3 |
| D | 2 | 16 | 277986 | 1609.67 | 717 | 696 | 172.3 |
| D | 10 | 70 | 140128 | 809.4 | 717 | 696 | 172.3 |
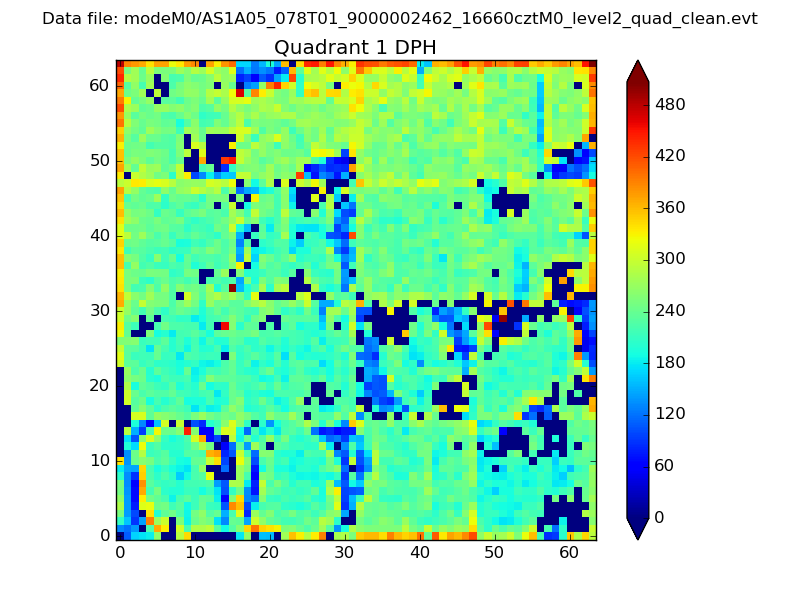
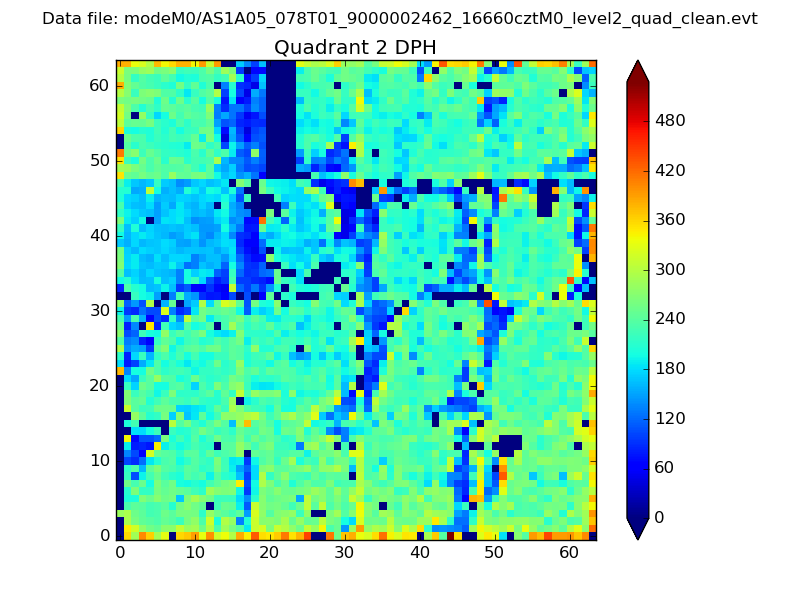
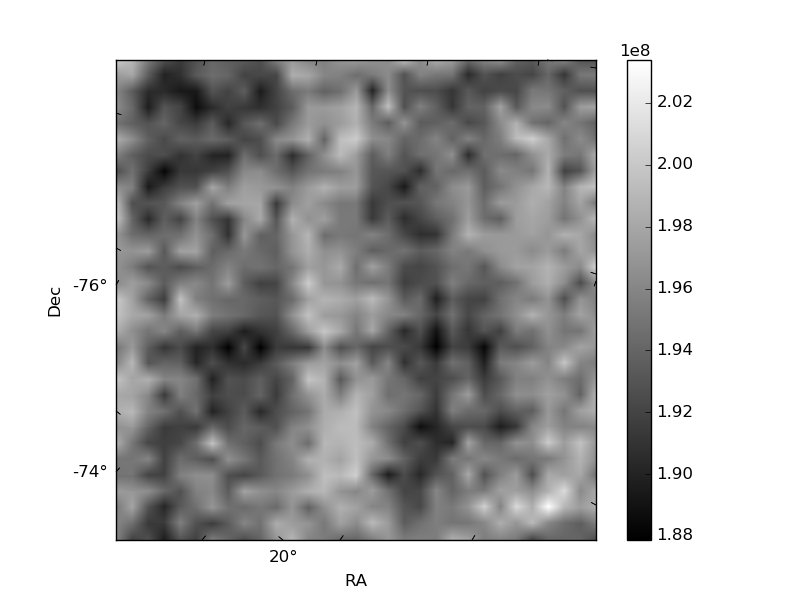
Histogram calculated using DETX and DETY for each event in the final _common_clean file
| Quadrant A | 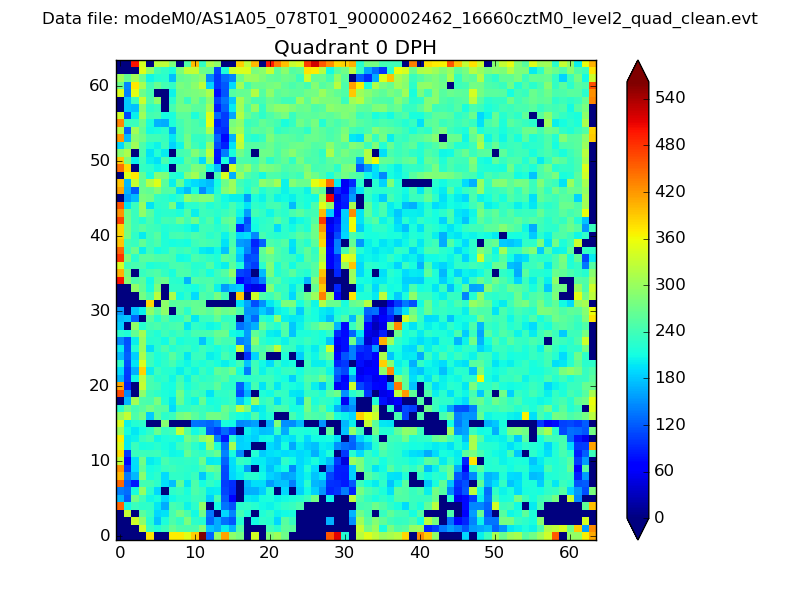 |
 |
Quadrant B |
|---|---|---|---|
| Quadrant D | 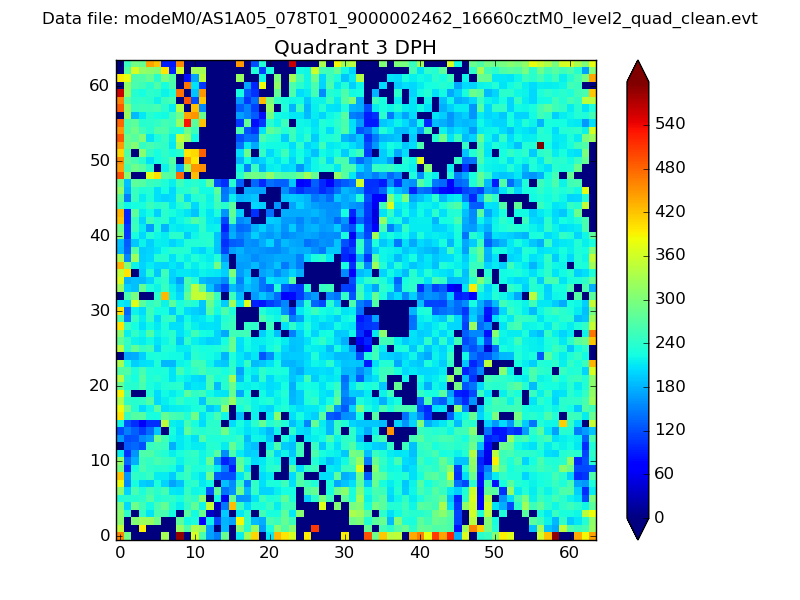 |
 |
Quadrant C |
| Plot type | Count rate plots | Images |
|---|---|---|
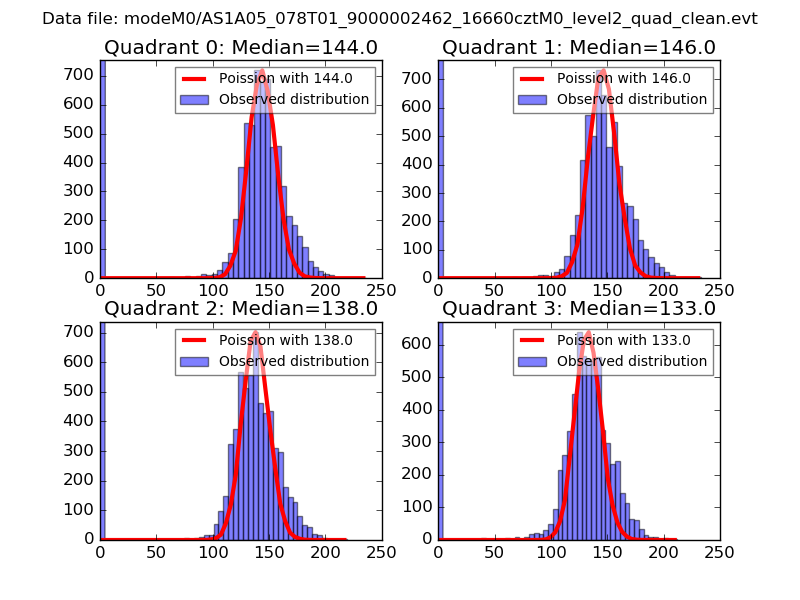
| Comparison with Poisson distribution Blue bars denote a histogram of data divided into 1 sec bins. Red curve is a Poisson curve with rate = median count rate of data. |
 |
 |
| Quadrant-wise count rates Data is divided into 100 sec bins |
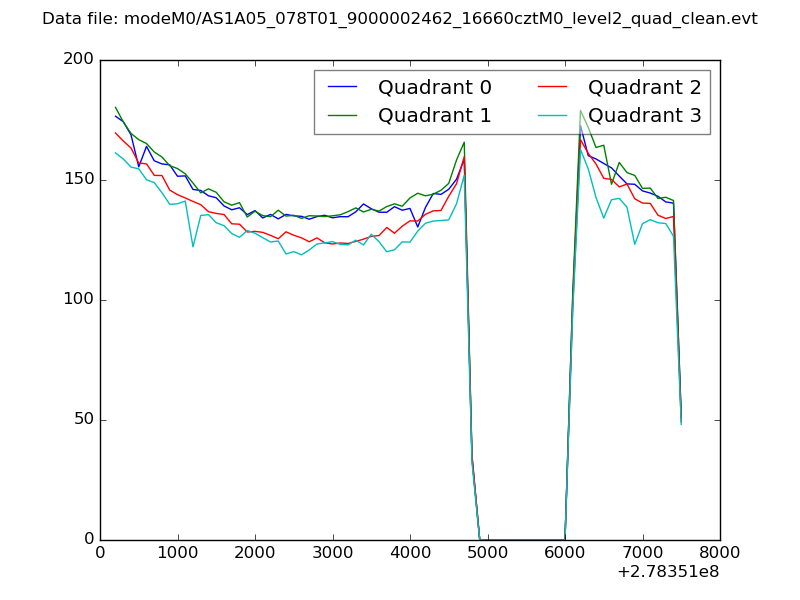 |
|
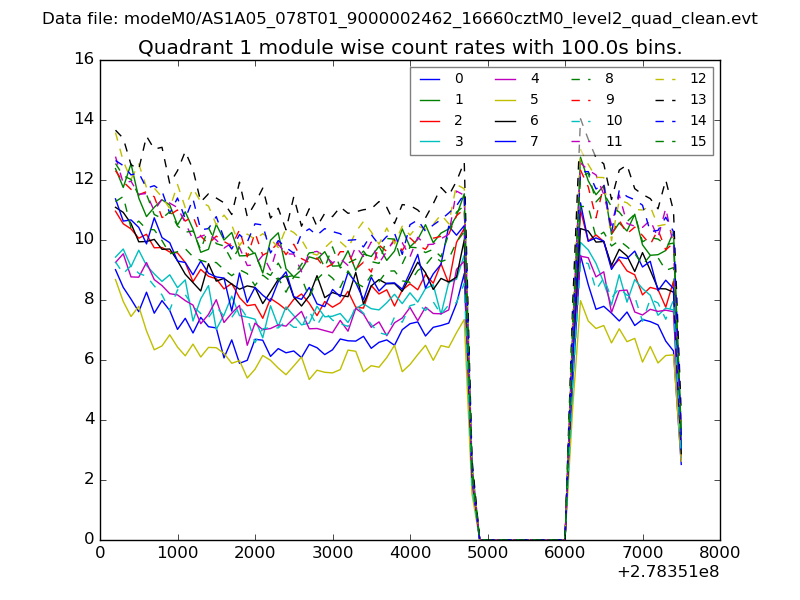
| Module-wise count rates for Quadrant A Data is divided into 100 sec bins |
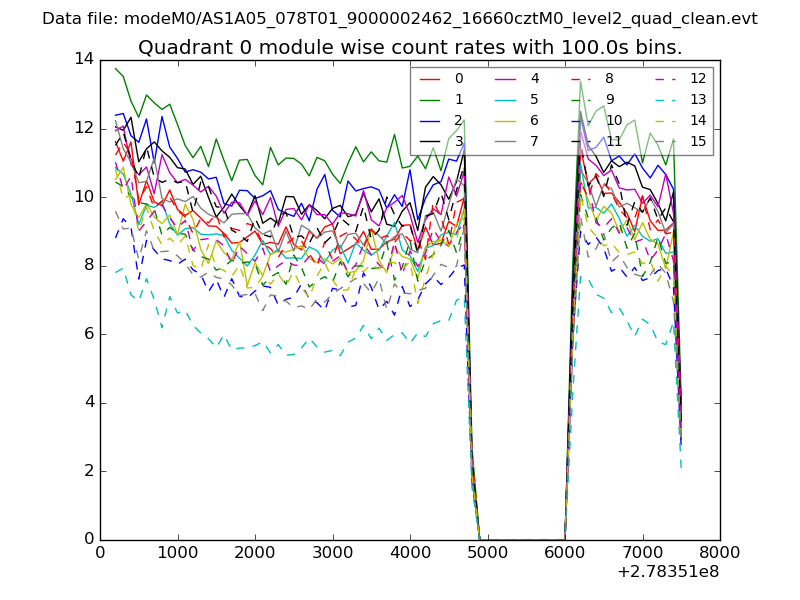 |
 |
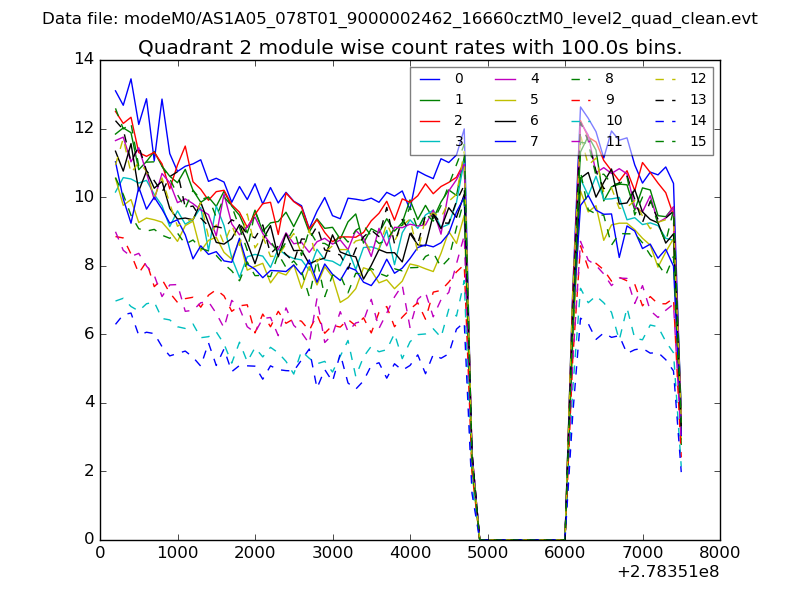
| Module-wise count rates for Quadrant B Data is divided into 100 sec bins |
 |
 |
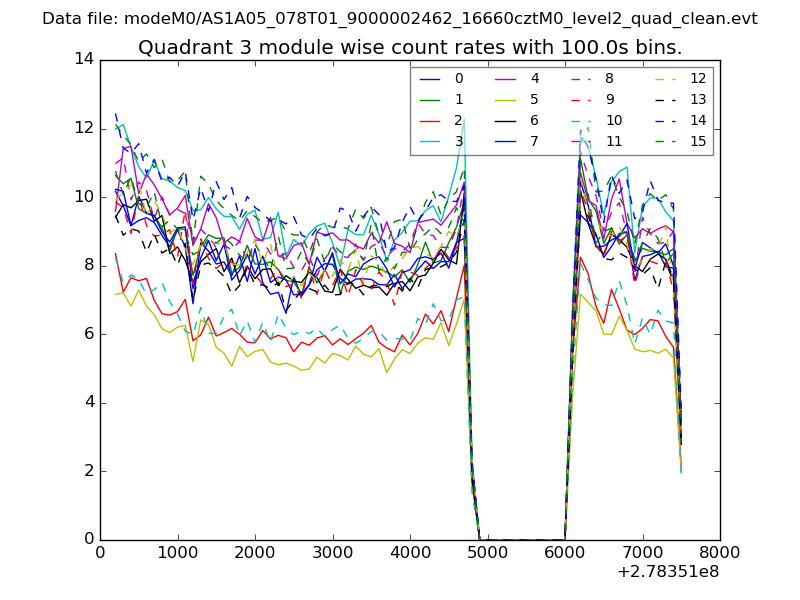
| Module-wise count rates for Quadrant C Data is divided into 100 sec bins |
 |
 |
| Module-wise count rates for Quadrant D Data is divided into 100 sec bins |
 |
 |
| Parameter | Plot |
|---|---|
| CZT HV Monitor | 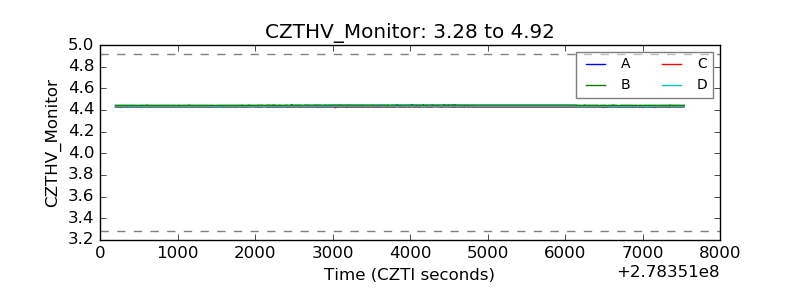 |
| D_VDD | 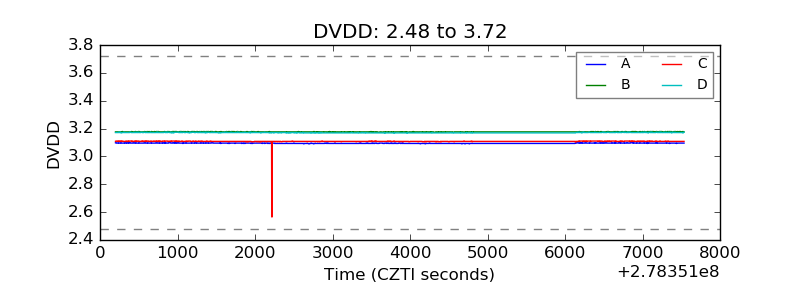 |
| Temperature 1 | 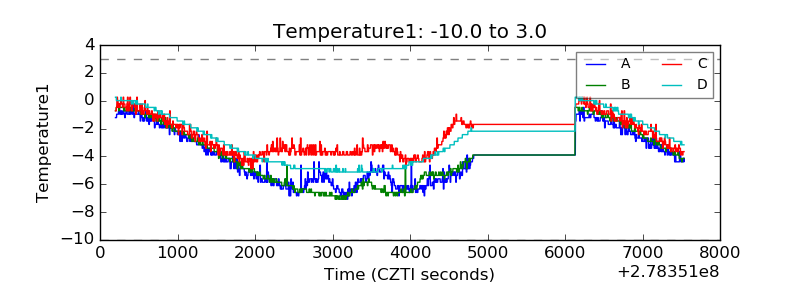 |
| Veto HV Monitor | 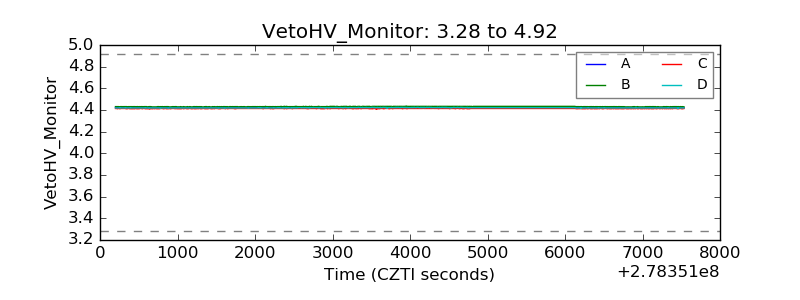 |
| Veto LLD | 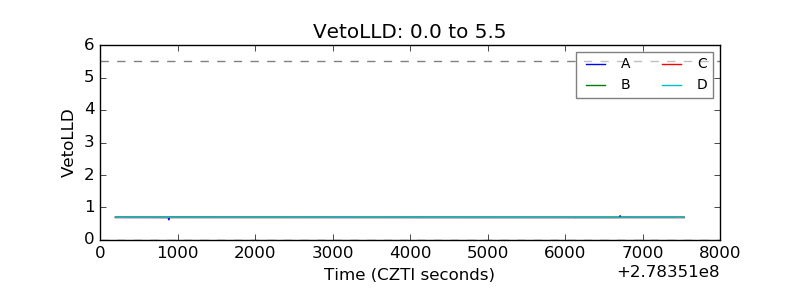 |
| Alpha Counter | 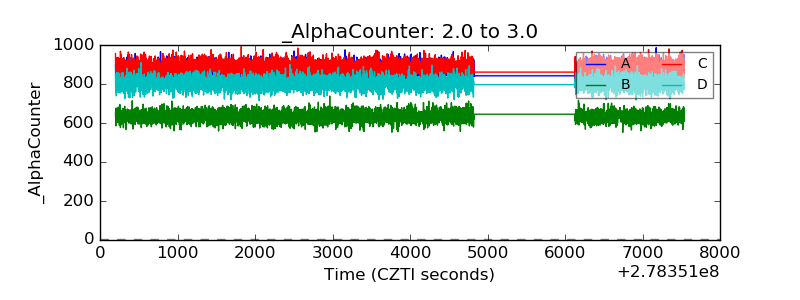 |
| _CPM_Rate | 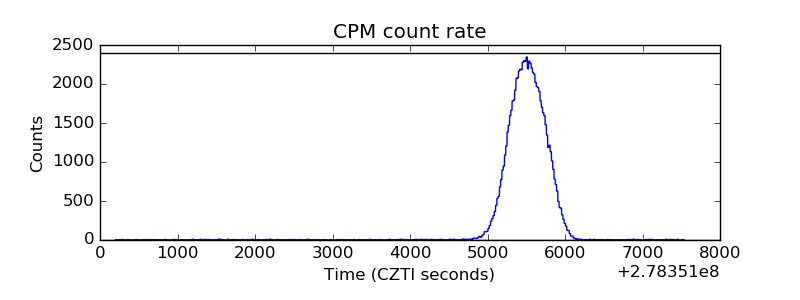 |
| CZT Counter | 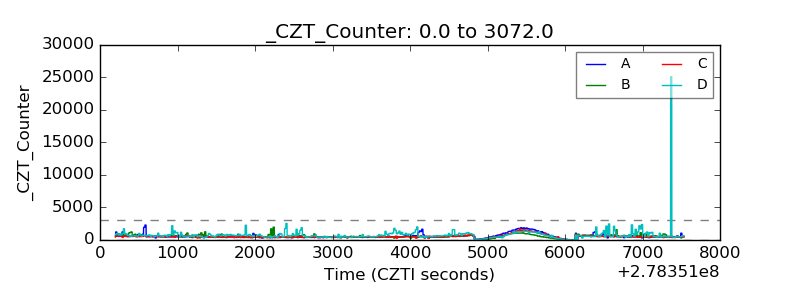 |
| +2.5 Volts monitor |  |
| +5 Volts monitor | 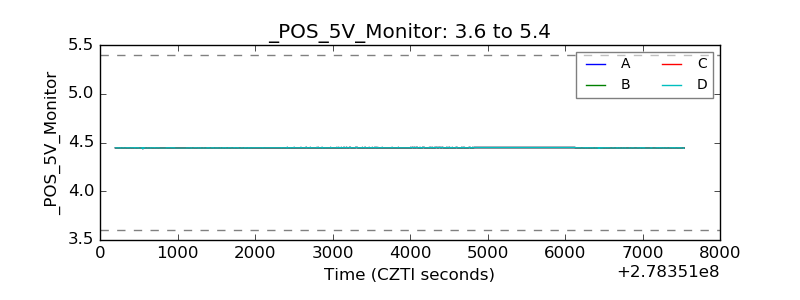 |
| _ROLL_ROT | 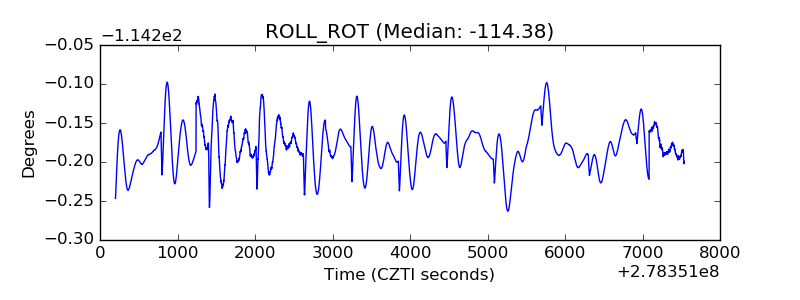 |
| _Roll_DEC | 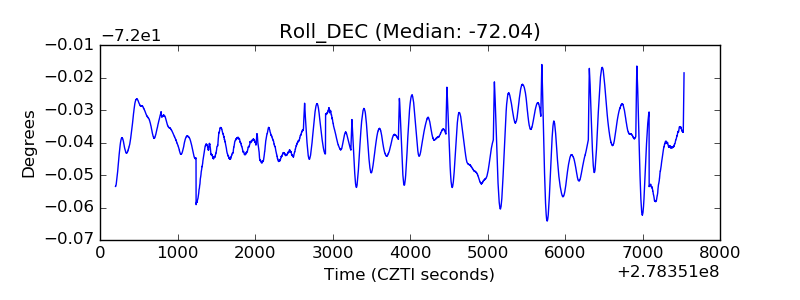 |
| _Roll_RA | 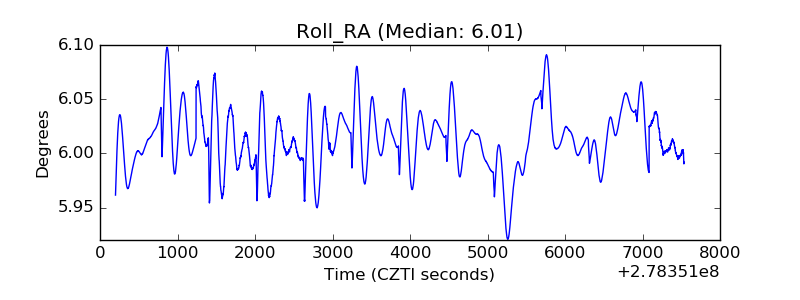 |
| Veto Counter | 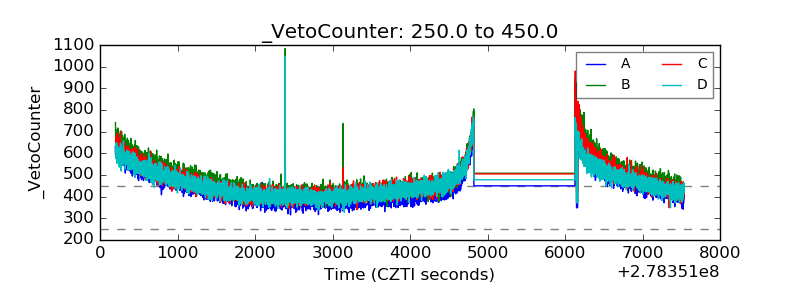 |