| Param | Original file | Final file |
|---|---|---|
| Filename | modeM0/AS1A05_078T01_9000002462_16662cztM0_level2.evt | modeM0/AS1A05_078T01_9000002462_16662cztM0_level2_quad_clean.evt |
| Size (bytes) | 449,556,480 | 127,013,760 |
| Size | 428.7 MB | 121.1 MB |
| Events in quadrant A | 3,086,897 | 860,460 |
| Events in quadrant B | 3,572,227 | 877,519 |
| Events in quadrant C | 3,044,529 | 836,171 |
| Events in quadrant D | 3,462,708 | 812,845 |
| Mode M0 | |||
|---|---|---|---|
| Quadrant | BADHDUFLAG | Total packets | Discarded packets |
| A | 0 | 13755 | 3 |
| B | 0 | 14929 | 2 |
| C | 0 | 13522 | 2 |
| D | 0 | 15258 | 2 |
| Mode SS | |||
|---|---|---|---|
| Quadrant | BADHDUFLAG | Total packets | Discarded packets |
| A | 0 | 134 | 0 |
| B | 0 | 134 | 0 |
| C | 0 | 134 | 0 |
| D | 0 | 134 | 0 |
| Mode M9 | |||
|---|---|---|---|
| Quadrant | BADHDUFLAG | Total packets | Discarded packets |
| A | 0 | 18 | 0 |
| B | 0 | 18 | 0 |
| C | 0 | 18 | 0 |
| D | 0 | 19 | 0 |
| Quadrant | Total seconds | Saturated seconds | Saturation percentage |
|---|---|---|---|
| A | 6599 | 35 | 0.530383% |
| B | 6599 | 79 | 1.197151% |
| C | 6599 | 43 | 0.651614% |
| D | 6599 | 71 | 1.075921% |
Noise dominated data is calculated using 1-second bins in cleaned event files. If a bin has >2000 counts, and if more than 50% of those come from <1% of pixels, then it is considered to be noise-dominated and hence unusable.
| Quadrant | # 1 sec bins | Bins with >0 counts | Bins with >2000 counts | High rate bins dominated by noise | Noise dominated (total time) | Noise dominated (detector-on time) | Marked lightcurve |
|---|---|---|---|---|---|---|---|
| A | 7640 | 6601 | 10 | 10 | 0.13% | 0.15% | 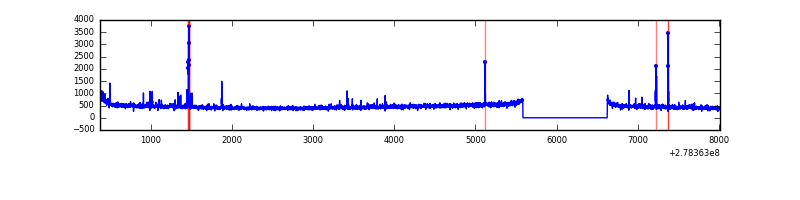 |
| B | 7640 | 6601 | 17 | 17 | 0.22% | 0.26% | 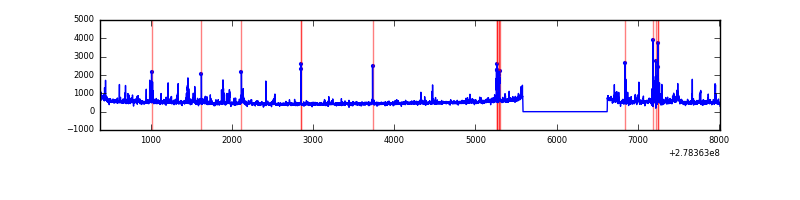 |
| C | 7640 | 6601 | 0 | 0 | 0.00% | 0.00% | 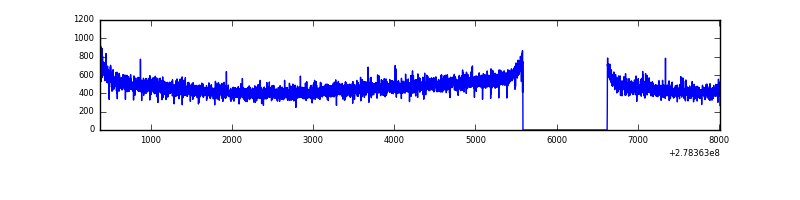 |
| D | 7640 | 6601 | 8 | 8 | 0.10% | 0.12% | 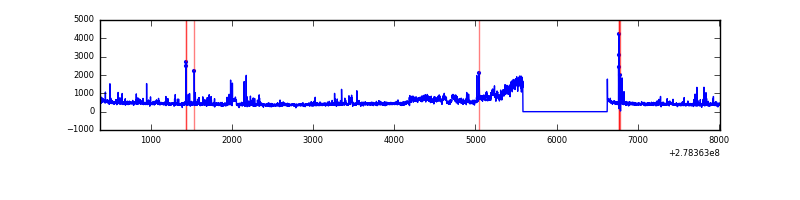 |
Top three noisy pixels from each quadrant. If the there are fewer than three noisy pixels in the level2.evt file, extra rows are filled as -1
| Pixel properties | Quadrant properties | ||||||
|---|---|---|---|---|---|---|---|
| Quadrant | DetID | PixID | Counts | Sigma | Mean | Median | Sigma |
| A | 9 | 143 | 46976 | 295.78 | 774 | 757 | 156.3 |
| A | 3 | 1 | 29631 | 184.78 | 774 | 757 | 156.3 |
| A | 15 | 174 | 26675 | 165.87 | 774 | 757 | 156.3 |
| B | 15 | 35 | 208983 | 1426.94 | 781 | 761 | 145.9 |
| B | 0 | 229 | 107190 | 729.35 | 781 | 761 | 145.9 |
| B | 0 | 197 | 44336 | 298.62 | 781 | 761 | 145.9 |
| C | 14 | 238 | 116344 | 674.93 | 742 | 745 | 171.3 |
| C | 7 | 247 | 21732 | 122.53 | 742 | 745 | 171.3 |
| C | 3 | 233 | 8957 | 47.95 | 742 | 745 | 171.3 |
| D | 1 | 52 | 520529 | 2867.2 | 742 | 720 | 181.3 |
| D | 2 | 16 | 37368 | 202.15 | 742 | 720 | 181.3 |
| D | 2 | 234 | 31353 | 168.97 | 742 | 720 | 181.3 |
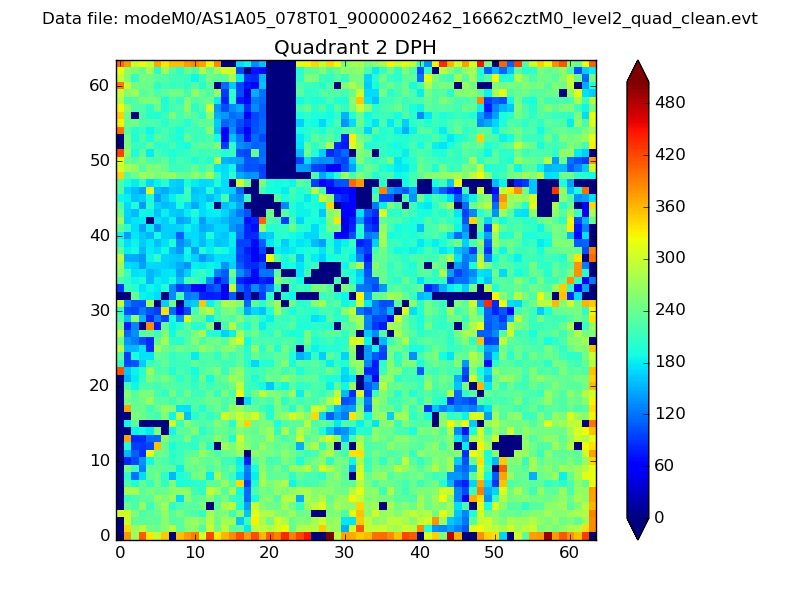
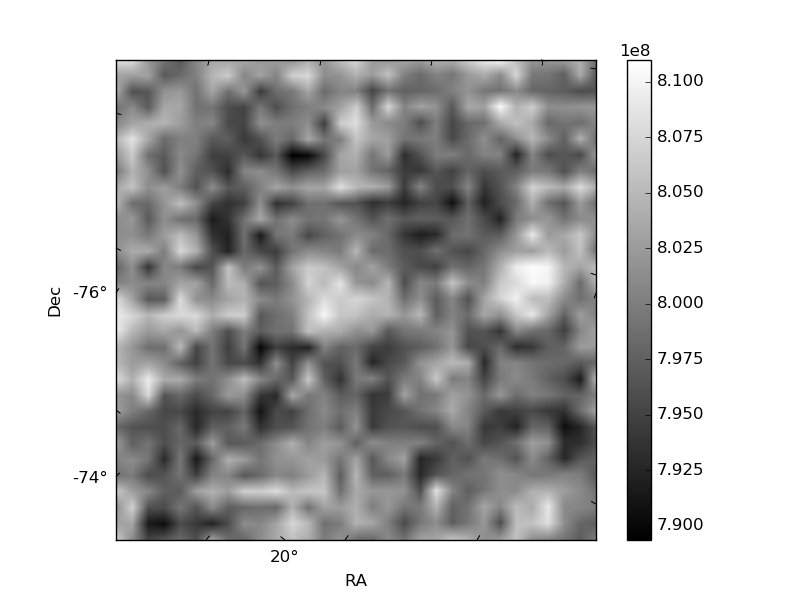
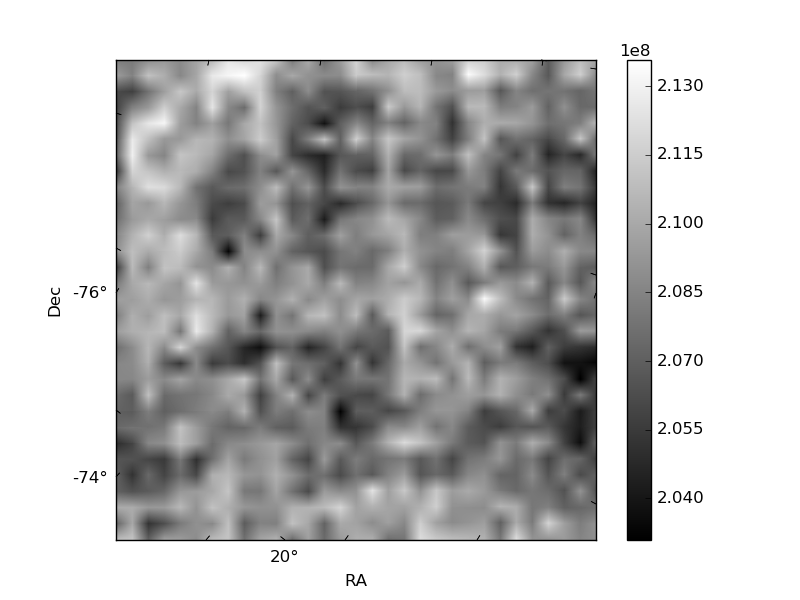
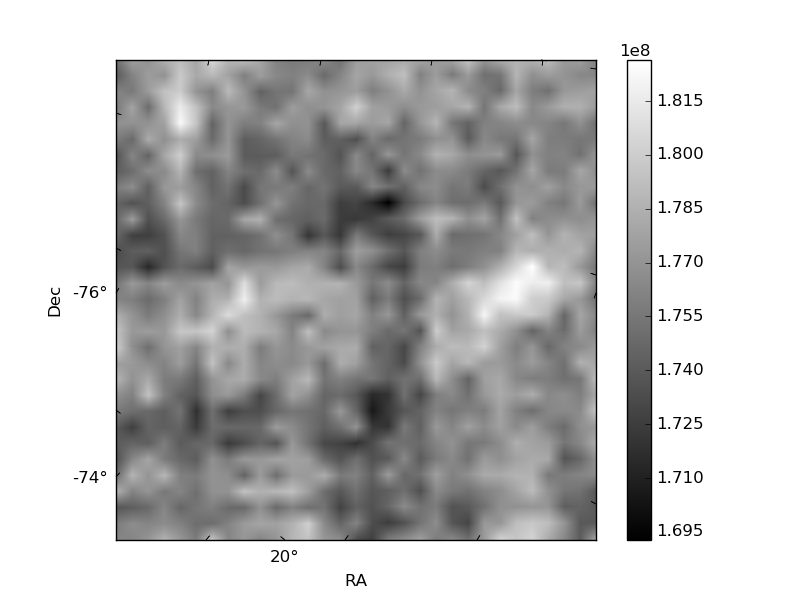
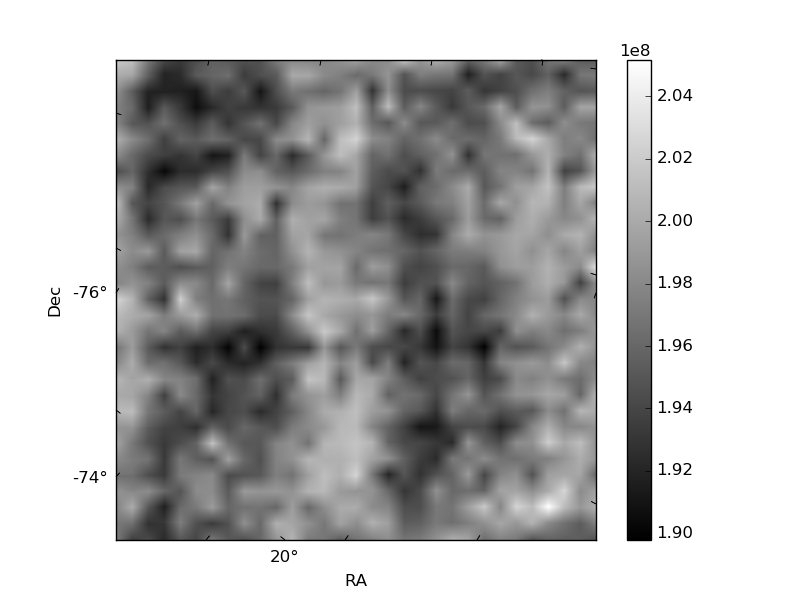
Histogram calculated using DETX and DETY for each event in the final _common_clean file
| Quadrant A | 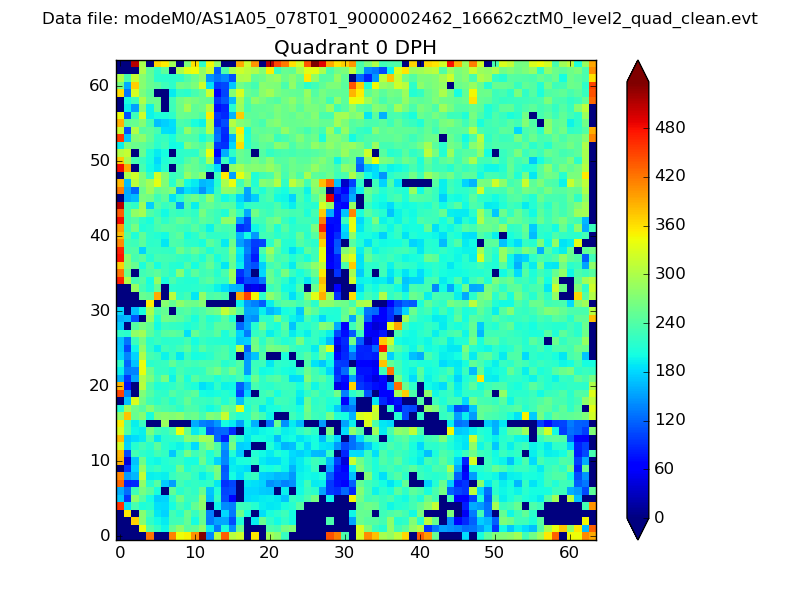 |
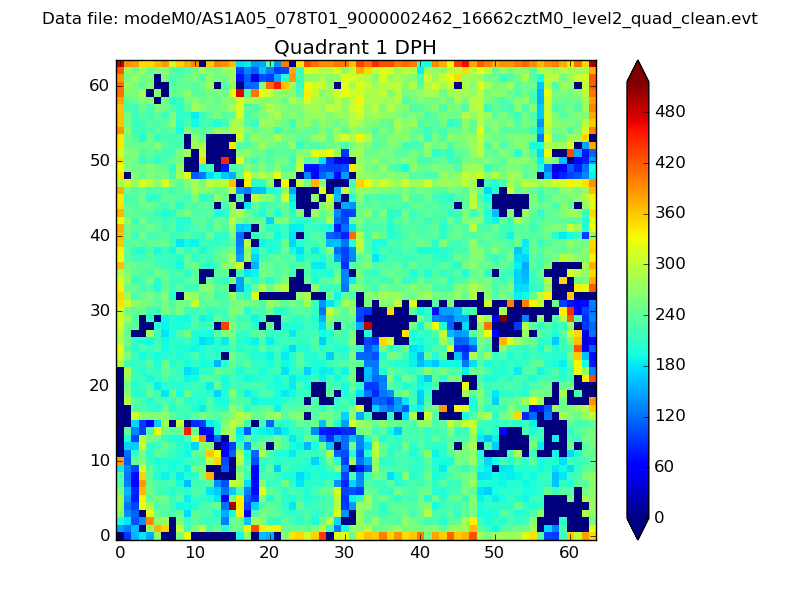 |
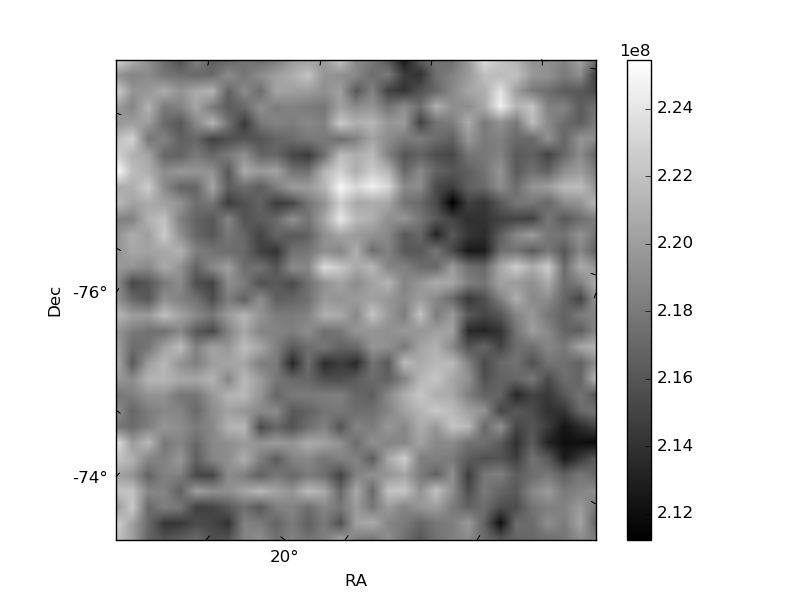
Quadrant B |
|---|---|---|---|
| Quadrant D | 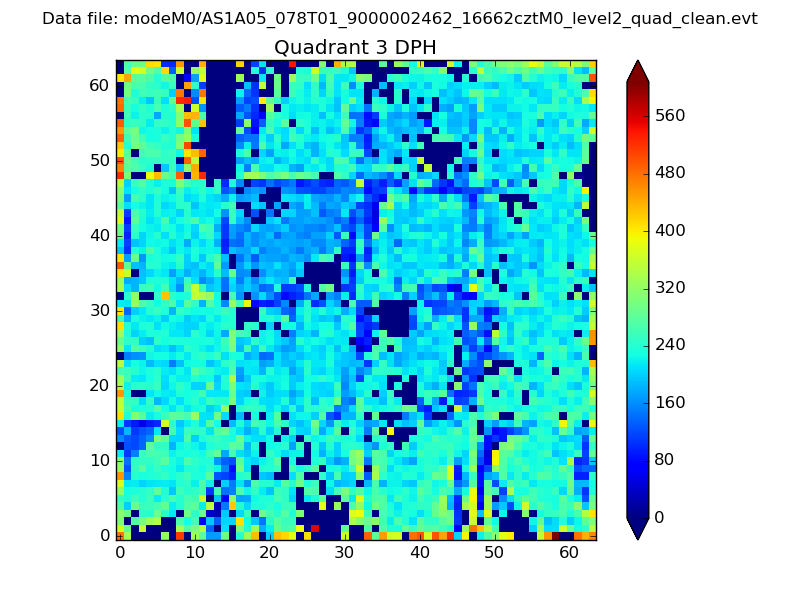 |
 |
Quadrant C |
| Plot type | Count rate plots | Images |
|---|---|---|
| Comparison with Poisson distribution Blue bars denote a histogram of data divided into 1 sec bins. Red curve is a Poisson curve with rate = median count rate of data. |
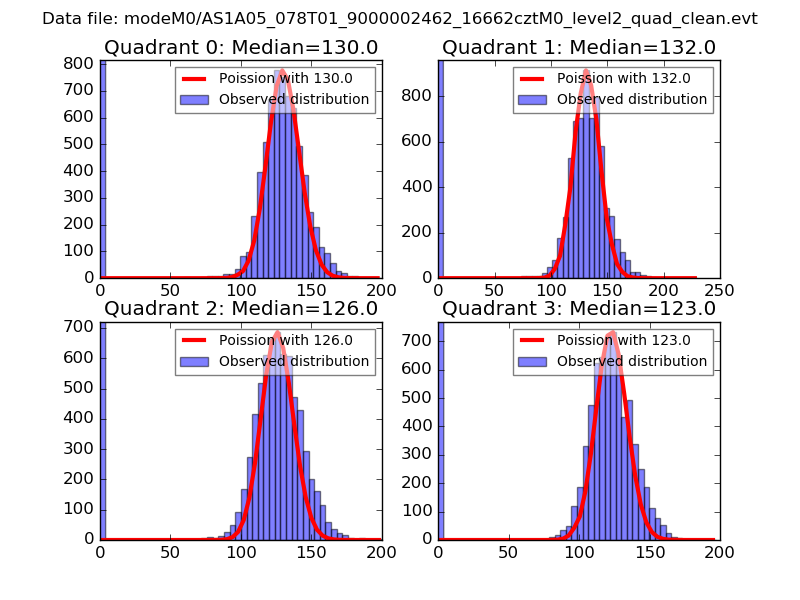 |
 |
| Quadrant-wise count rates Data is divided into 100 sec bins |
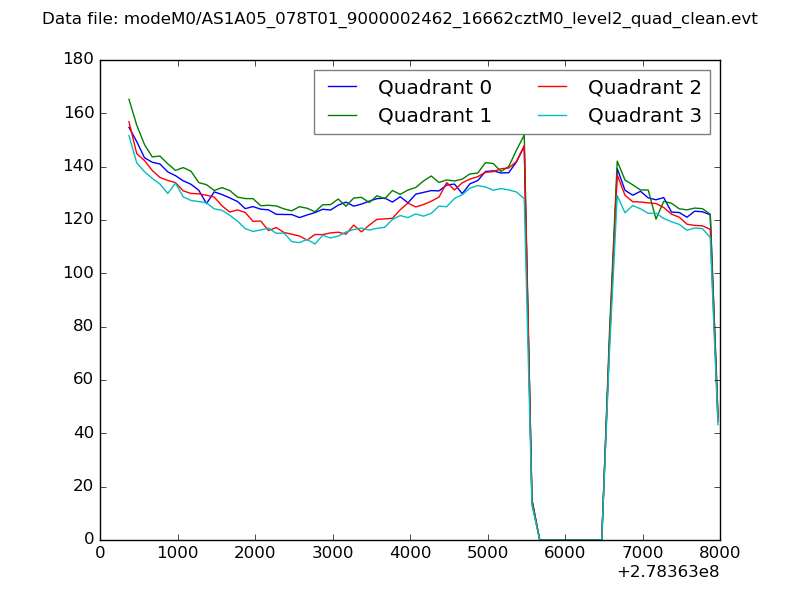 |
|
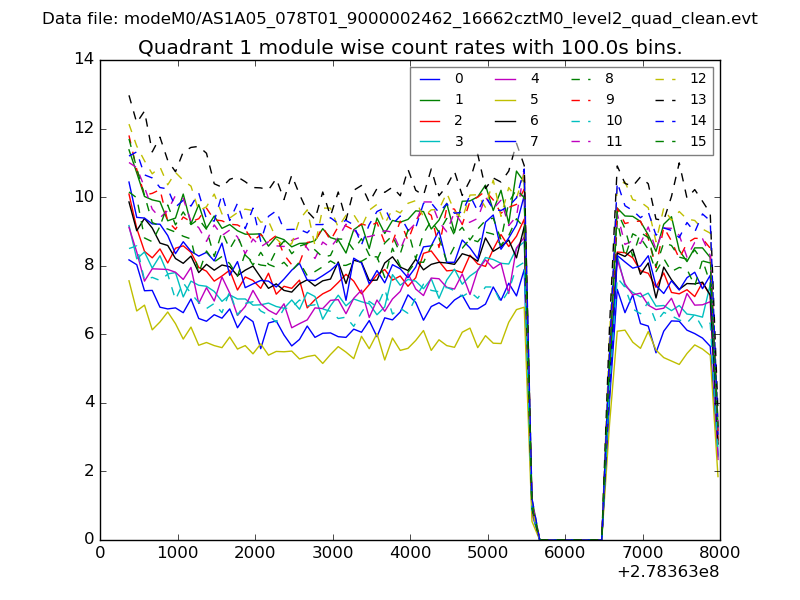
| Module-wise count rates for Quadrant A Data is divided into 100 sec bins |
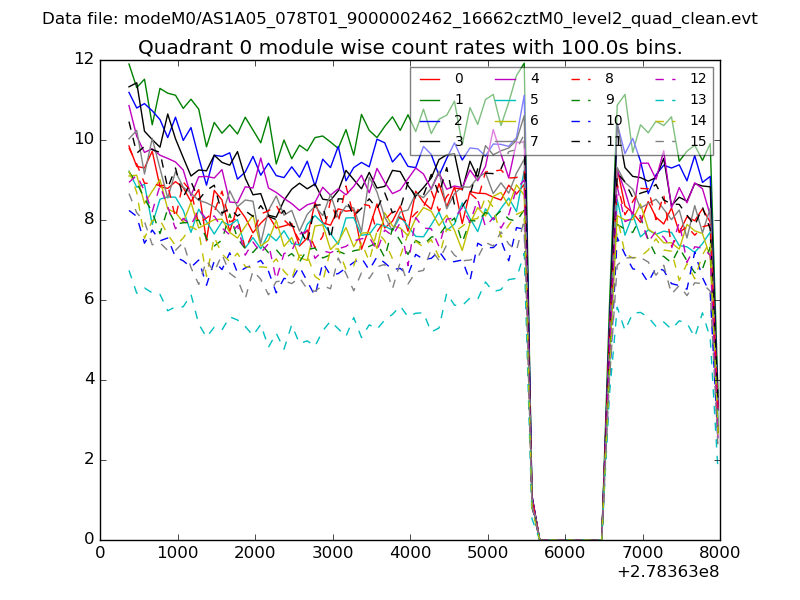 |
 |
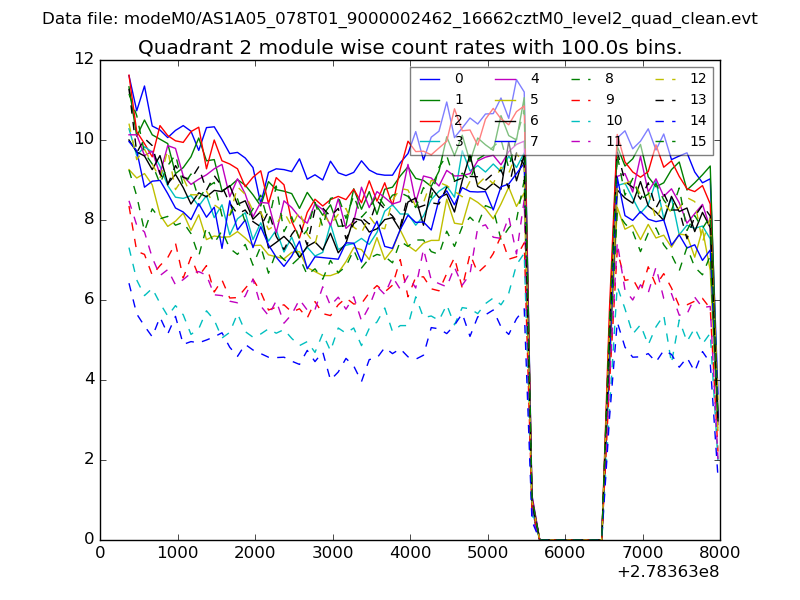
| Module-wise count rates for Quadrant B Data is divided into 100 sec bins |
 |
 |
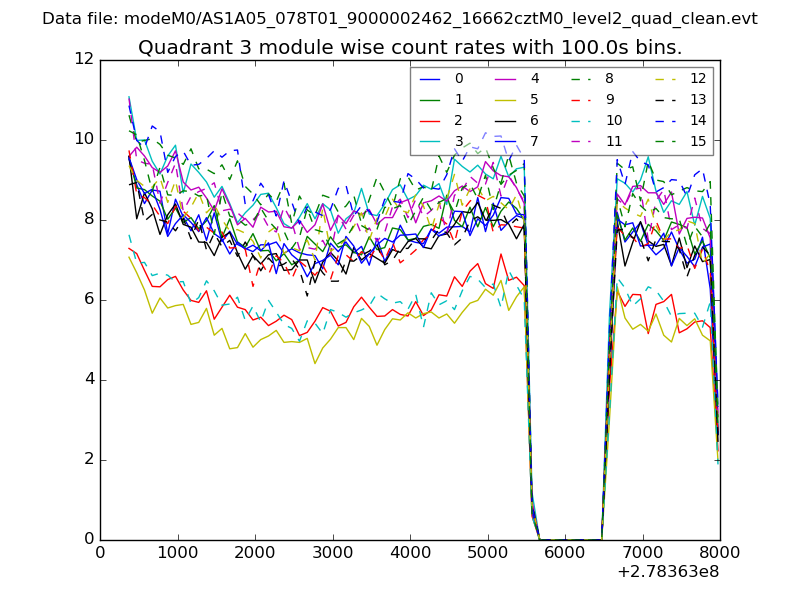
| Module-wise count rates for Quadrant C Data is divided into 100 sec bins |
 |
 |
| Module-wise count rates for Quadrant D Data is divided into 100 sec bins |
 |
 |
| Parameter | Plot |
|---|---|
| CZT HV Monitor | 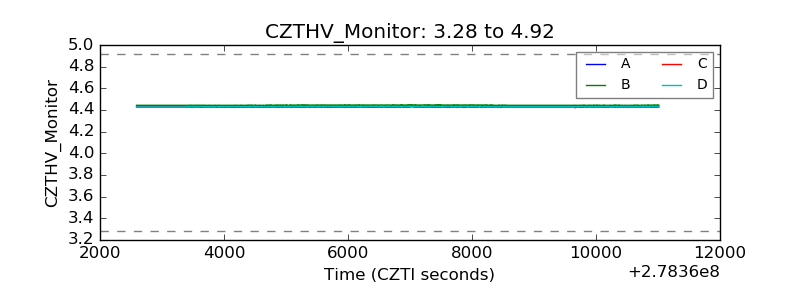 |
| D_VDD | 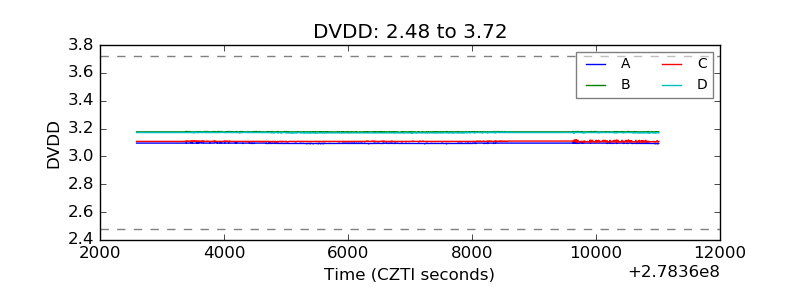 |
| Temperature 1 | 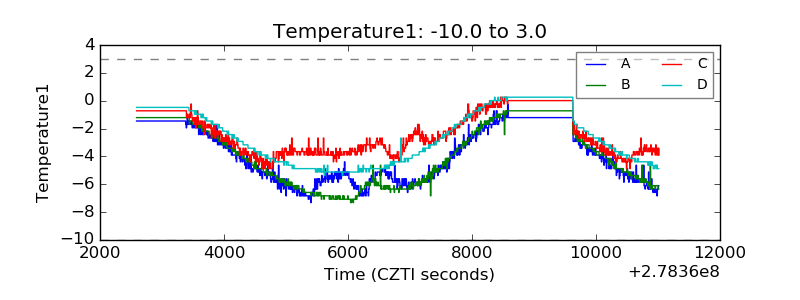 |
| Veto HV Monitor | 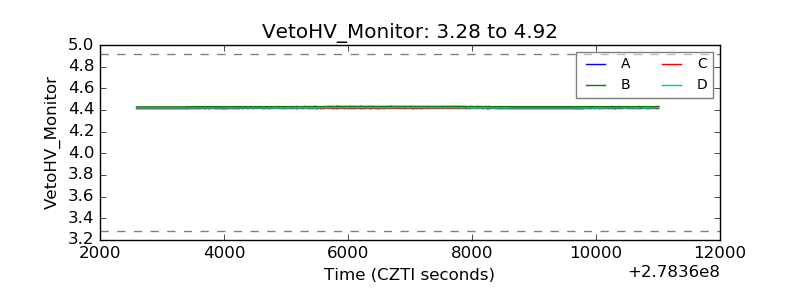 |
| Veto LLD | 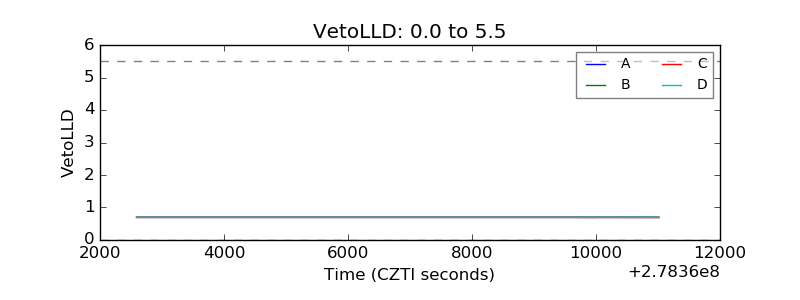 |
| Alpha Counter | 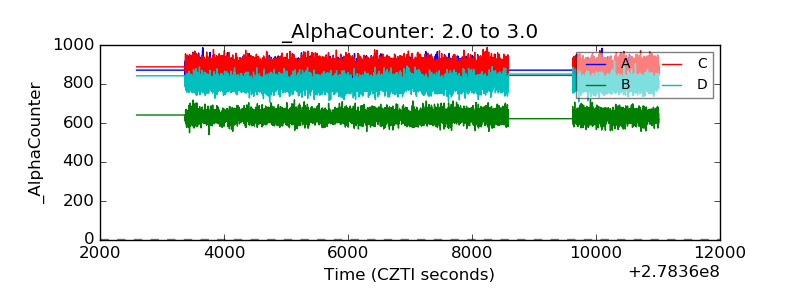 |
| _CPM_Rate | 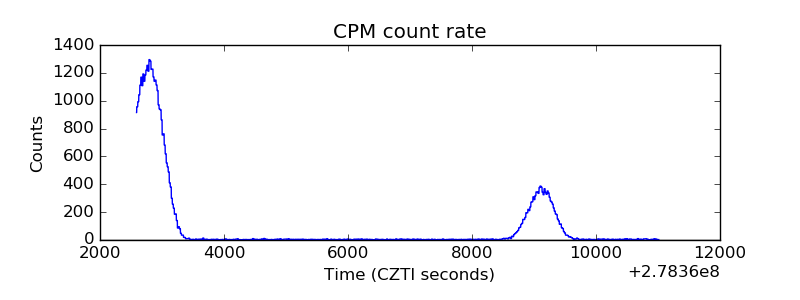 |
| CZT Counter | 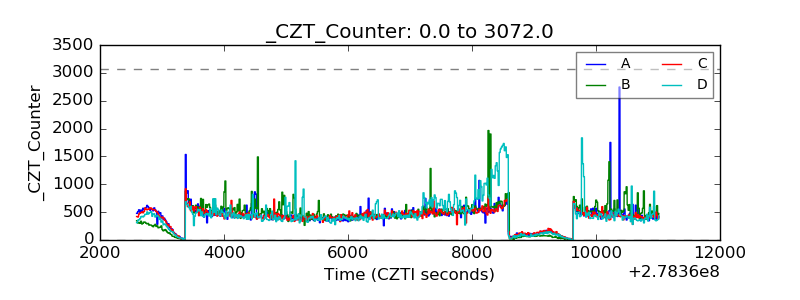 |
| +2.5 Volts monitor |  |
| +5 Volts monitor | 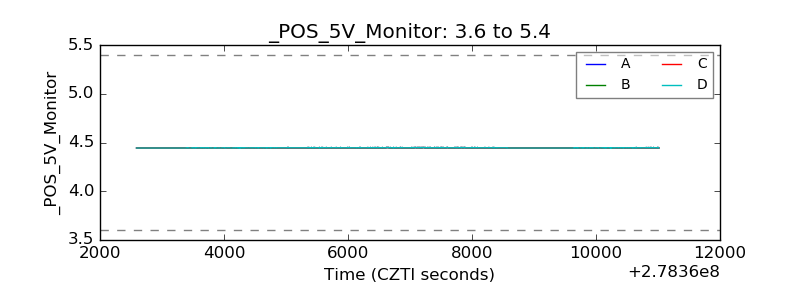 |
| _ROLL_ROT | 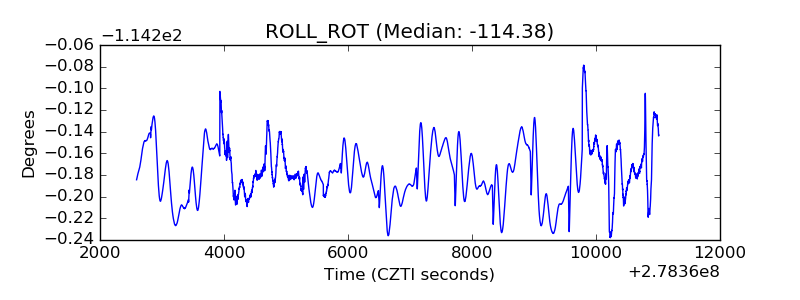 |
| _Roll_DEC | 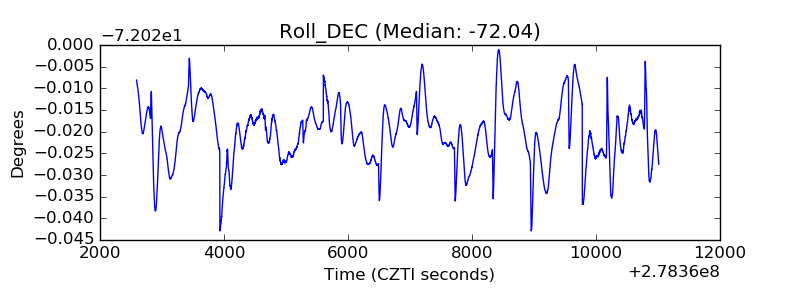 |
| _Roll_RA | 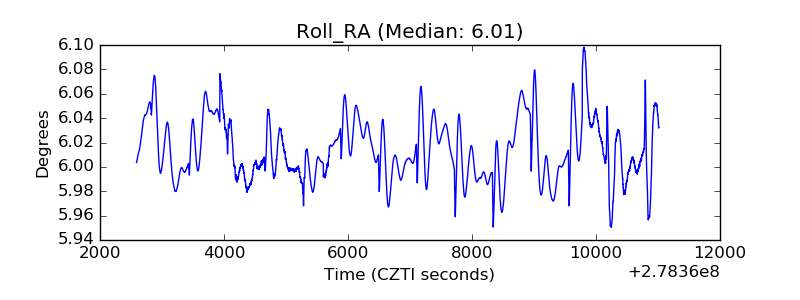 |
| Veto Counter | 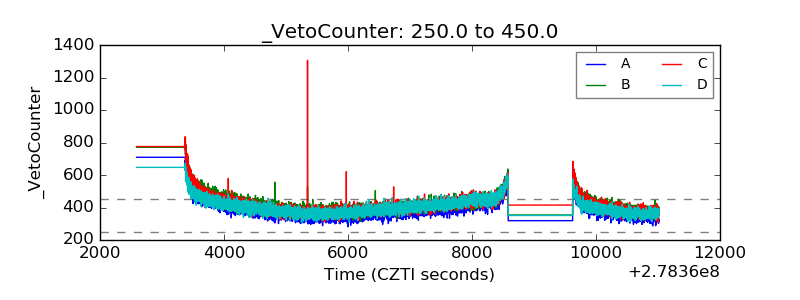 |