| Param | Original file | Final file |
|---|---|---|
| Filename | modeM0/AS1A05_078T01_9000002462_16663cztM0_level2.evt | modeM0/AS1A05_078T01_9000002462_16663cztM0_level2_quad_clean.evt |
| Size (bytes) | 462,597,120 | 130,098,240 |
| Size | 441.2 MB | 124.1 MB |
| Events in quadrant A | 3,341,137 | 875,106 |
| Events in quadrant B | 3,904,701 | 887,973 |
| Events in quadrant C | 3,169,535 | 851,114 |
| Events in quadrant D | 3,118,142 | 838,250 |
| Mode M0 | |||
|---|---|---|---|
| Quadrant | BADHDUFLAG | Total packets | Discarded packets |
| A | 0 | 14833 | 3 |
| B | 0 | 16229 | 2 |
| C | 0 | 14196 | 2 |
| D | 0 | 14501 | 2 |
| Mode SS | |||
|---|---|---|---|
| Quadrant | BADHDUFLAG | Total packets | Discarded packets |
| A | 0 | 142 | 0 |
| B | 0 | 142 | 0 |
| C | 0 | 142 | 0 |
| D | 0 | 142 | 0 |
| Mode M9 | |||
|---|---|---|---|
| Quadrant | BADHDUFLAG | Total packets | Discarded packets |
| A | 0 | 15 | 0 |
| B | 0 | 15 | 0 |
| C | 0 | 15 | 0 |
| D | 0 | 16 | 0 |
| Quadrant | Total seconds | Saturated seconds | Saturation percentage |
|---|---|---|---|
| A | 7009 | 40 | 0.570695% |
| B | 7009 | 86 | 1.226994% |
| C | 7009 | 31 | 0.442288% |
| D | 7009 | 30 | 0.428021% |
Noise dominated data is calculated using 1-second bins in cleaned event files. If a bin has >2000 counts, and if more than 50% of those come from <1% of pixels, then it is considered to be noise-dominated and hence unusable.
| Quadrant | # 1 sec bins | Bins with >0 counts | Bins with >2000 counts | High rate bins dominated by noise | Noise dominated (total time) | Noise dominated (detector-on time) | Marked lightcurve |
|---|---|---|---|---|---|---|---|
| A | 7640 | 7011 | 23 | 23 | 0.30% | 0.33% | 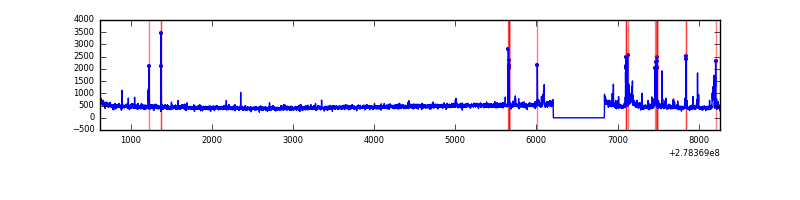 |
| B | 7640 | 7011 | 23 | 23 | 0.30% | 0.33% | 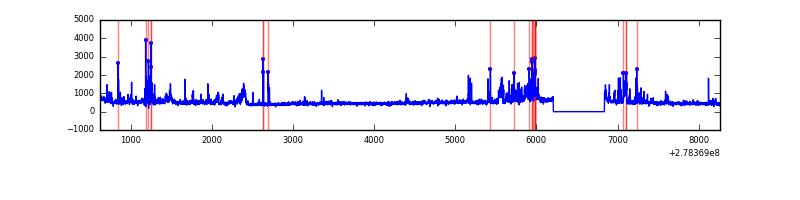 |
| C | 7640 | 7011 | 0 | 0 | 0.00% | 0.00% | 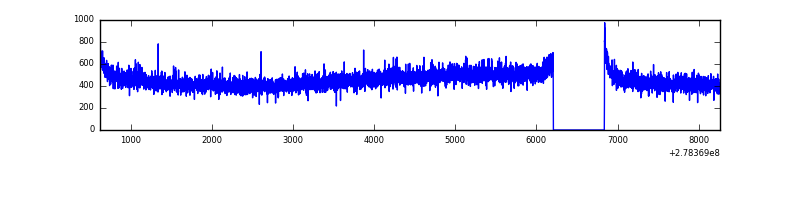 |
| D | 7640 | 7011 | 12 | 12 | 0.16% | 0.17% | 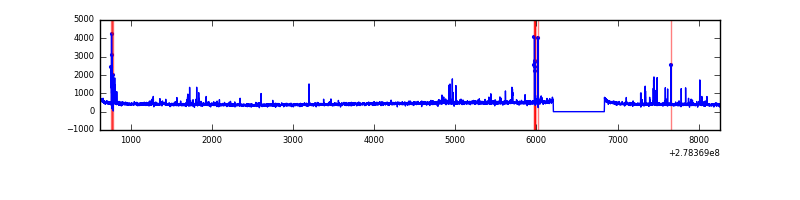 |
Top three noisy pixels from each quadrant. If the there are fewer than three noisy pixels in the level2.evt file, extra rows are filled as -1
| Pixel properties | Quadrant properties | ||||||
|---|---|---|---|---|---|---|---|
| Quadrant | DetID | PixID | Counts | Sigma | Mean | Median | Sigma |
| A | 15 | 174 | 182801 | 1119.34 | 803 | 785 | 162.6 |
| A | 12 | 96 | 35532 | 213.68 | 803 | 785 | 162.6 |
| A | 9 | 143 | 16228 | 94.97 | 803 | 785 | 162.6 |
| B | 15 | 35 | 324049 | 2124.25 | 808 | 787 | 152.2 |
| B | 0 | 229 | 161647 | 1057.06 | 808 | 787 | 152.2 |
| B | 0 | 197 | 68874 | 447.42 | 808 | 787 | 152.2 |
| C | 14 | 238 | 120083 | 666.21 | 771 | 773 | 179.1 |
| C | 7 | 247 | 13334 | 70.14 | 771 | 773 | 179.1 |
| C | 3 | 233 | 13280 | 69.84 | 771 | 773 | 179.1 |
| D | 15 | 0 | 40362 | 208.16 | 776 | 752 | 190.3 |
| D | 2 | 16 | 32374 | 166.18 | 776 | 752 | 190.3 |
| D | 2 | 234 | 31634 | 162.3 | 776 | 752 | 190.3 |
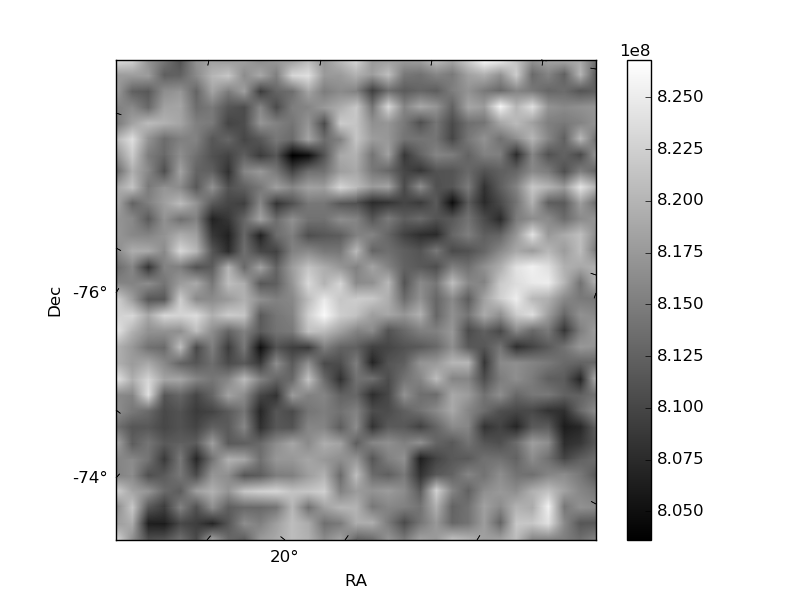
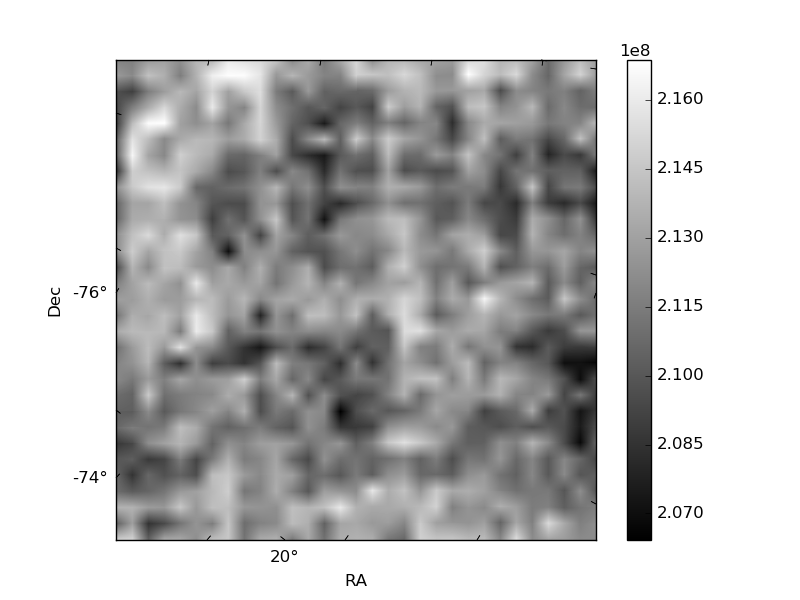
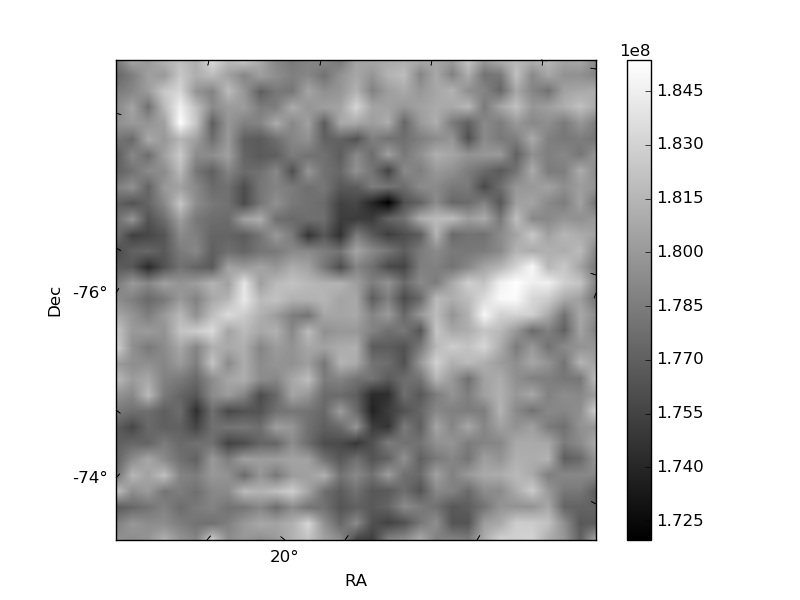
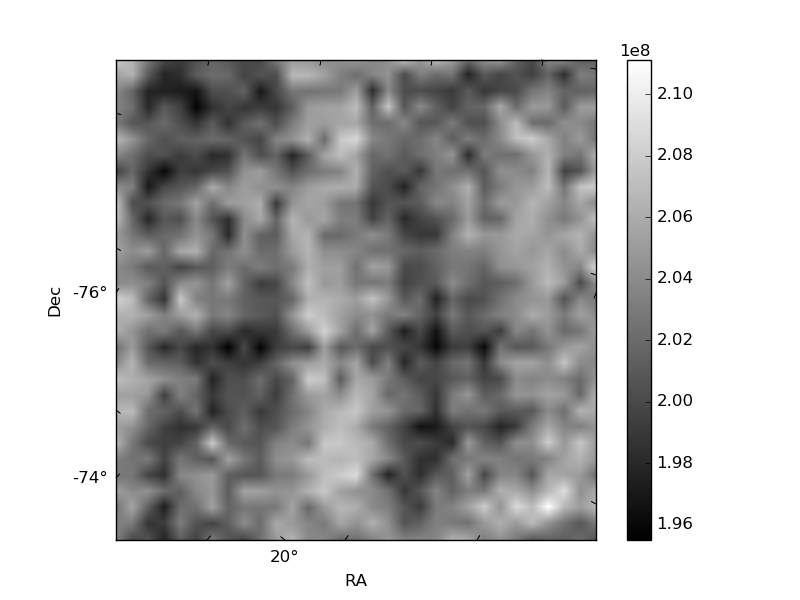
Histogram calculated using DETX and DETY for each event in the final _common_clean file
| Quadrant A | 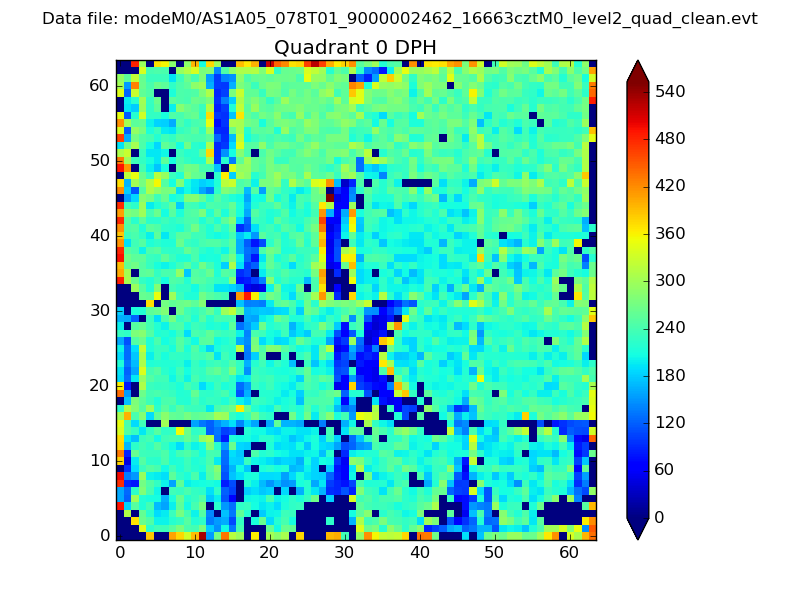 |
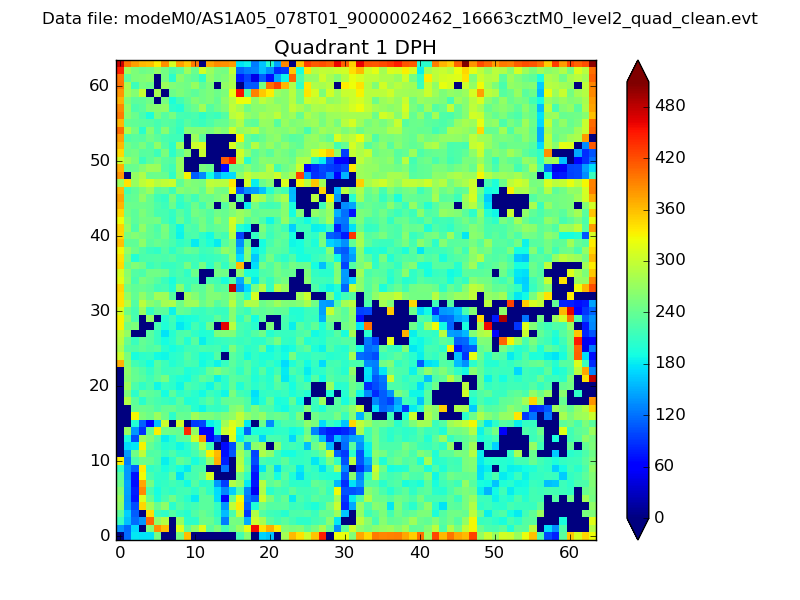 |
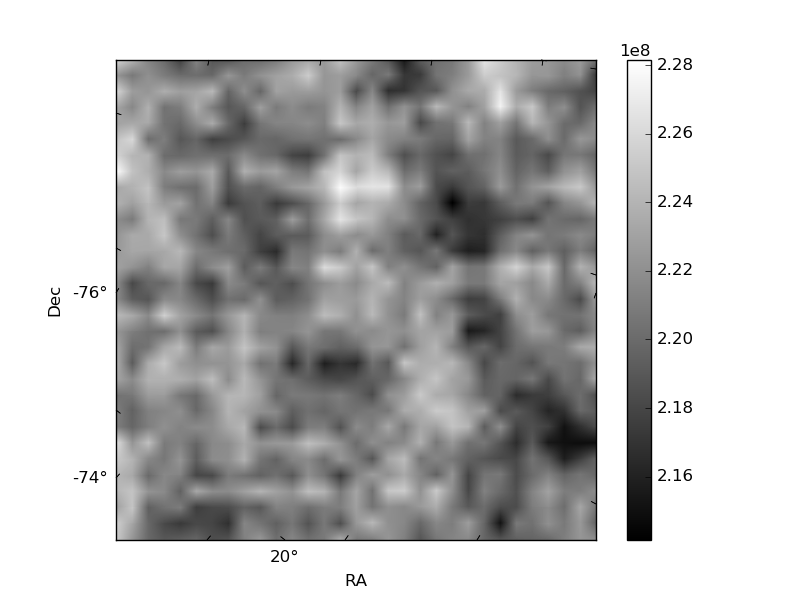
Quadrant B |
|---|---|---|---|
| Quadrant D | 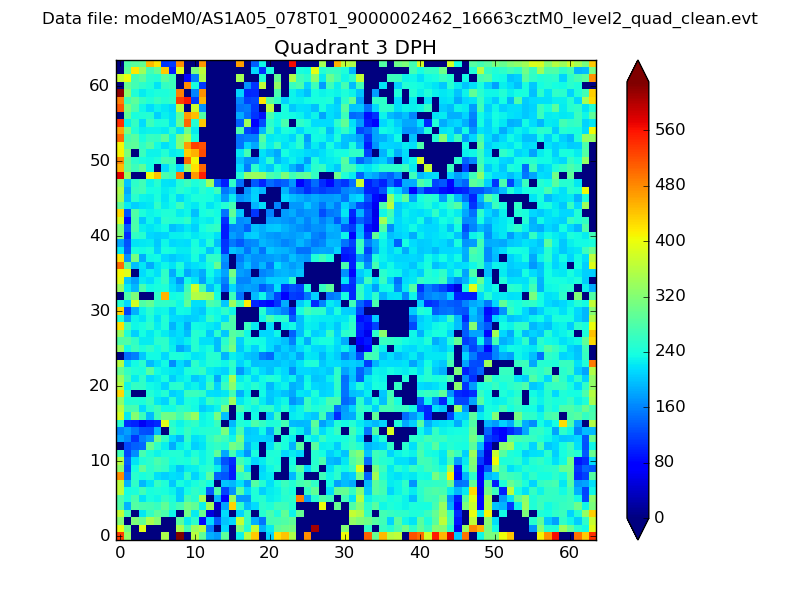 |
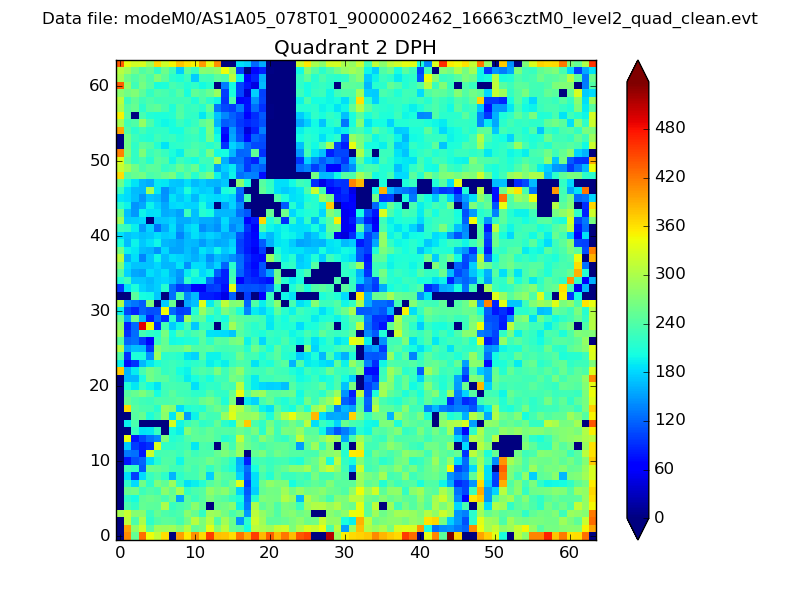 |
Quadrant C |
| Plot type | Count rate plots | Images |
|---|---|---|
| Comparison with Poisson distribution Blue bars denote a histogram of data divided into 1 sec bins. Red curve is a Poisson curve with rate = median count rate of data. |
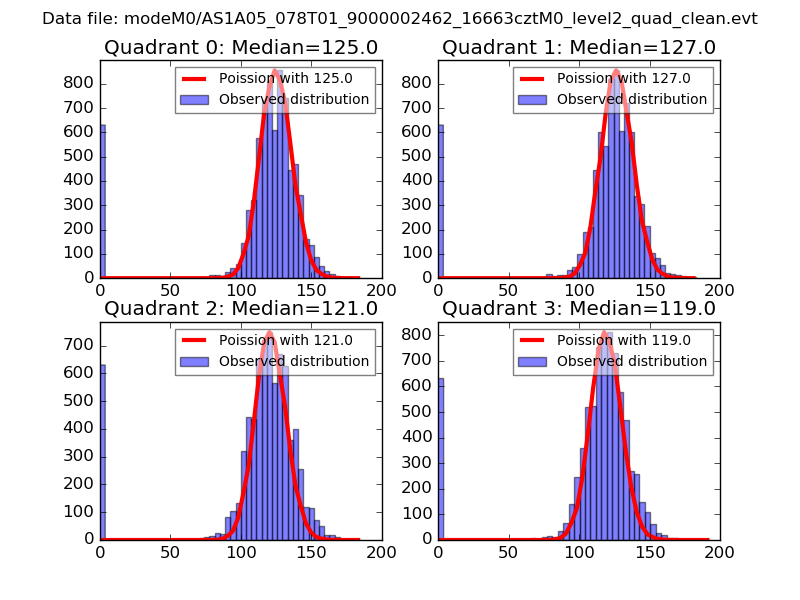 |
 |
| Quadrant-wise count rates Data is divided into 100 sec bins |
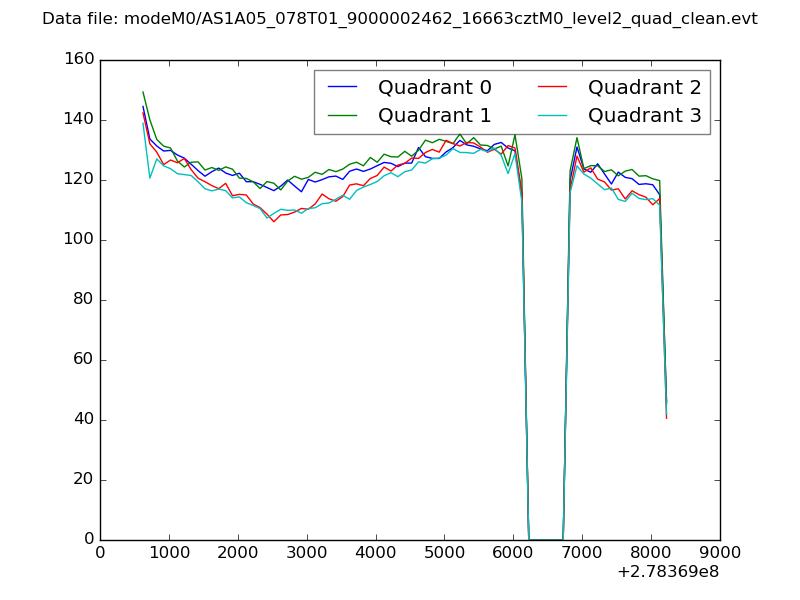 |
|
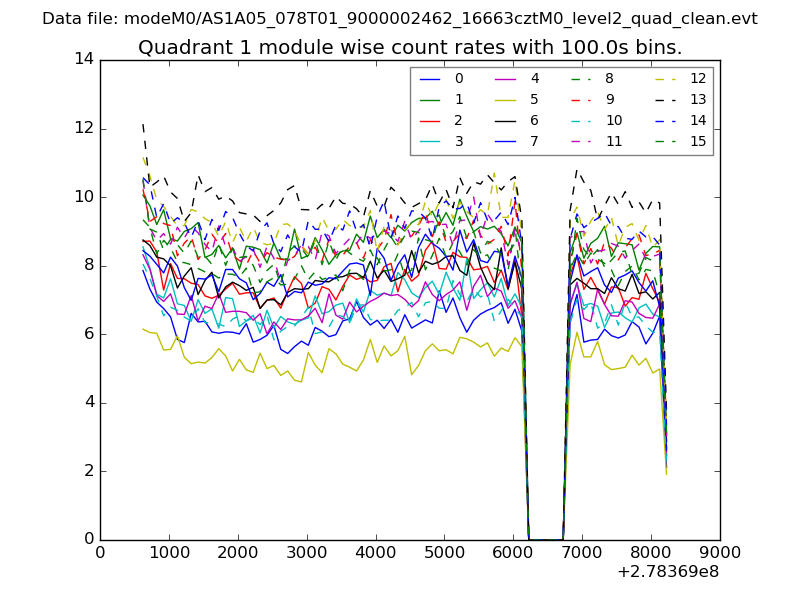
| Module-wise count rates for Quadrant A Data is divided into 100 sec bins |
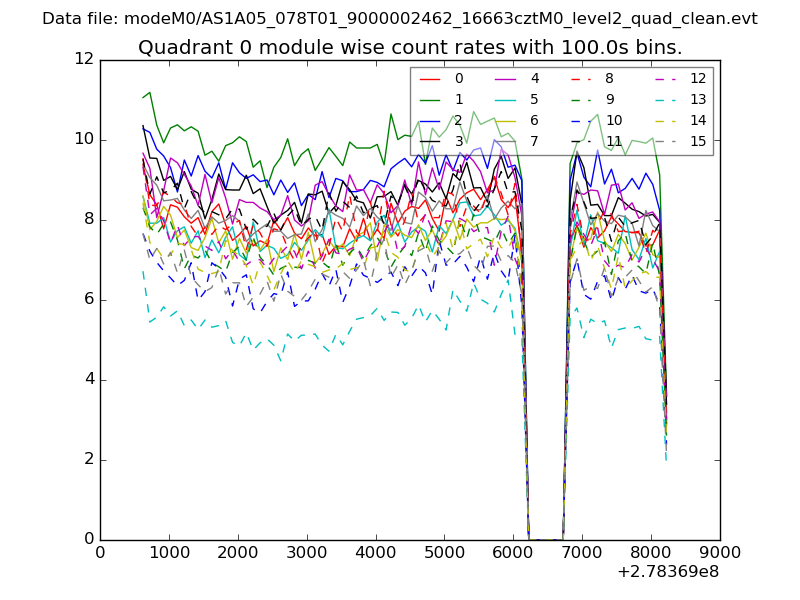 |
 |
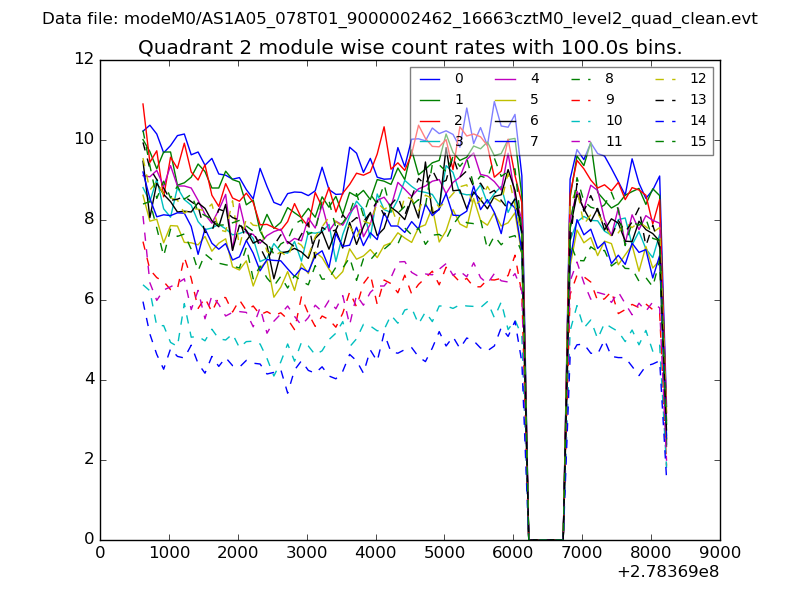
| Module-wise count rates for Quadrant B Data is divided into 100 sec bins |
 |
 |
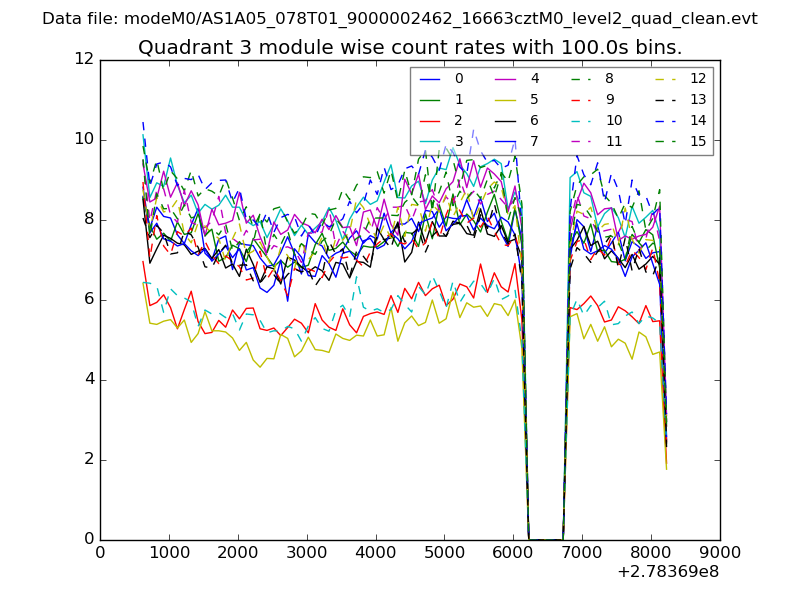
| Module-wise count rates for Quadrant C Data is divided into 100 sec bins |
 |
 |
| Module-wise count rates for Quadrant D Data is divided into 100 sec bins |
 |
 |
| Parameter | Plot |
|---|---|
| CZT HV Monitor | 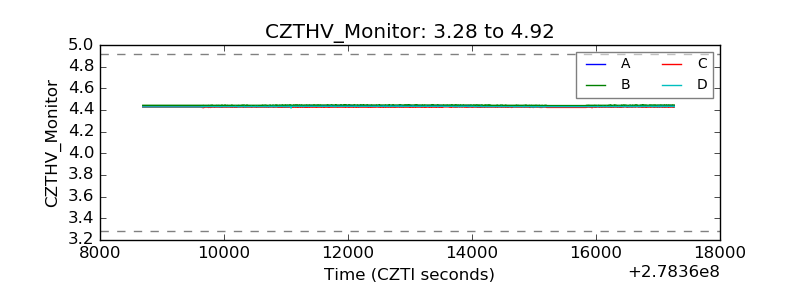 |
| D_VDD | 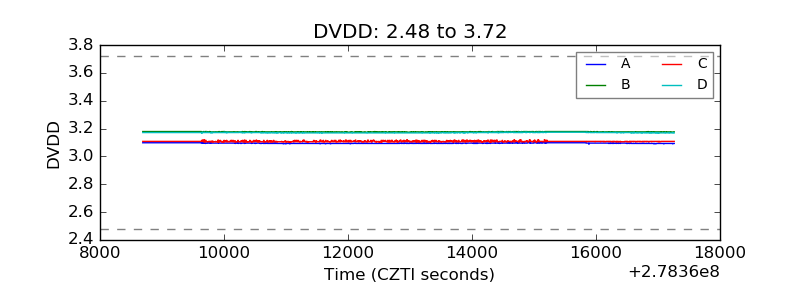 |
| Temperature 1 | 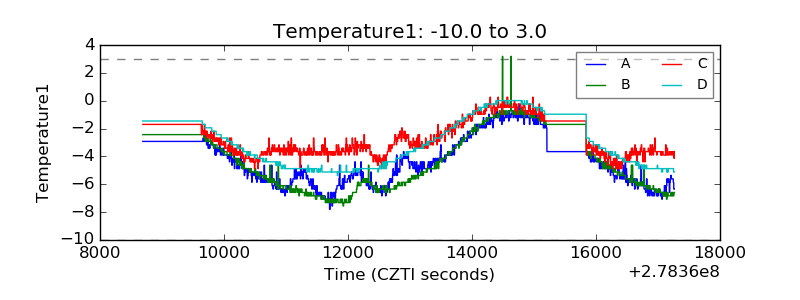 |
| Veto HV Monitor | 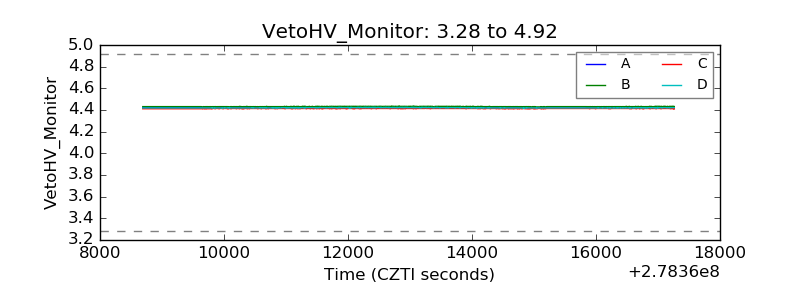 |
| Veto LLD | 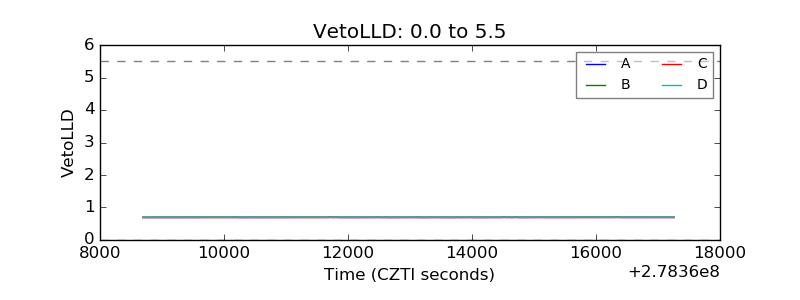 |
| Alpha Counter | 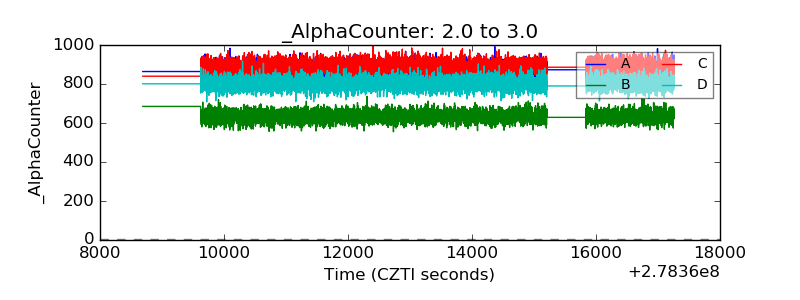 |
| _CPM_Rate | 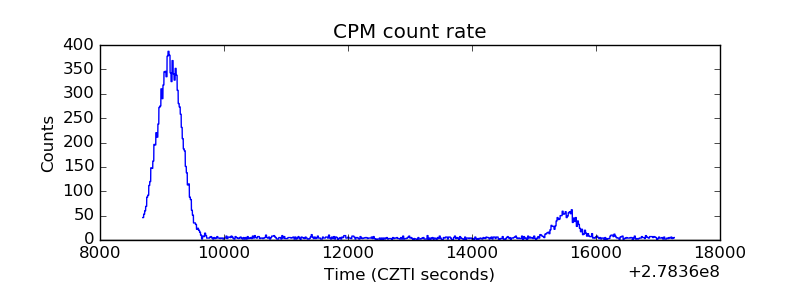 |
| CZT Counter | 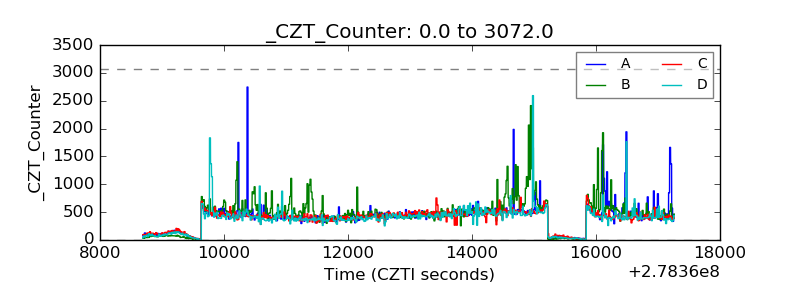 |
| +2.5 Volts monitor | 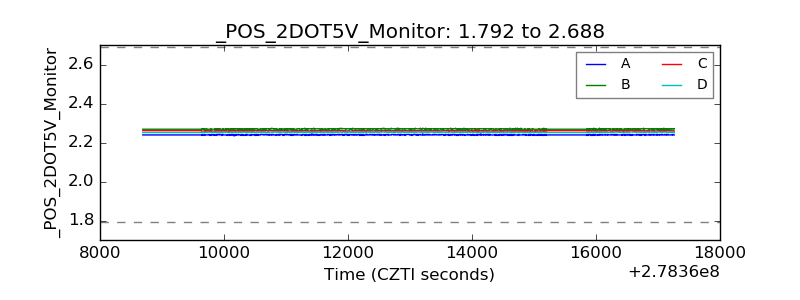 |
| +5 Volts monitor |  |
| _ROLL_ROT |  |
| _Roll_DEC | 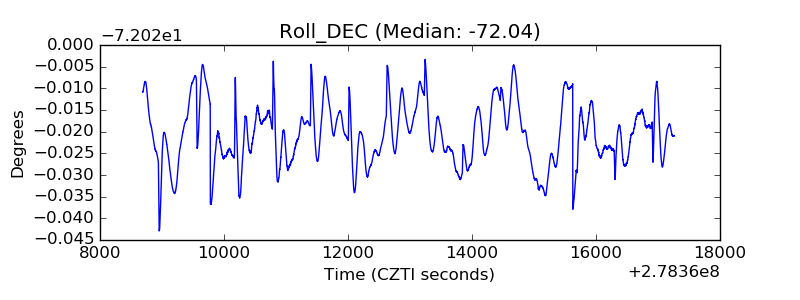 |
| _Roll_RA | 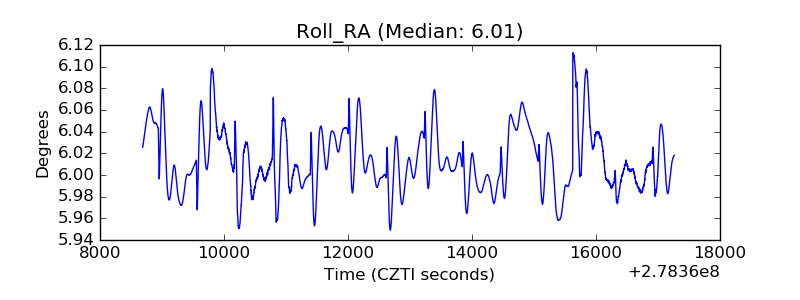 |
| Veto Counter | 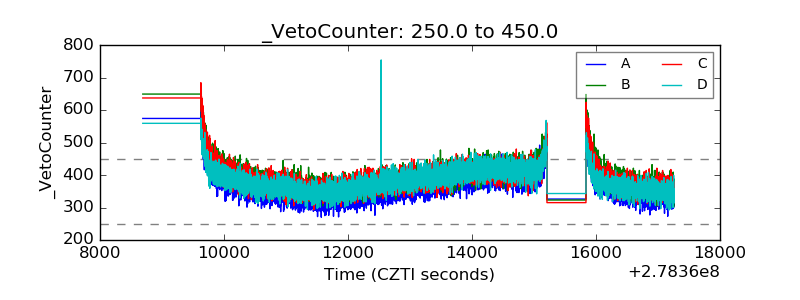 |