| Param | Original file | Final file |
|---|---|---|
| Filename | modeM0/AS1A05_078T01_9000002462_16664cztM0_level2.evt | modeM0/AS1A05_078T01_9000002462_16664cztM0_level2_quad_clean.evt |
| Size (bytes) | 626,719,680 | 146,125,440 |
| Size | 597.7 MB | 139.4 MB |
| Events in quadrant A | 3,976,076 | 984,405 |
| Events in quadrant B | 4,523,806 | 1,001,428 |
| Events in quadrant C | 3,652,602 | 958,601 |
| Events in quadrant D | 6,280,516 | 920,164 |
| Mode M0 | |||
|---|---|---|---|
| Quadrant | BADHDUFLAG | Total packets | Discarded packets |
| A | 0 | 17412 | 3 |
| B | 0 | 18831 | 2 |
| C | 0 | 16437 | 2 |
| D | 0 | 24283 | 2 |
| Mode SS | |||
|---|---|---|---|
| Quadrant | BADHDUFLAG | Total packets | Discarded packets |
| A | 0 | 168 | 0 |
| B | 0 | 168 | 0 |
| C | 0 | 168 | 0 |
| D | 0 | 168 | 0 |
| Mode M9 | |||
|---|---|---|---|
| Quadrant | BADHDUFLAG | Total packets | Discarded packets |
| A | 0 | 8 | 0 |
| B | 0 | 8 | 0 |
| C | 0 | 8 | 0 |
| D | 0 | 8 | 0 |
| Quadrant | Total seconds | Saturated seconds | Saturation percentage |
|---|---|---|---|
| A | 8063 | 102 | 1.265038% |
| B | 8063 | 179 | 2.220017% |
| C | 8063 | 104 | 1.289842% |
| D | 8063 | 460 | 5.705073% |
Noise dominated data is calculated using 1-second bins in cleaned event files. If a bin has >2000 counts, and if more than 50% of those come from <1% of pixels, then it is considered to be noise-dominated and hence unusable.
| Quadrant | # 1 sec bins | Bins with >0 counts | Bins with >2000 counts | High rate bins dominated by noise | Noise dominated (total time) | Noise dominated (detector-on time) | Marked lightcurve |
|---|---|---|---|---|---|---|---|
| A | 8919 | 8066 | 22 | 22 | 0.25% | 0.27% | 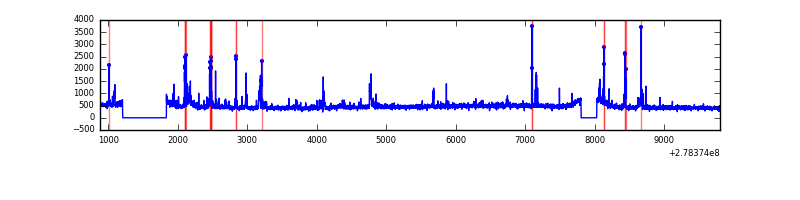 |
| B | 8919 | 8066 | 22 | 22 | 0.25% | 0.27% | 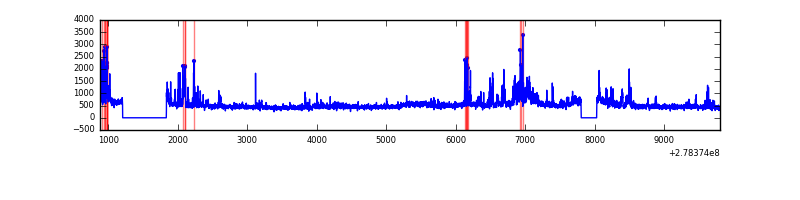 |
| C | 8919 | 8066 | 0 | 0 | 0.00% | 0.00% | 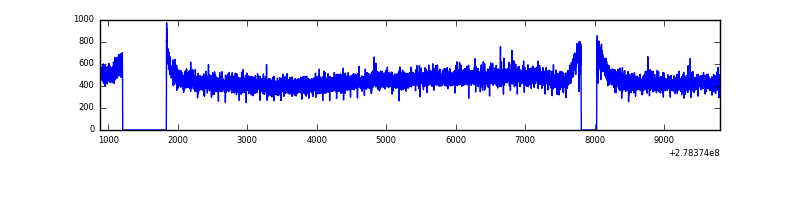 |
| D | 8919 | 8066 | 424 | 424 | 4.75% | 5.26% |  |
Top three noisy pixels from each quadrant. If the there are fewer than three noisy pixels in the level2.evt file, extra rows are filled as -1
| Pixel properties | Quadrant properties | ||||||
|---|---|---|---|---|---|---|---|
| Quadrant | DetID | PixID | Counts | Sigma | Mean | Median | Sigma |
| A | 15 | 174 | 329969 | 1756.71 | 929 | 906 | 187.3 |
| A | 9 | 143 | 43911 | 229.58 | 929 | 906 | 187.3 |
| A | 12 | 96 | 14897 | 74.69 | 929 | 906 | 187.3 |
| B | 15 | 35 | 381723 | 2161.13 | 935 | 910 | 176.2 |
| B | 0 | 229 | 161977 | 914.06 | 935 | 910 | 176.2 |
| B | 4 | 216 | 59241 | 331.03 | 935 | 910 | 176.2 |
| C | 14 | 238 | 138131 | 658.98 | 892 | 894 | 208.3 |
| C | 3 | 233 | 19716 | 90.38 | 892 | 894 | 208.3 |
| C | 7 | 247 | 10006 | 43.75 | 892 | 894 | 208.3 |
| D | 1 | 52 | 2524523 | 11771.88 | 885 | 855 | 214.4 |
| D | 15 | 0 | 278058 | 1293.04 | 885 | 855 | 214.4 |
| D | 13 | 248 | 42528 | 194.39 | 885 | 855 | 214.4 |
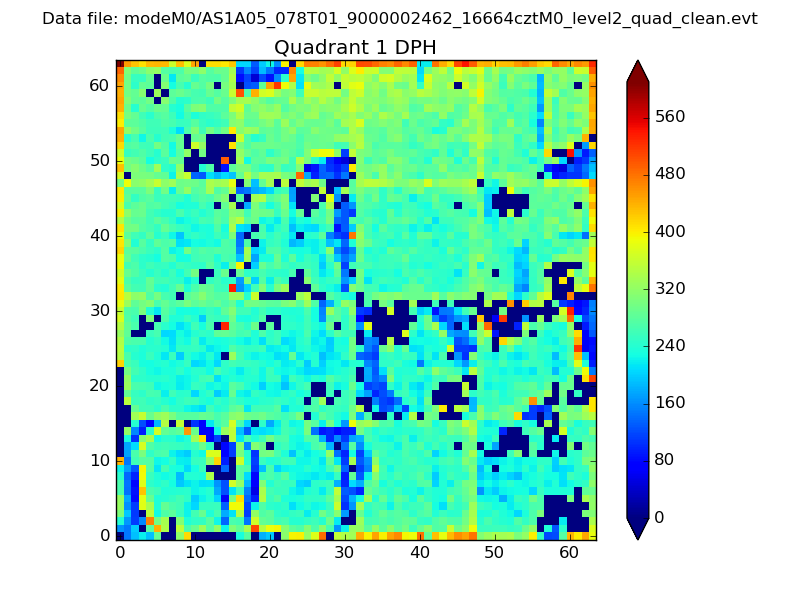
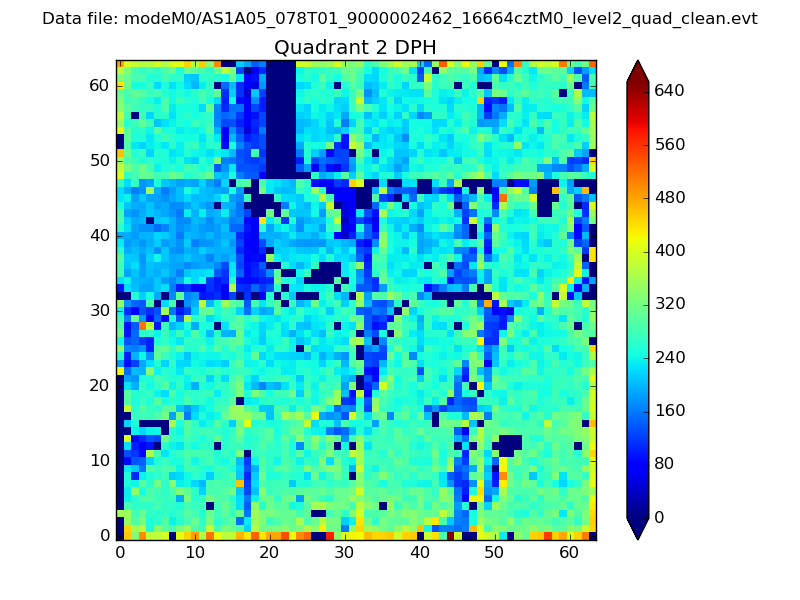
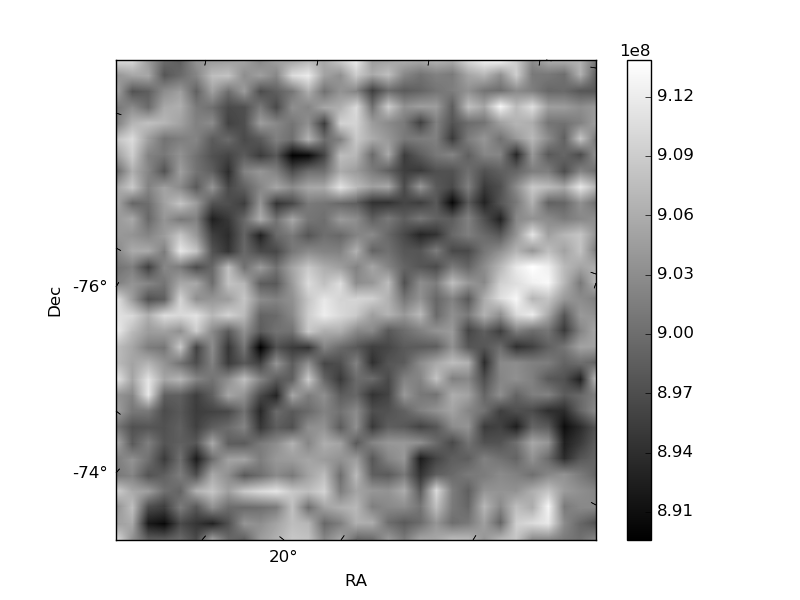
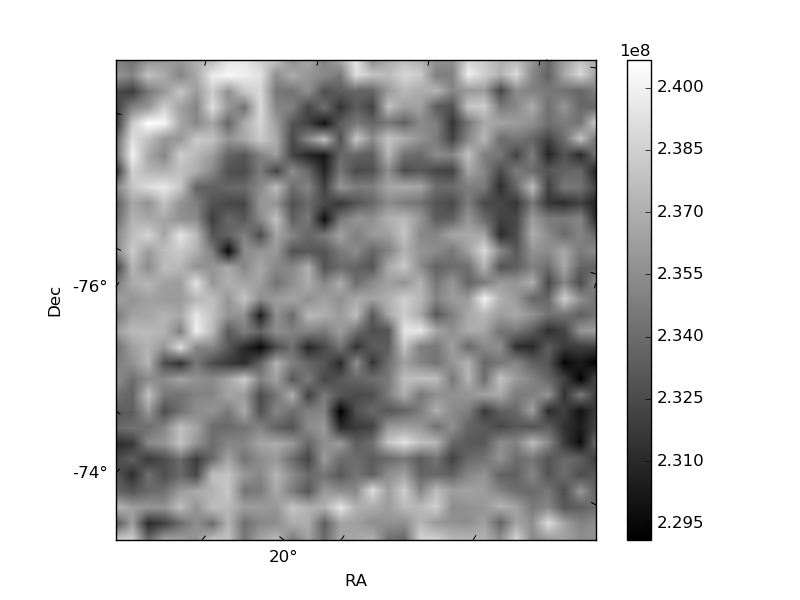
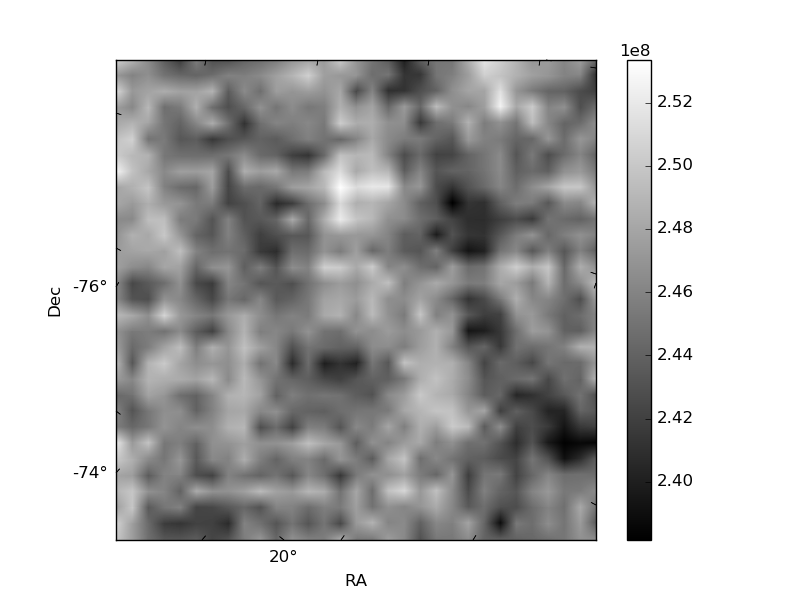
Histogram calculated using DETX and DETY for each event in the final _common_clean file
| Quadrant A | 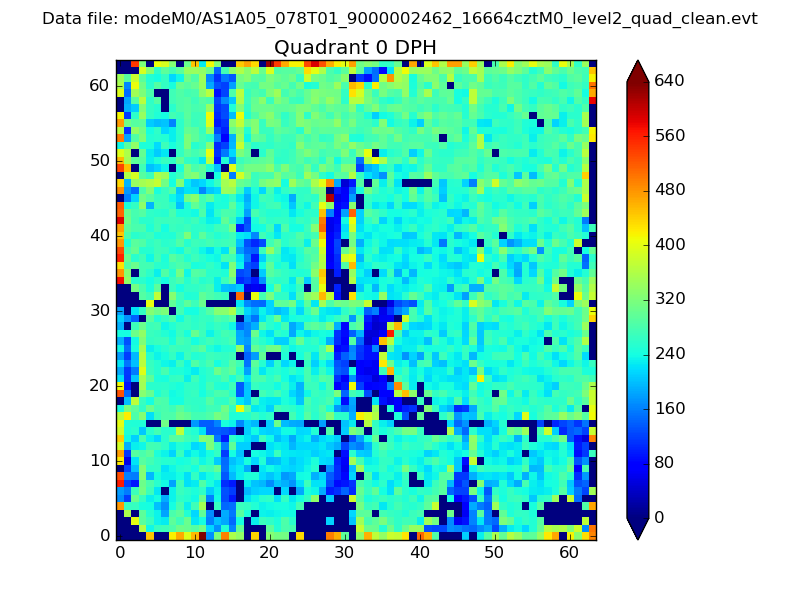 |
 |
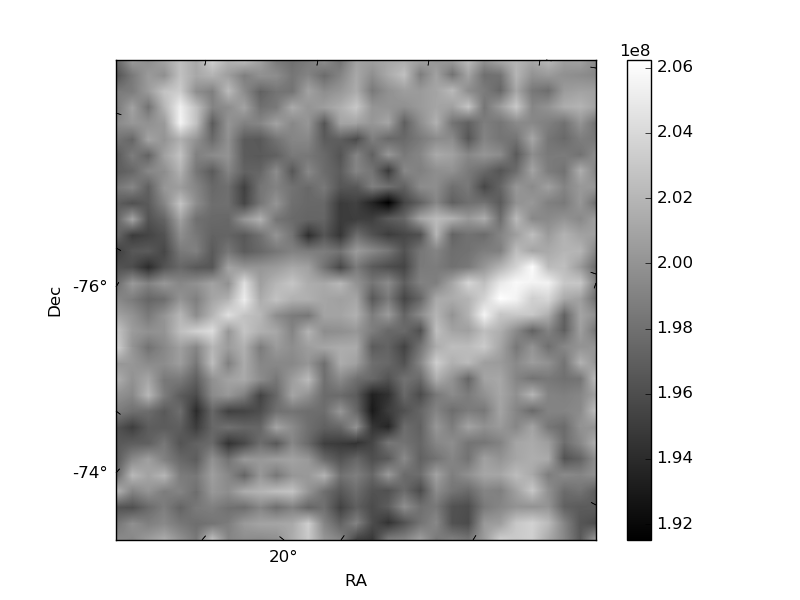
Quadrant B |
|---|---|---|---|
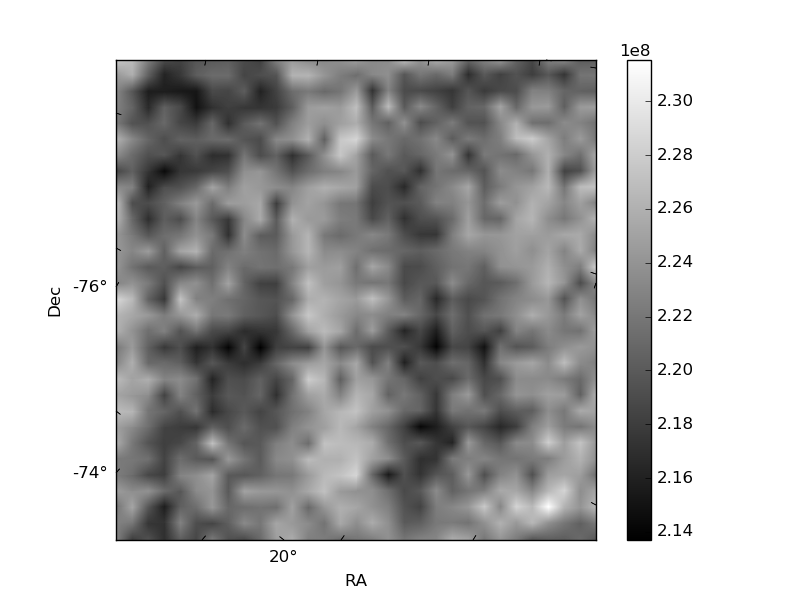
| Quadrant D | 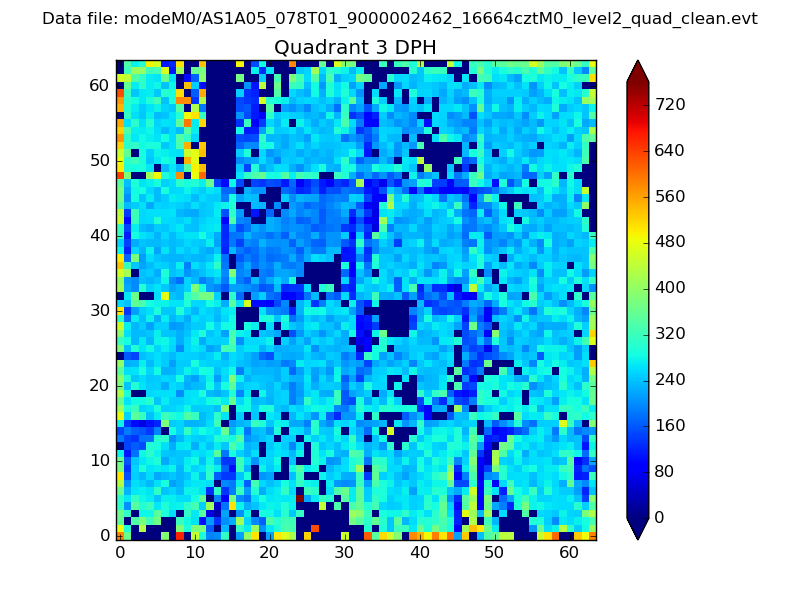 |
 |
Quadrant C |
| Plot type | Count rate plots | Images |
|---|---|---|
| Comparison with Poisson distribution Blue bars denote a histogram of data divided into 1 sec bins. Red curve is a Poisson curve with rate = median count rate of data. |
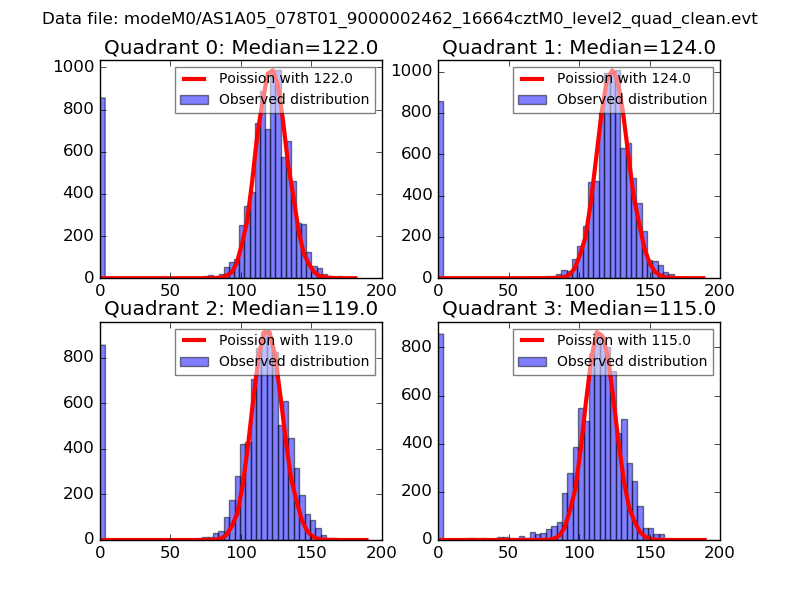 |
 |
| Quadrant-wise count rates Data is divided into 100 sec bins |
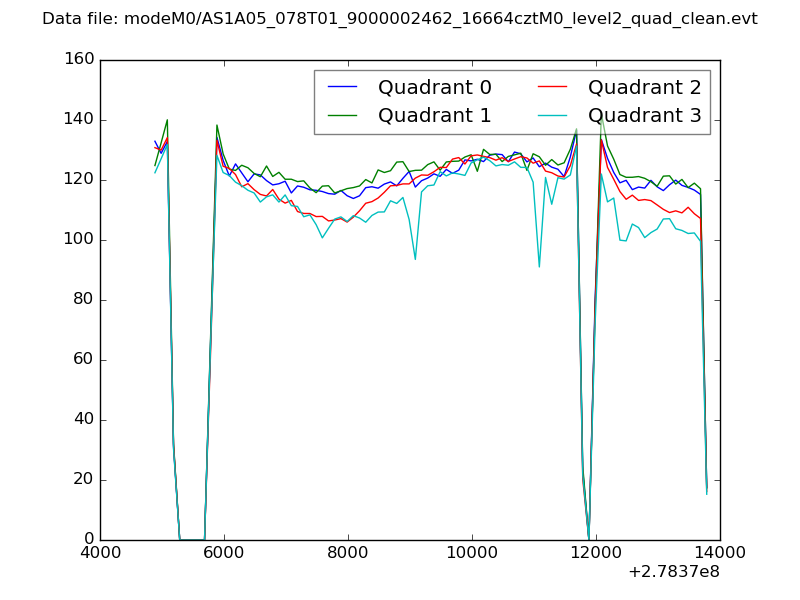 |
|
| Module-wise count rates for Quadrant A Data is divided into 100 sec bins |
 |
 |
| Module-wise count rates for Quadrant B Data is divided into 100 sec bins |
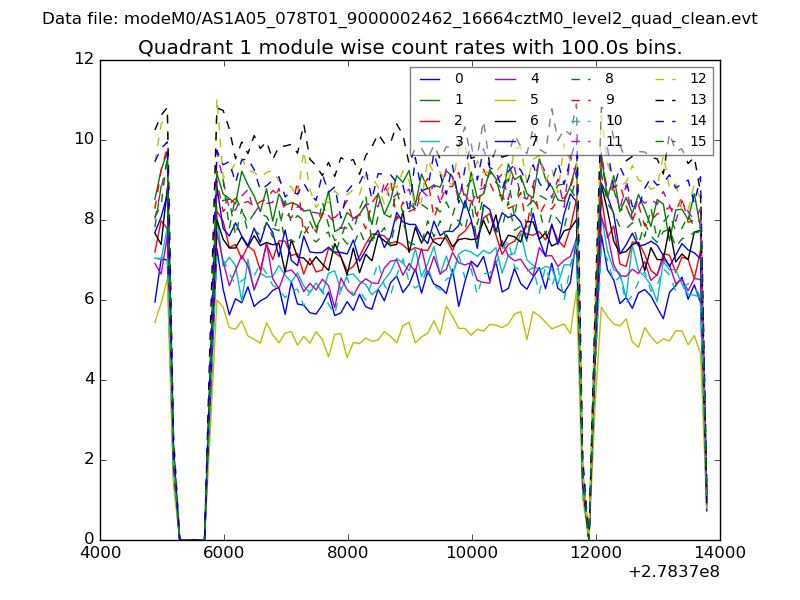 |
 |
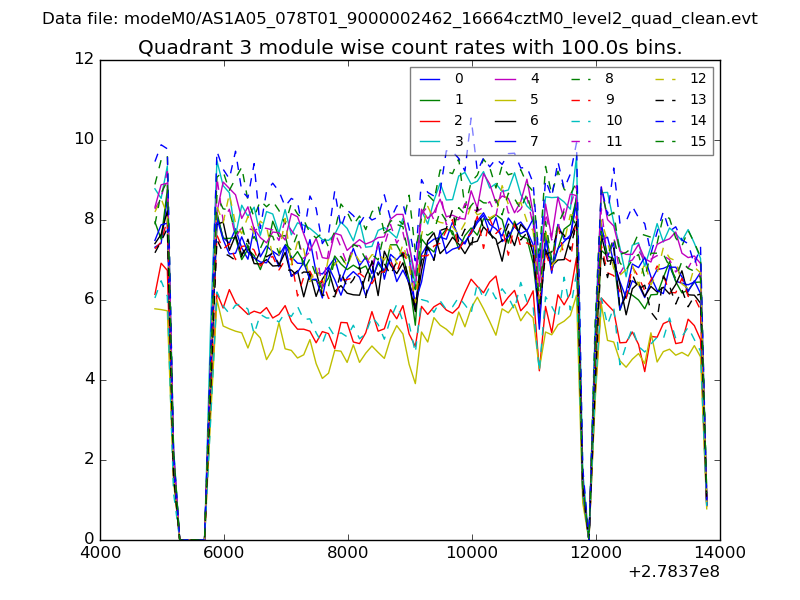
| Module-wise count rates for Quadrant C Data is divided into 100 sec bins |
 |
 |
| Module-wise count rates for Quadrant D Data is divided into 100 sec bins |
 |
 |
| Parameter | Plot |
|---|---|
| CZT HV Monitor | 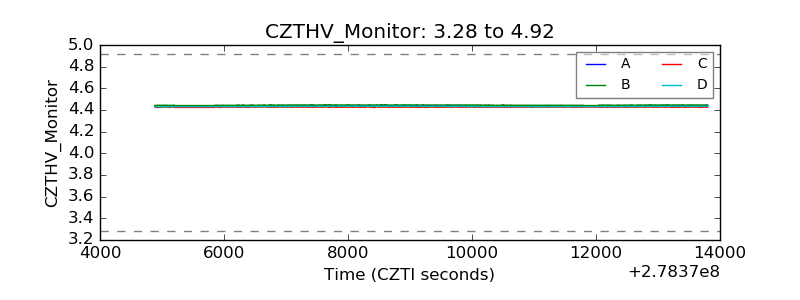 |
| D_VDD | 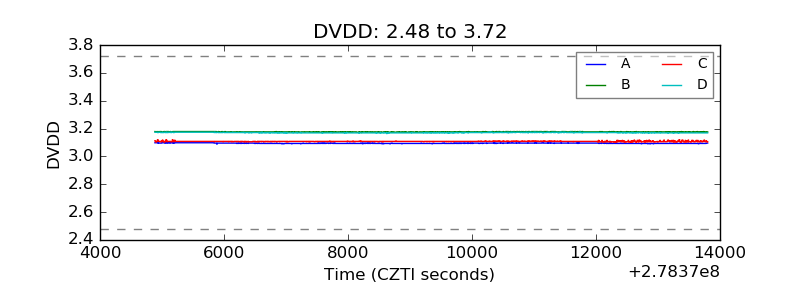 |
| Temperature 1 | 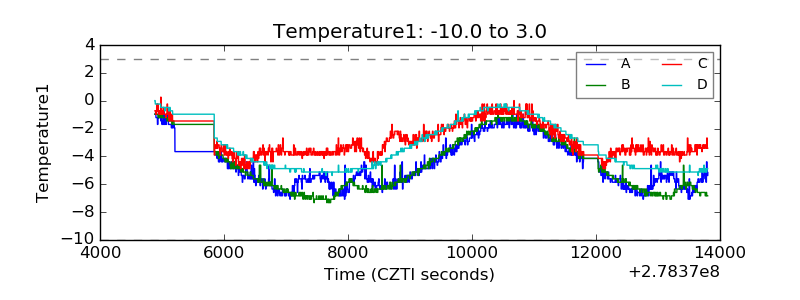 |
| Veto HV Monitor | 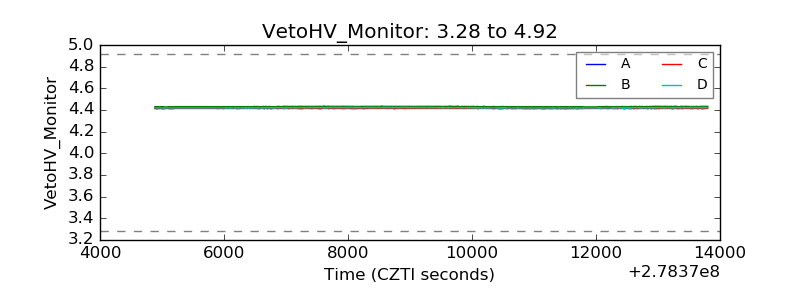 |
| Veto LLD |  |
| Alpha Counter | 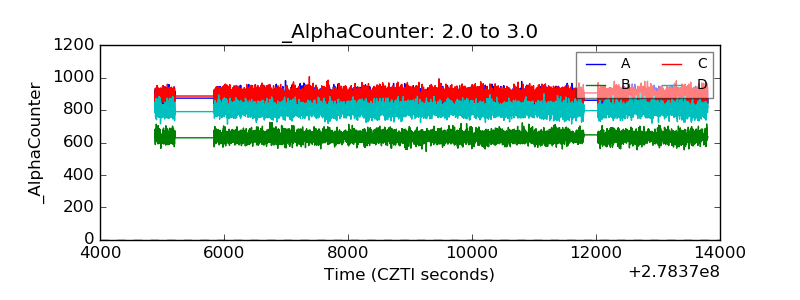 |
| _CPM_Rate | 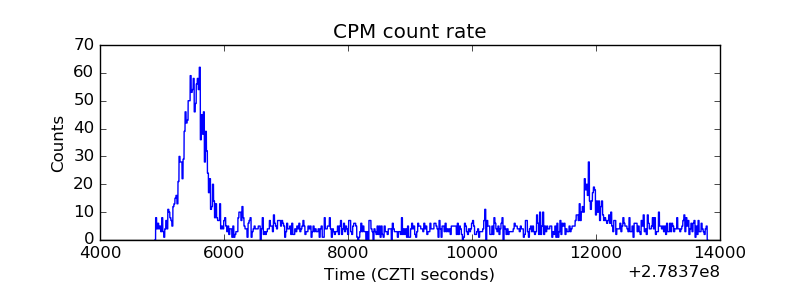 |
| CZT Counter | 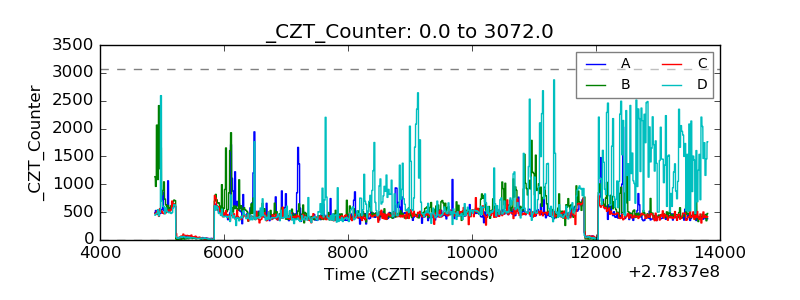 |
| +2.5 Volts monitor |  |
| +5 Volts monitor |  |
| _ROLL_ROT |  |
| _Roll_DEC | 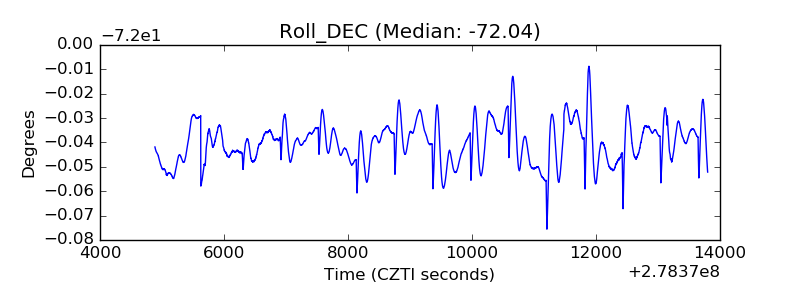 |
| _Roll_RA | 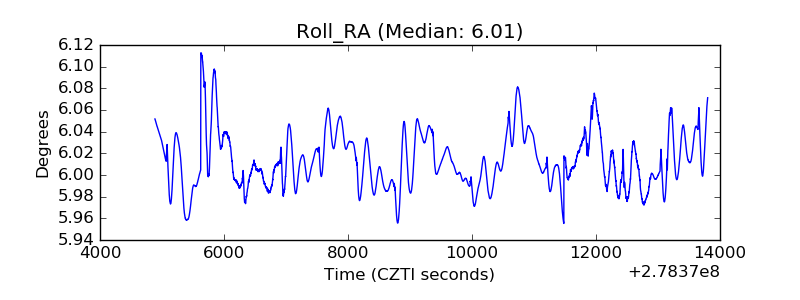 |
| Veto Counter | 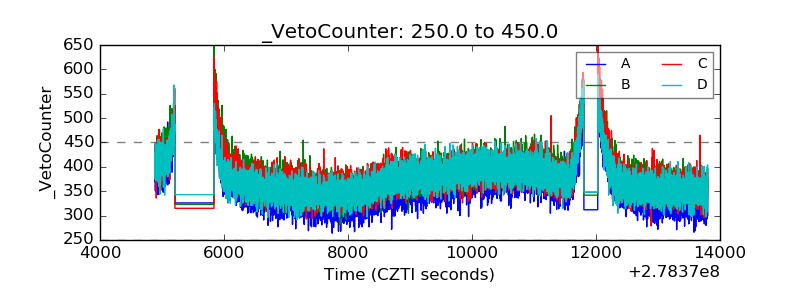 |