| Param | Original file | Final file |
|---|---|---|
| Filename | modeM0/AS1A05_078T01_9000002462_16669cztM0_level2.evt | modeM0/AS1A05_078T01_9000002462_16669cztM0_level2_quad_clean.evt |
| Size (bytes) | 520,453,440 | 117,184,320 |
| Size | 496.3 MB | 111.8 MB |
| Events in quadrant A | 4,504,361 | 761,682 |
| Events in quadrant B | 3,420,344 | 803,669 |
| Events in quadrant C | 3,048,239 | 779,630 |
| Events in quadrant D | 4,350,056 | 752,572 |
| Mode M0 | |||
|---|---|---|---|
| Quadrant | BADHDUFLAG | Total packets | Discarded packets |
| A | 0 | 17789 | 2 |
| B | 0 | 14163 | 1 |
| C | 0 | 13270 | 1 |
| D | 0 | 17156 | 1 |
| Mode SS | |||
|---|---|---|---|
| Quadrant | BADHDUFLAG | Total packets | Discarded packets |
| A | 0 | 130 | 0 |
| B | 0 | 130 | 0 |
| C | 0 | 130 | 0 |
| D | 0 | 130 | 0 |
| Mode M9 | |||
|---|---|---|---|
| Quadrant | BADHDUFLAG | Total packets | Discarded packets |
| A | 0 | 8 | 0 |
| B | 0 | 8 | 0 |
| C | 0 | 8 | 0 |
| D | 0 | 8 | 0 |
| Quadrant | Total seconds | Saturated seconds | Saturation percentage |
|---|---|---|---|
| A | 6476 | 475 | 7.334775% |
| B | 6476 | 83 | 1.281655% |
| C | 6476 | 83 | 1.281655% |
| D | 6476 | 132 | 2.038295% |
Noise dominated data is calculated using 1-second bins in cleaned event files. If a bin has >2000 counts, and if more than 50% of those come from <1% of pixels, then it is considered to be noise-dominated and hence unusable.
| Quadrant | # 1 sec bins | Bins with >0 counts | Bins with >2000 counts | High rate bins dominated by noise | Noise dominated (total time) | Noise dominated (detector-on time) | Marked lightcurve |
|---|---|---|---|---|---|---|---|
| A | 7262 | 6478 | 334 | 334 | 4.60% | 5.16% | 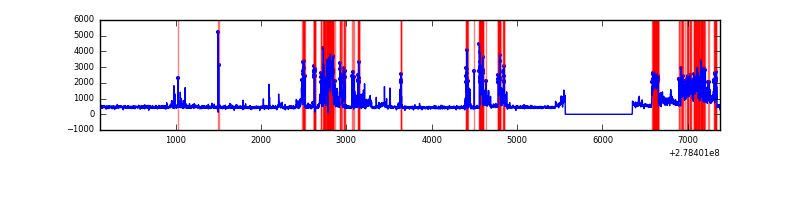 |
| B | 7262 | 6478 | 15 | 15 | 0.21% | 0.23% | 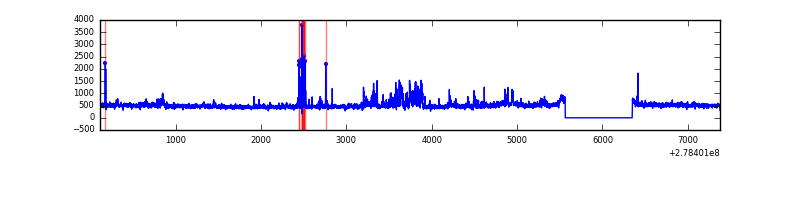 |
| C | 7262 | 6478 | 0 | 0 | 0.00% | 0.00% | 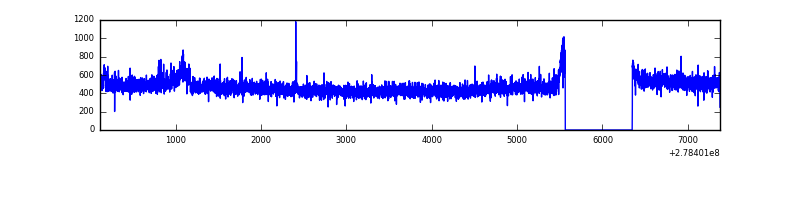 |
| D | 7262 | 6478 | 64 | 64 | 0.88% | 0.99% | 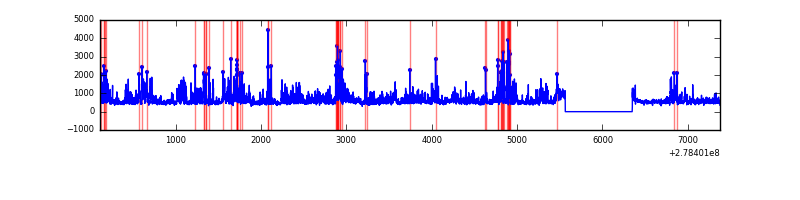 |
Top three noisy pixels from each quadrant. If the there are fewer than three noisy pixels in the level2.evt file, extra rows are filled as -1
| Pixel properties | Quadrant properties | ||||||
|---|---|---|---|---|---|---|---|
| Quadrant | DetID | PixID | Counts | Sigma | Mean | Median | Sigma |
| A | 15 | 174 | 1635680 | 10919.3 | 737 | 720 | 149.7 |
| A | 9 | 143 | 33274 | 217.42 | 737 | 720 | 149.7 |
| A | 0 | 226 | 6476 | 38.44 | 737 | 720 | 149.7 |
| B | 15 | 35 | 149409 | 1016.92 | 757 | 736 | 146.2 |
| B | 0 | 189 | 148172 | 1008.46 | 757 | 736 | 146.2 |
| B | 0 | 229 | 114628 | 779.02 | 757 | 736 | 146.2 |
| C | 14 | 238 | 113548 | 657.19 | 733 | 736 | 171.7 |
| C | 7 | 247 | 57770 | 332.25 | 733 | 736 | 171.7 |
| C | 3 | 233 | 21733 | 122.32 | 733 | 736 | 171.7 |
| D | 1 | 52 | 1288420 | 7226.42 | 736 | 713 | 178.2 |
| D | 10 | 70 | 115911 | 646.47 | 736 | 713 | 178.2 |
| D | 5 | 222 | 60727 | 336.79 | 736 | 713 | 178.2 |
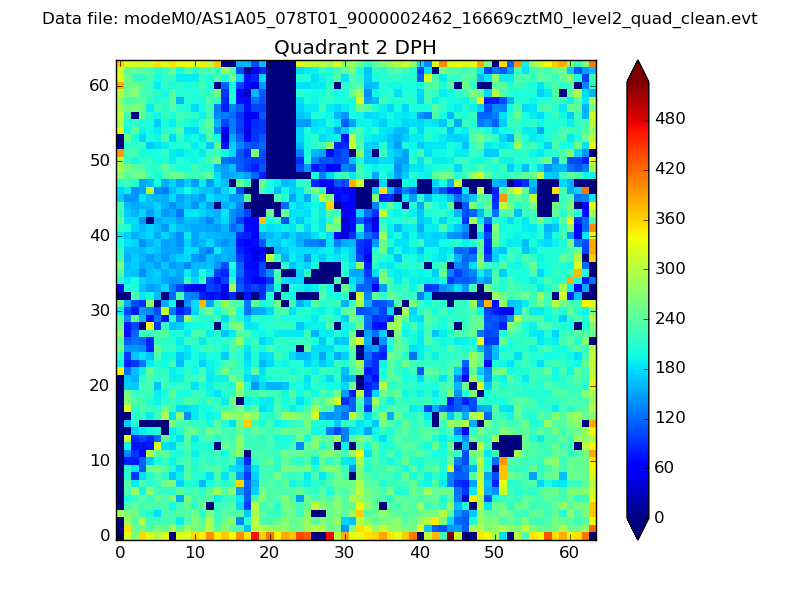
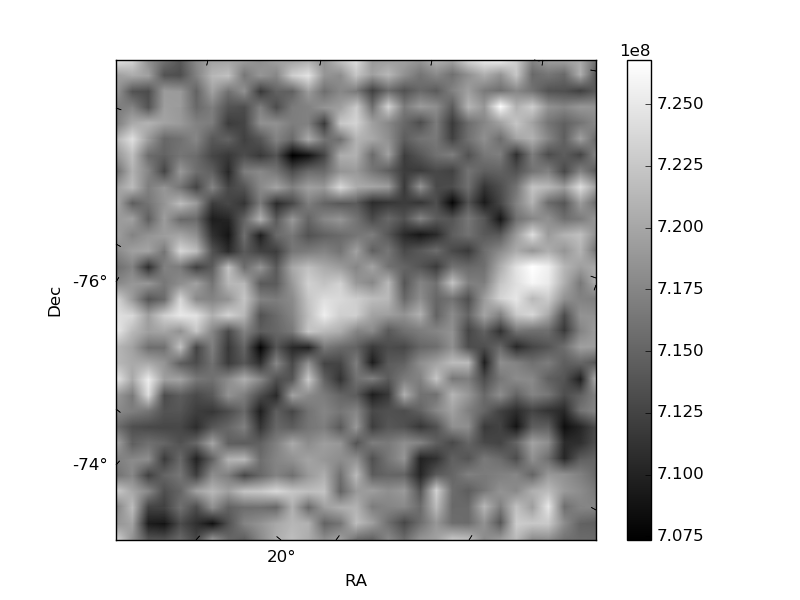
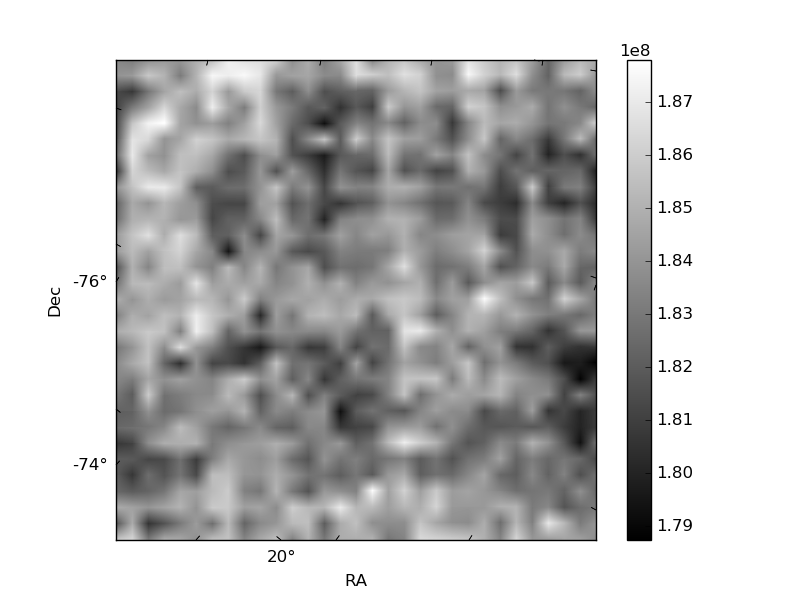
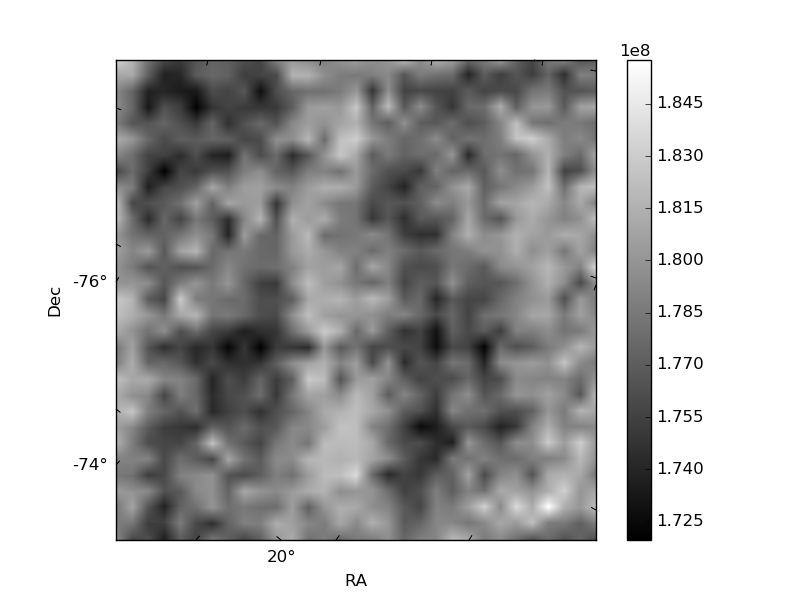
Histogram calculated using DETX and DETY for each event in the final _common_clean file
| Quadrant A | 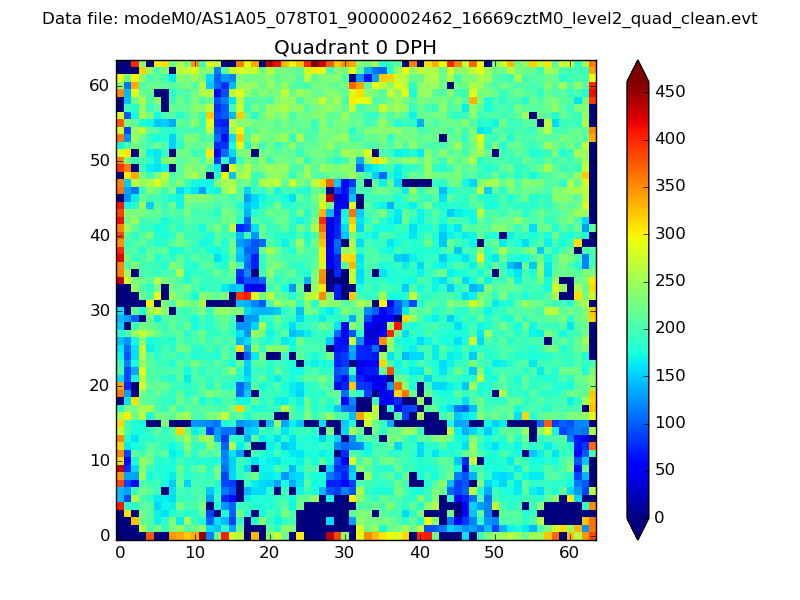 |
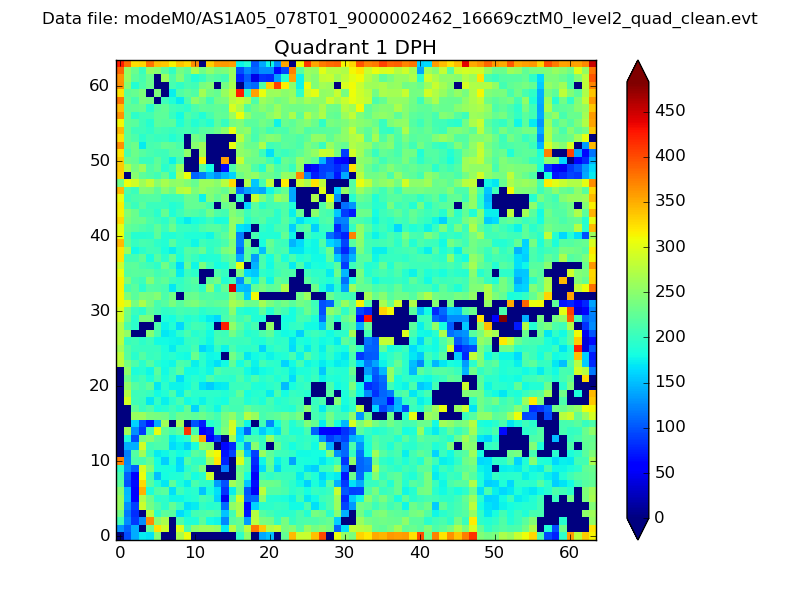 |
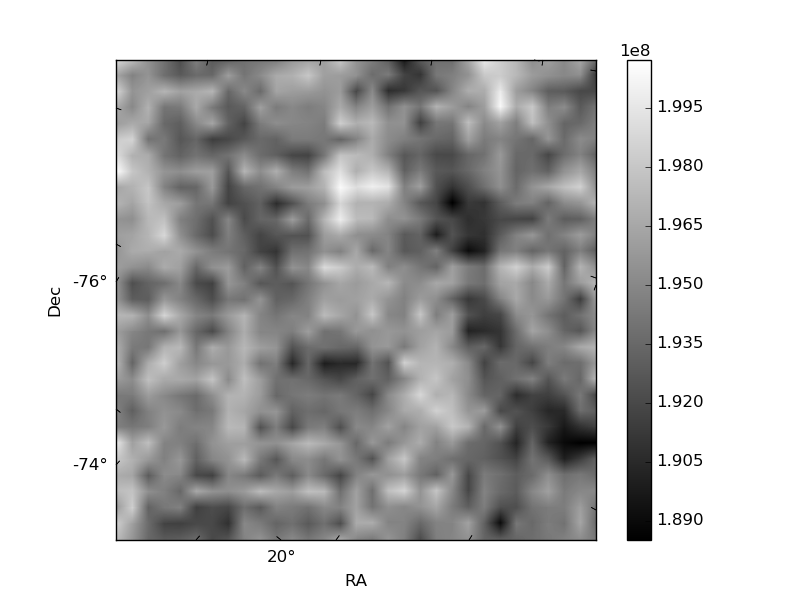
Quadrant B |
|---|---|---|---|
| Quadrant D | 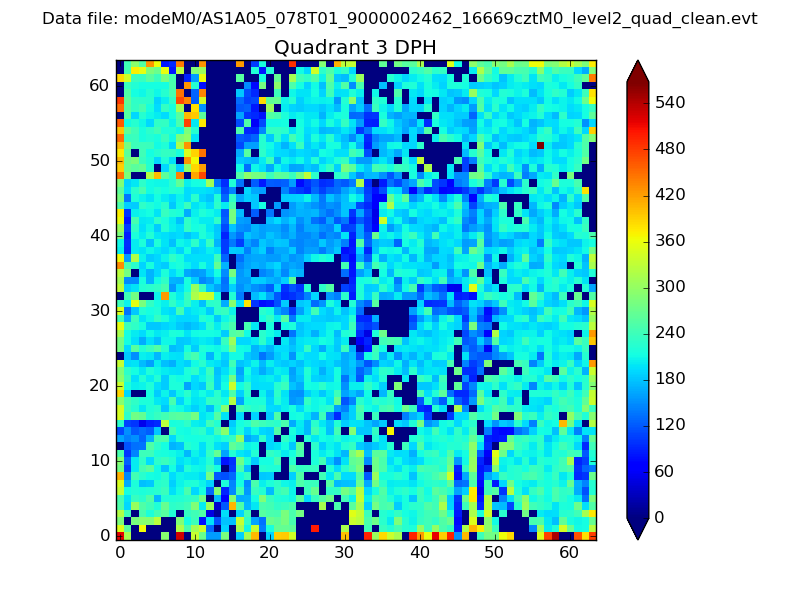 |
 |
Quadrant C |
| Plot type | Count rate plots | Images |
|---|---|---|
| Comparison with Poisson distribution Blue bars denote a histogram of data divided into 1 sec bins. Red curve is a Poisson curve with rate = median count rate of data. |
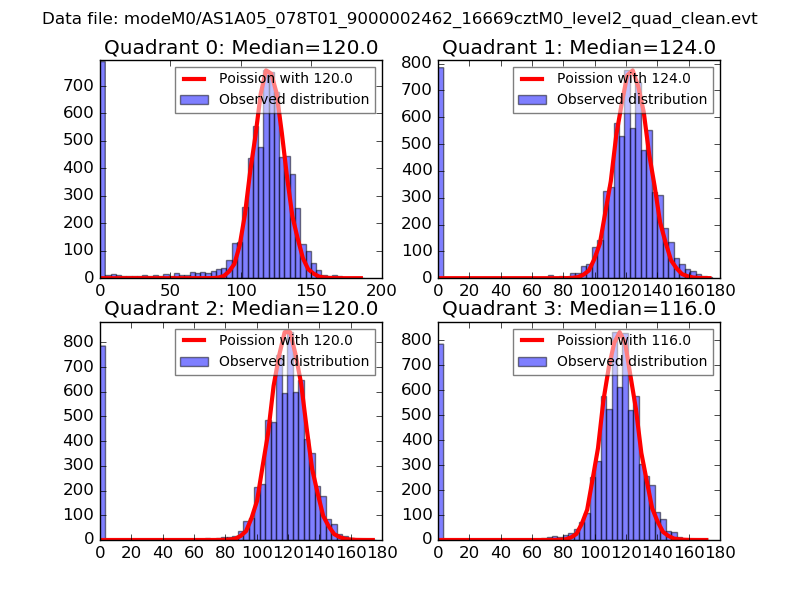 |
 |
| Quadrant-wise count rates Data is divided into 100 sec bins |
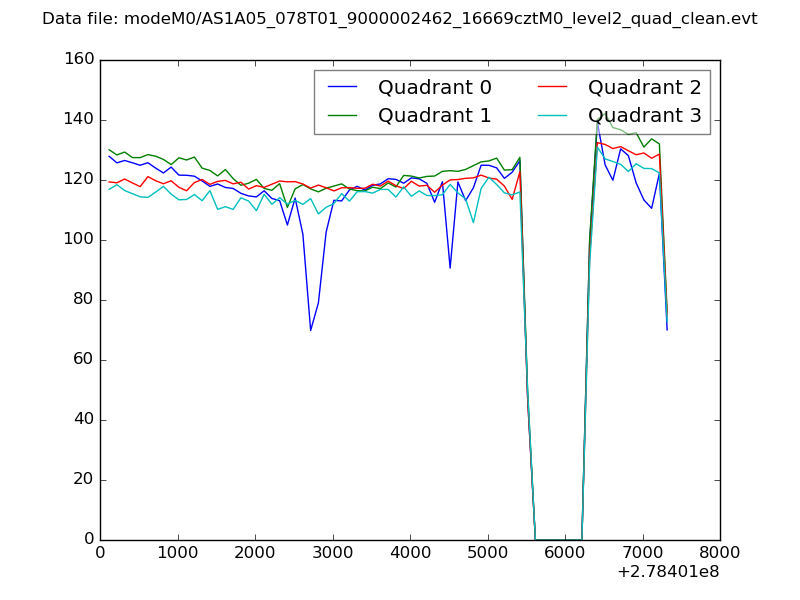 |
|
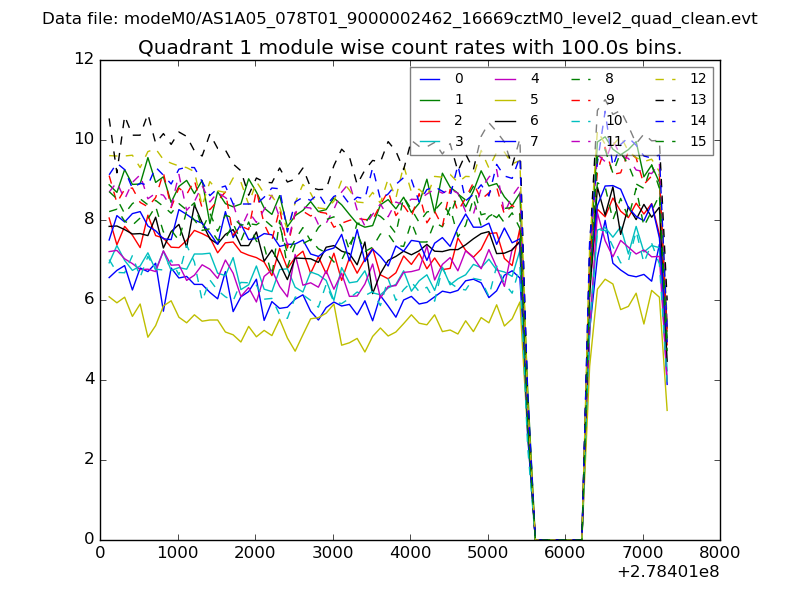
| Module-wise count rates for Quadrant A Data is divided into 100 sec bins |
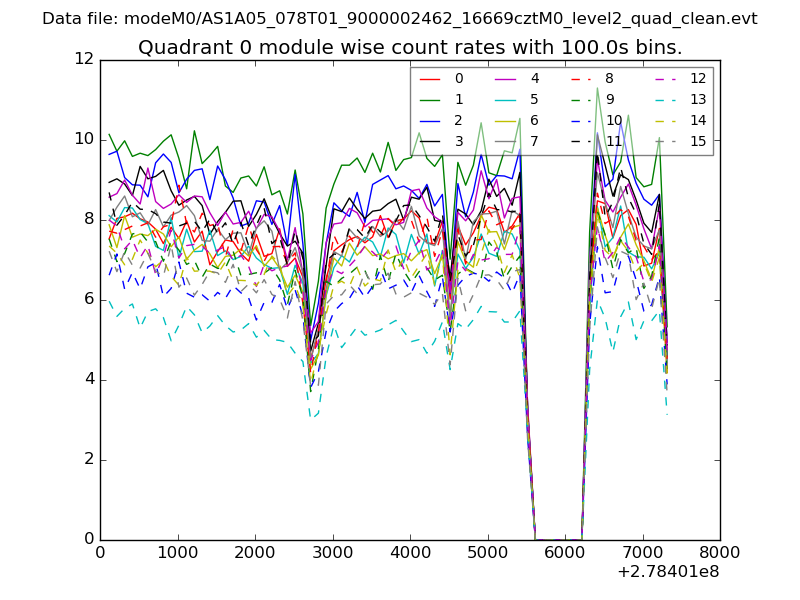 |
 |
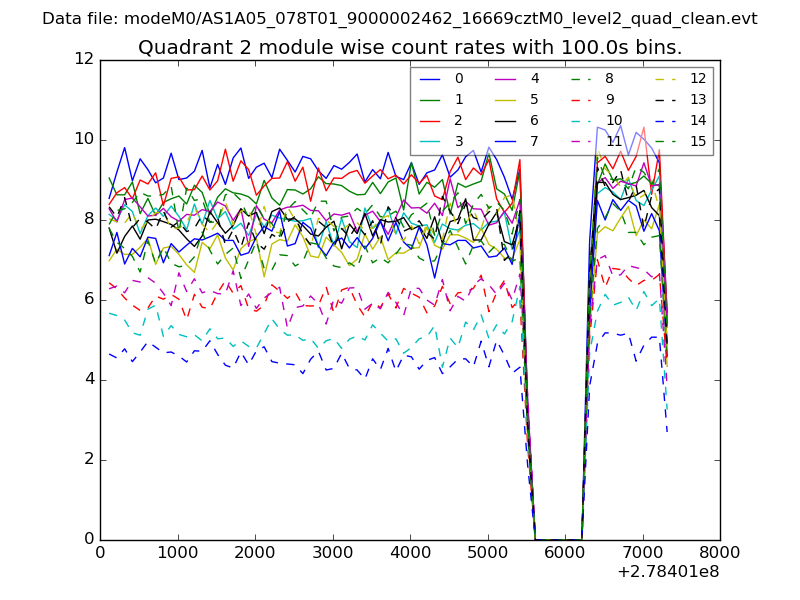
| Module-wise count rates for Quadrant B Data is divided into 100 sec bins |
 |
 |
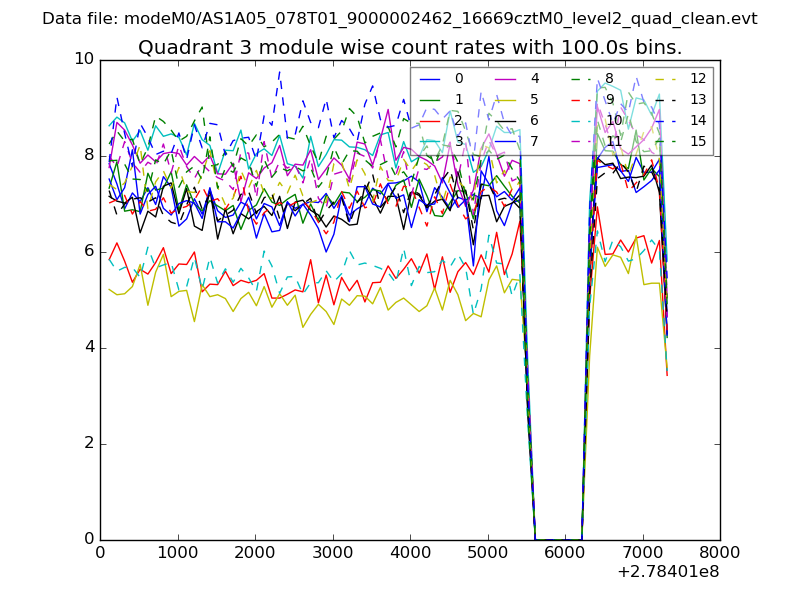
| Module-wise count rates for Quadrant C Data is divided into 100 sec bins |
 |
 |
| Module-wise count rates for Quadrant D Data is divided into 100 sec bins |
 |
 |
| Parameter | Plot |
|---|---|
| CZT HV Monitor | 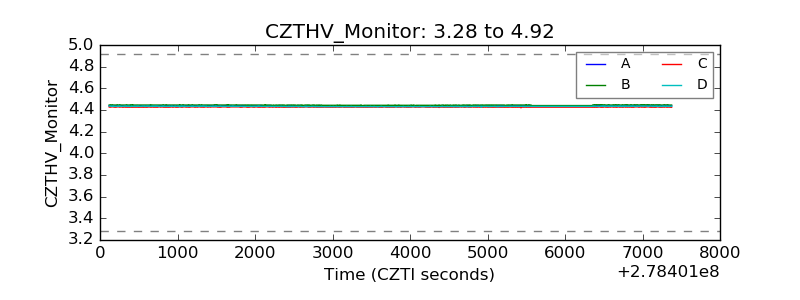 |
| D_VDD | 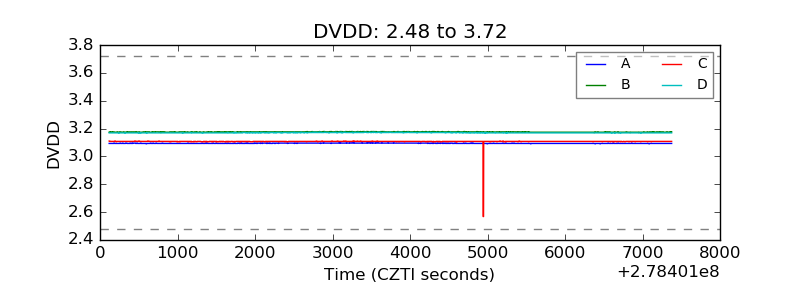 |
| Temperature 1 | 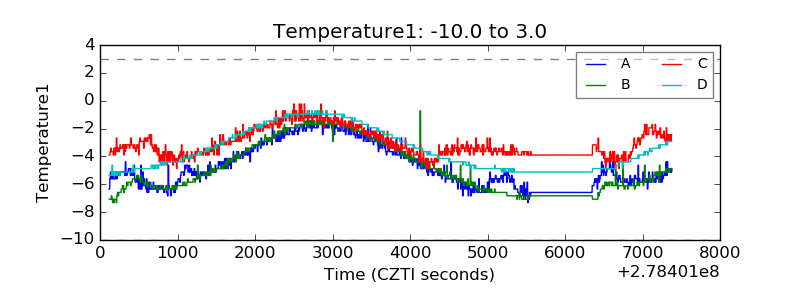 |
| Veto HV Monitor | 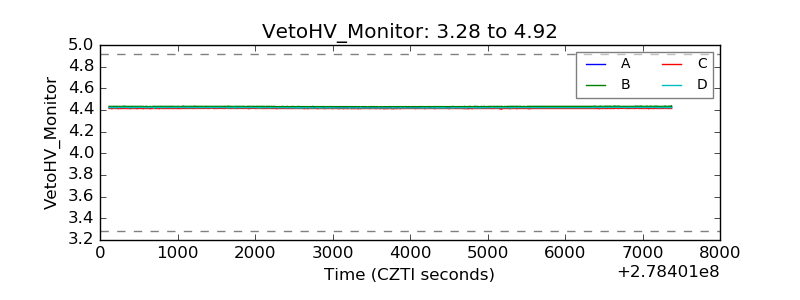 |
| Veto LLD | 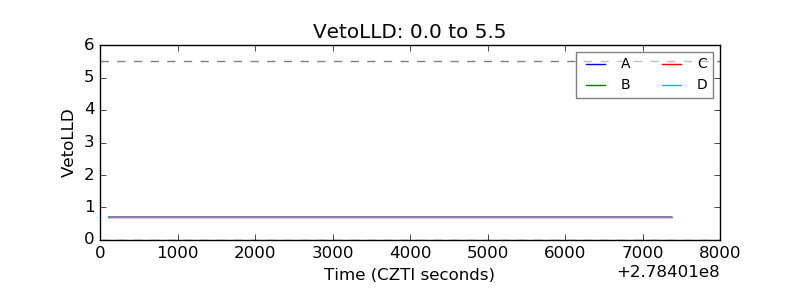 |
| Alpha Counter | 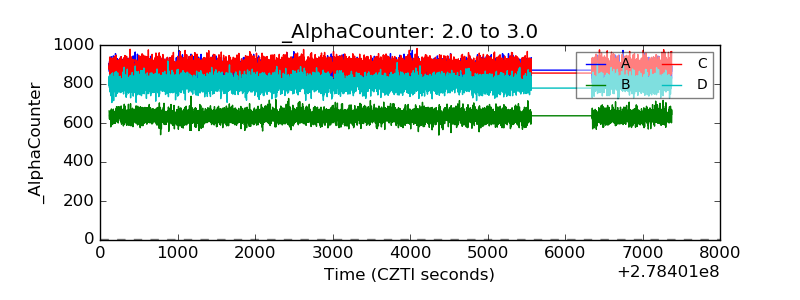 |
| _CPM_Rate | 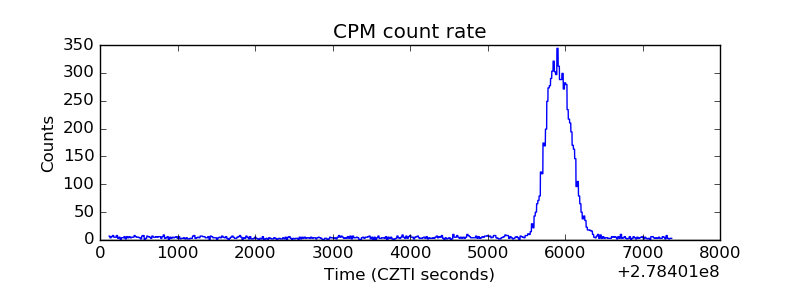 |
| CZT Counter | 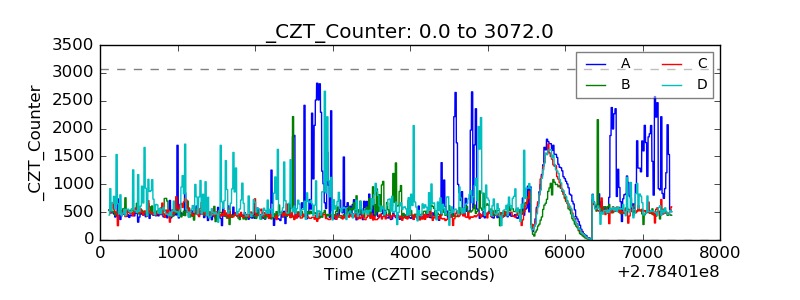 |
| +2.5 Volts monitor |  |
| +5 Volts monitor |  |
| _ROLL_ROT | 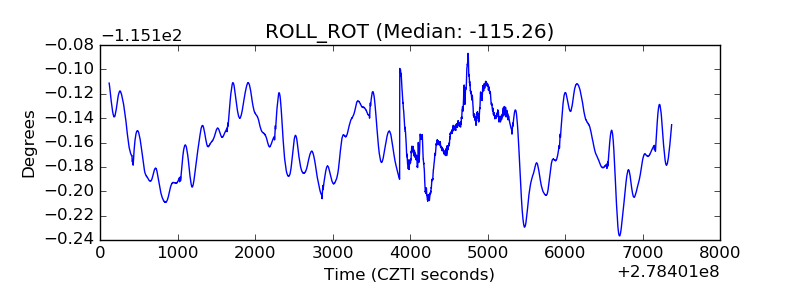 |
| _Roll_DEC | 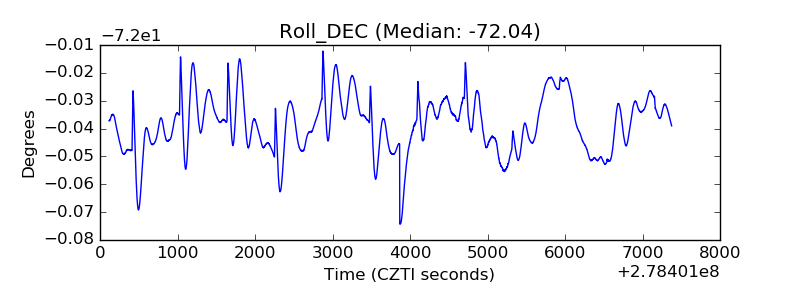 |
| _Roll_RA | 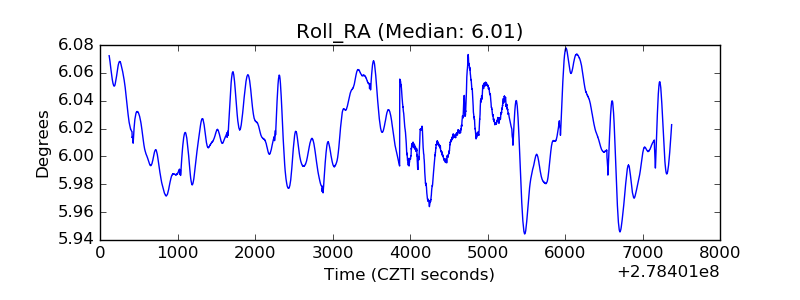 |
| Veto Counter | 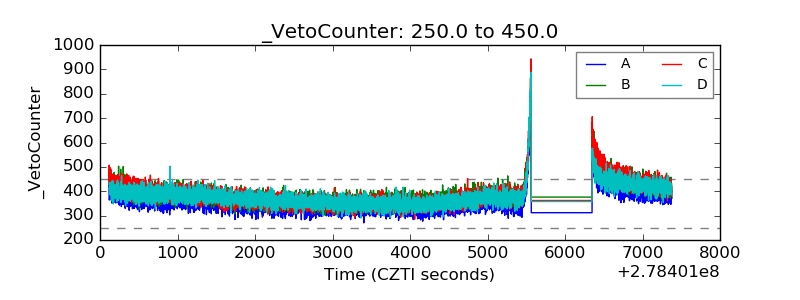 |