| Param | Original file | Final file |
|---|---|---|
| Filename | modeM0/AS1A05_078T01_9000002462_16671cztM0_level2.evt | modeM0/AS1A05_078T01_9000002462_16671cztM0_level2_quad_clean.evt |
| Size (bytes) | 999,048,960 | 219,035,520 |
| Size | 952.8 MB | 208.9 MB |
| Events in quadrant A | 7,745,199 | 1,454,797 |
| Events in quadrant B | 6,197,338 | 1,516,510 |
| Events in quadrant C | 5,481,094 | 1,469,621 |
| Events in quadrant D | 10,049,732 | 1,391,116 |
| Mode M0 | |||
|---|---|---|---|
| Quadrant | BADHDUFLAG | Total packets | Discarded packets |
| A | 0 | 30830 | 3 |
| B | 0 | 25626 | 2 |
| C | 0 | 24100 | 2 |
| D | 0 | 37701 | 2 |
| Mode SS | |||
|---|---|---|---|
| Quadrant | BADHDUFLAG | Total packets | Discarded packets |
| A | 0 | 236 | 0 |
| B | 0 | 236 | 0 |
| C | 0 | 236 | 0 |
| D | 0 | 236 | 0 |
| Mode M9 | |||
|---|---|---|---|
| Quadrant | BADHDUFLAG | Total packets | Discarded packets |
| A | 0 | 21 | 0 |
| B | 0 | 21 | 0 |
| C | 0 | 21 | 0 |
| D | 0 | 21 | 0 |
| Quadrant | Total seconds | Saturated seconds | Saturation percentage |
|---|---|---|---|
| A | 11593 | 724 | 6.245148% |
| B | 11593 | 109 | 0.940223% |
| C | 11593 | 154 | 1.328388% |
| D | 11593 | 801 | 6.909342% |
Noise dominated data is calculated using 1-second bins in cleaned event files. If a bin has >2000 counts, and if more than 50% of those come from <1% of pixels, then it is considered to be noise-dominated and hence unusable.
| Quadrant | # 1 sec bins | Bins with >0 counts | Bins with >2000 counts | High rate bins dominated by noise | Noise dominated (total time) | Noise dominated (detector-on time) | Marked lightcurve |
|---|---|---|---|---|---|---|---|
| A | 13669 | 11596 | 516 | 516 | 3.77% | 4.45% |  |
| B | 13669 | 11595 | 6 | 6 | 0.04% | 0.05% |  |
| C | 13669 | 11596 | 0 | 0 | 0.00% | 0.00% |  |
| D | 13669 | 11596 | 649 | 649 | 4.75% | 5.60% | 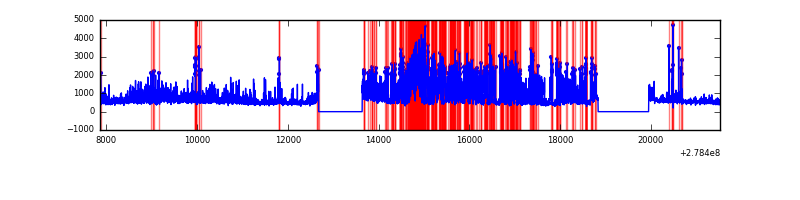 |
Top three noisy pixels from each quadrant. If the there are fewer than three noisy pixels in the level2.evt file, extra rows are filled as -1
| Pixel properties | Quadrant properties | ||||||
|---|---|---|---|---|---|---|---|
| Quadrant | DetID | PixID | Counts | Sigma | Mean | Median | Sigma |
| A | 15 | 174 | 2217344 | 8116.09 | 1362 | 1331 | 273.0 |
| A | 9 | 143 | 283014 | 1031.65 | 1362 | 1331 | 273.0 |
| A | 0 | 226 | 12075 | 39.35 | 1362 | 1331 | 273.0 |
| B | 15 | 35 | 267000 | 1028.51 | 1384 | 1348 | 258.3 |
| B | 0 | 229 | 227338 | 874.95 | 1384 | 1348 | 258.3 |
| B | 0 | 189 | 147284 | 565.01 | 1384 | 1348 | 258.3 |
| C | 14 | 238 | 208056 | 677.38 | 1329 | 1337 | 305.2 |
| C | 3 | 233 | 89025 | 287.33 | 1329 | 1337 | 305.2 |
| C | 13 | 61 | 9626 | 27.16 | 1329 | 1337 | 305.2 |
| D | 1 | 52 | 4146255 | 12894.92 | 1327 | 1287 | 321.4 |
| D | 10 | 199 | 549510 | 1705.51 | 1327 | 1287 | 321.4 |
| D | 10 | 70 | 190181 | 587.65 | 1327 | 1287 | 321.4 |
Histogram calculated using DETX and DETY for each event in the final _common_clean file
| Quadrant A |  |
 |
Quadrant B |
|---|---|---|---|
| Quadrant D |  |
 |
Quadrant C |
| Plot type | Count rate plots | Images |
|---|---|---|
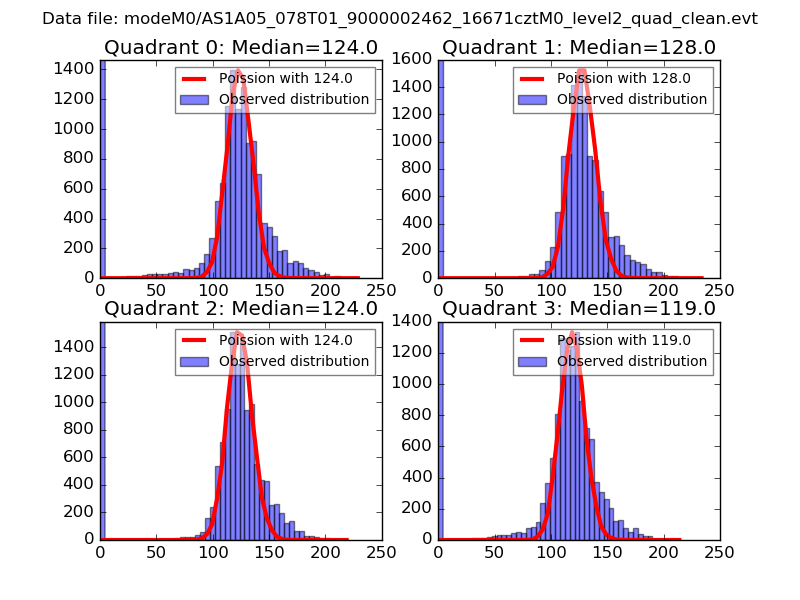
| Comparison with Poisson distribution Blue bars denote a histogram of data divided into 1 sec bins. Red curve is a Poisson curve with rate = median count rate of data. |
 |
 |
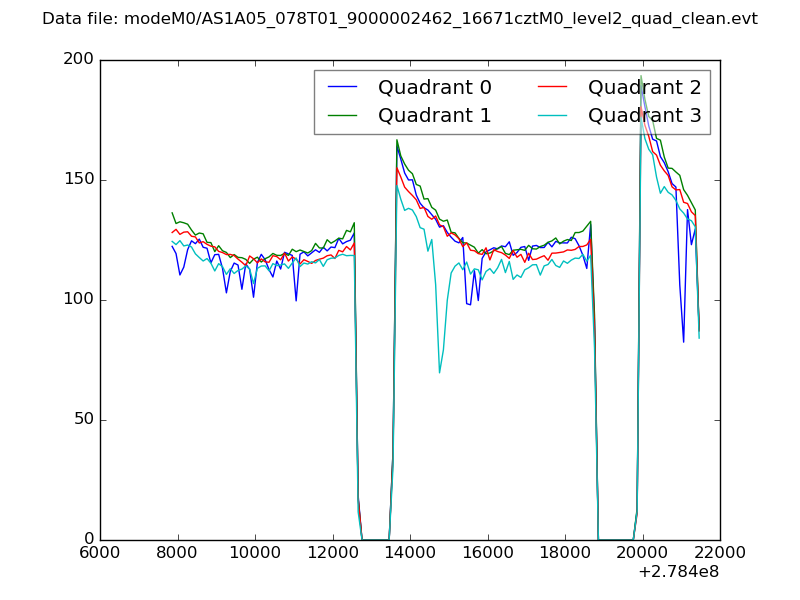
| Quadrant-wise count rates Data is divided into 100 sec bins |
 |
|
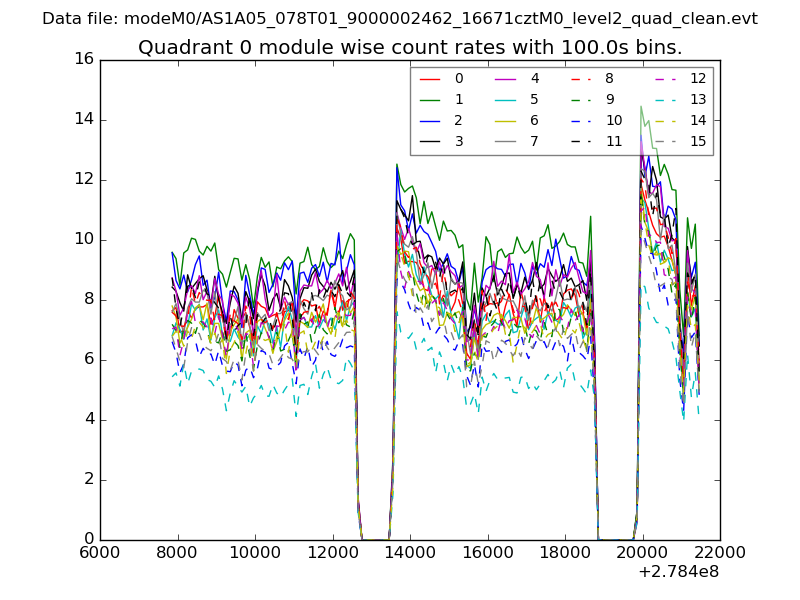
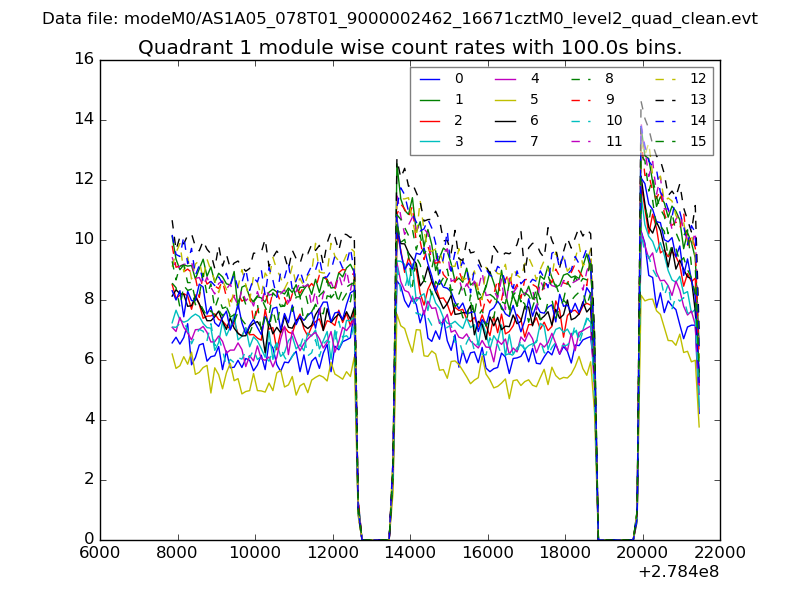
| Module-wise count rates for Quadrant A Data is divided into 100 sec bins |
 |
 |
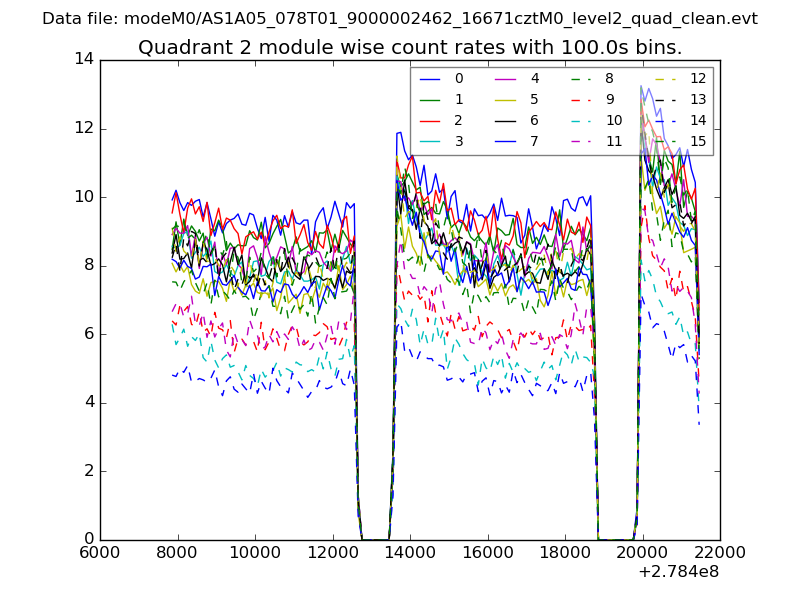
| Module-wise count rates for Quadrant B Data is divided into 100 sec bins |
 |
 |
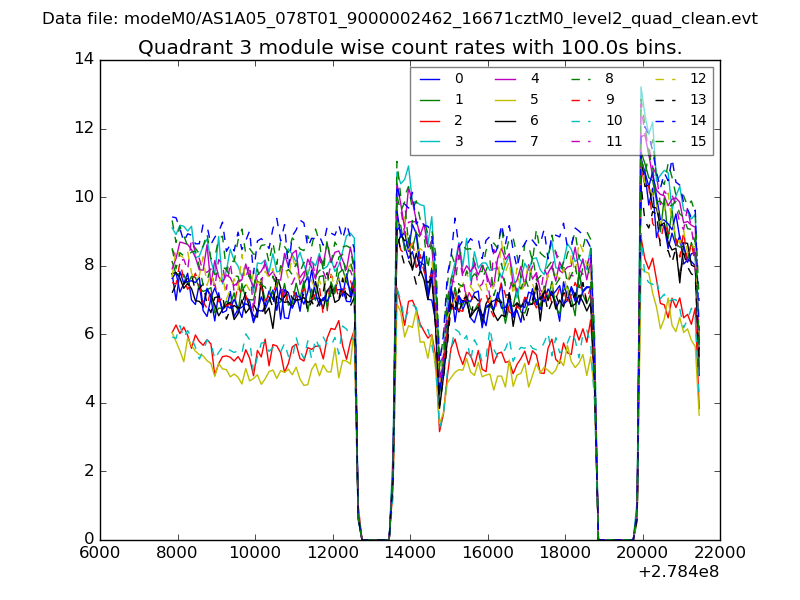
| Module-wise count rates for Quadrant C Data is divided into 100 sec bins |
 |
 |
| Module-wise count rates for Quadrant D Data is divided into 100 sec bins |
 |
 |
| Parameter | Plot |
|---|---|
| CZT HV Monitor | 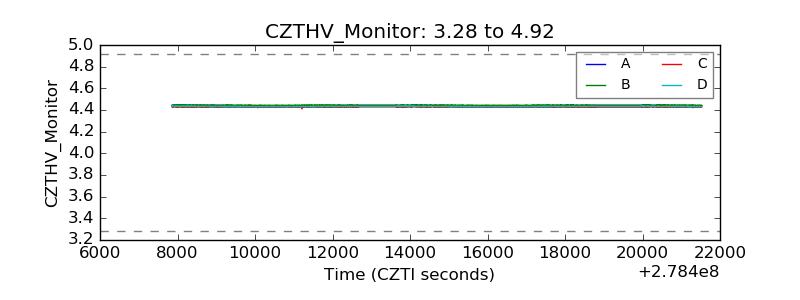 |
| D_VDD |  |
| Temperature 1 |  |
| Veto HV Monitor |  |
| Veto LLD |  |
| Alpha Counter | 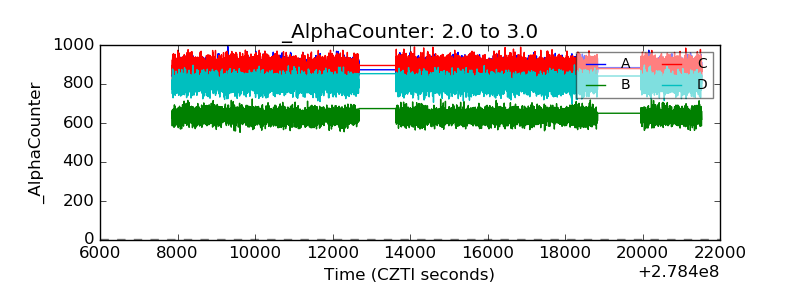 |
| _CPM_Rate | 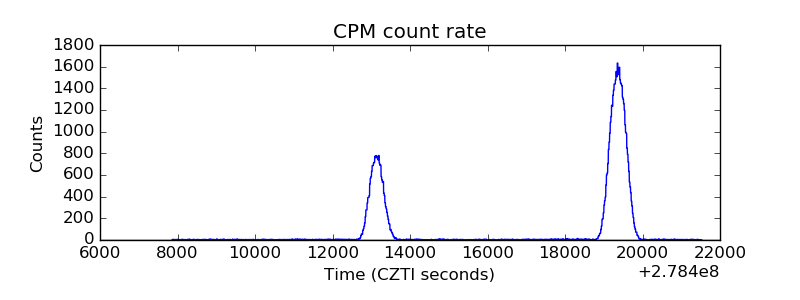 |
| CZT Counter |  |
| +2.5 Volts monitor |  |
| +5 Volts monitor |  |
| _ROLL_ROT | 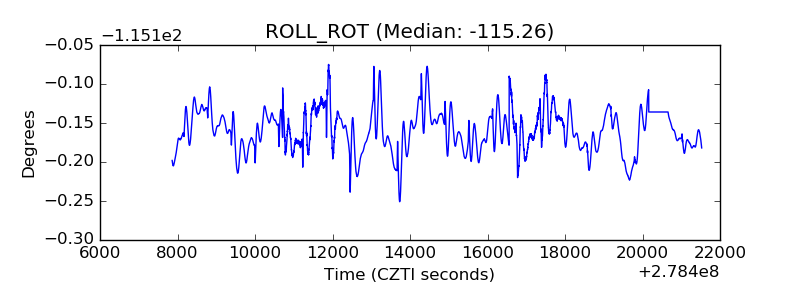 |
| _Roll_DEC |  |
| _Roll_RA |  |
| Veto Counter | 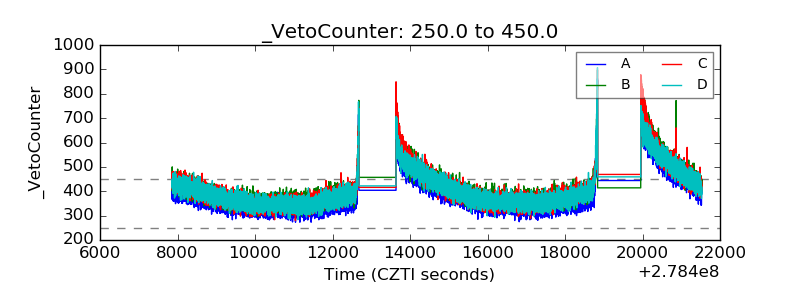 |