| Param | Original file | Final file |
|---|---|---|
| Filename | modeM0/AS1A05_078T01_9000002462_16672cztM0_level2.evt | modeM0/AS1A05_078T01_9000002462_16672cztM0_level2_quad_clean.evt |
| Size (bytes) | 464,973,120 | 122,304,960 |
| Size | 443.4 MB | 116.6 MB |
| Events in quadrant A | 3,633,907 | 825,480 |
| Events in quadrant B | 3,612,701 | 851,987 |
| Events in quadrant C | 3,074,201 | 814,667 |
| Events in quadrant D | 3,357,767 | 797,420 |
| Mode M0 | |||
|---|---|---|---|
| Quadrant | BADHDUFLAG | Total packets | Discarded packets |
| A | 0 | 14965 | 2 |
| B | 0 | 14586 | 1 |
| C | 0 | 13216 | 1 |
| D | 0 | 14031 | 1 |
| Mode SS | |||
|---|---|---|---|
| Quadrant | BADHDUFLAG | Total packets | Discarded packets |
| A | 0 | 120 | 0 |
| B | 0 | 120 | 0 |
| C | 0 | 120 | 0 |
| D | 0 | 120 | 0 |
| Mode M9 | |||
|---|---|---|---|
| Quadrant | BADHDUFLAG | Total packets | Discarded packets |
| A | 0 | 12 | 0 |
| B | 0 | 12 | 0 |
| C | 0 | 12 | 0 |
| D | 0 | 12 | 0 |
| Quadrant | Total seconds | Saturated seconds | Saturation percentage |
|---|---|---|---|
| A | 5937 | 317 | 5.339397% |
| B | 5937 | 128 | 2.155971% |
| C | 5937 | 81 | 1.364325% |
| D | 5937 | 120 | 2.021223% |
Noise dominated data is calculated using 1-second bins in cleaned event files. If a bin has >2000 counts, and if more than 50% of those come from <1% of pixels, then it is considered to be noise-dominated and hence unusable.
| Quadrant | # 1 sec bins | Bins with >0 counts | Bins with >2000 counts | High rate bins dominated by noise | Noise dominated (total time) | Noise dominated (detector-on time) | Marked lightcurve |
|---|---|---|---|---|---|---|---|
| A | 7143 | 5939 | 195 | 195 | 2.73% | 3.28% | 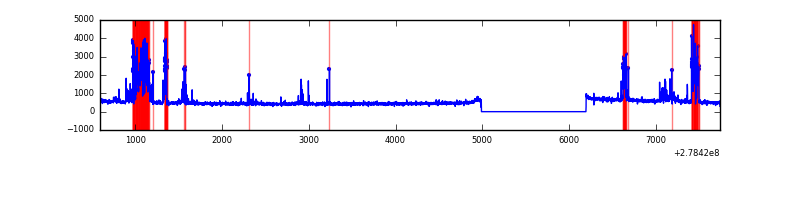 |
| B | 7143 | 5939 | 54 | 54 | 0.76% | 0.91% | 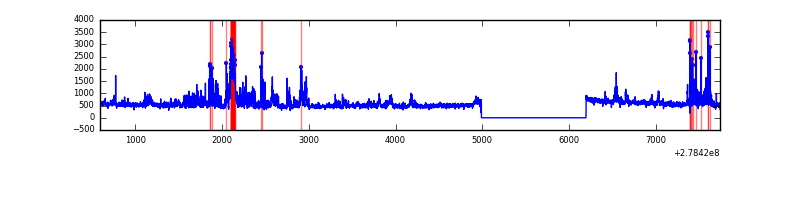 |
| C | 7143 | 5939 | 0 | 0 | 0.00% | 0.00% | 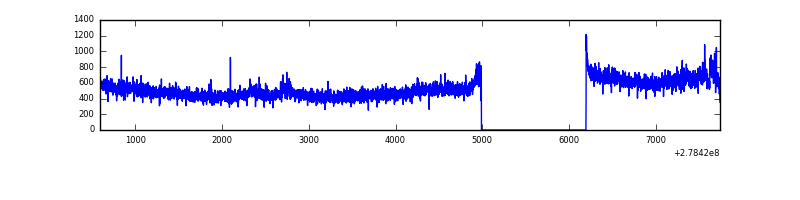 |
| D | 7143 | 5939 | 40 | 40 | 0.56% | 0.67% | 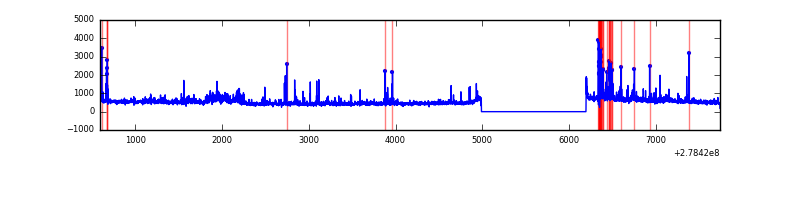 |
Top three noisy pixels from each quadrant. If the there are fewer than three noisy pixels in the level2.evt file, extra rows are filled as -1
| Pixel properties | Quadrant properties | ||||||
|---|---|---|---|---|---|---|---|
| Quadrant | DetID | PixID | Counts | Sigma | Mean | Median | Sigma |
| A | 15 | 174 | 739653 | 5055.15 | 734 | 722 | 146.2 |
| A | 9 | 143 | 53859 | 363.52 | 734 | 722 | 146.2 |
| A | 3 | 1 | 7475 | 46.2 | 734 | 722 | 146.2 |
| B | 5 | 172 | 165994 | 1210.23 | 744 | 729 | 136.6 |
| B | 15 | 35 | 163481 | 1191.83 | 744 | 729 | 136.6 |
| B | 7 | 220 | 136215 | 992.16 | 744 | 729 | 136.6 |
| C | 3 | 233 | 194465 | 1192.69 | 706 | 710 | 162.5 |
| C | 14 | 238 | 109727 | 671.07 | 706 | 710 | 162.5 |
| C | 5 | 237 | 13612 | 79.42 | 706 | 710 | 162.5 |
| D | 1 | 52 | 378586 | 2218.04 | 717 | 697 | 170.4 |
| D | 10 | 70 | 171678 | 1003.58 | 717 | 697 | 170.4 |
| D | 13 | 248 | 50101 | 289.98 | 717 | 697 | 170.4 |
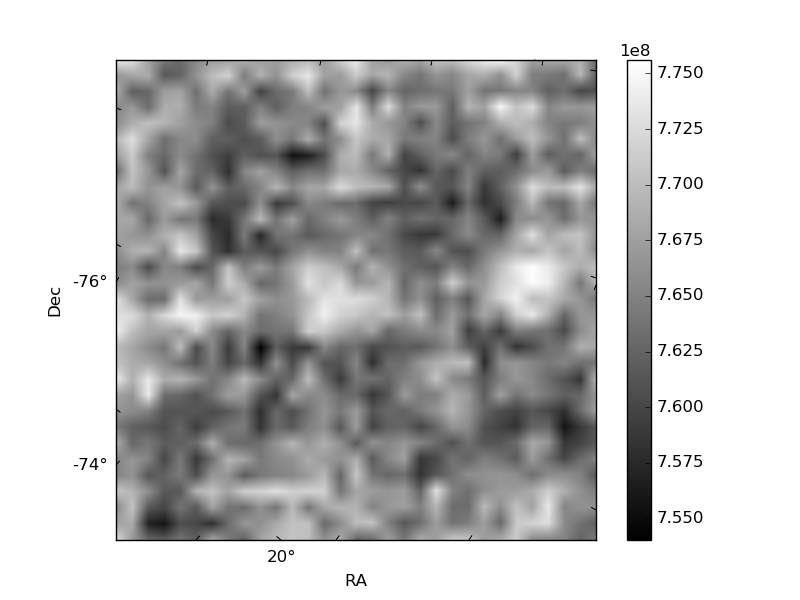
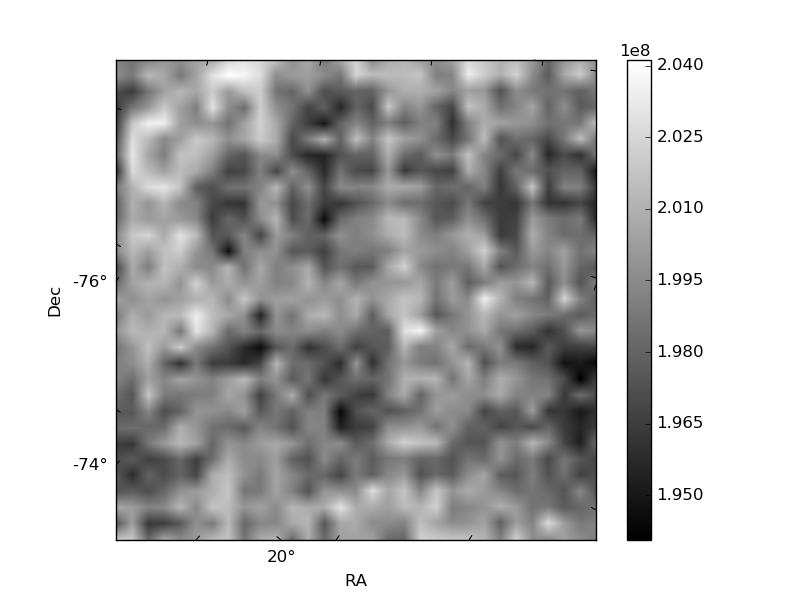
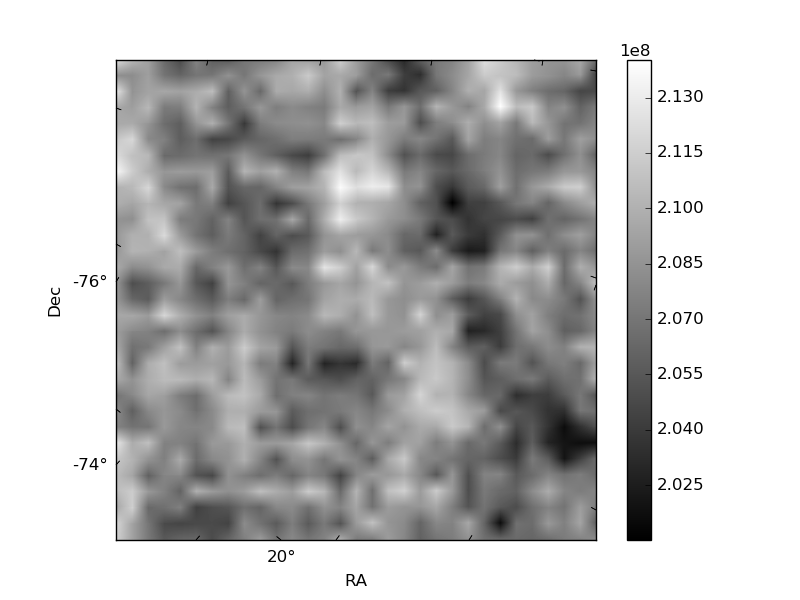
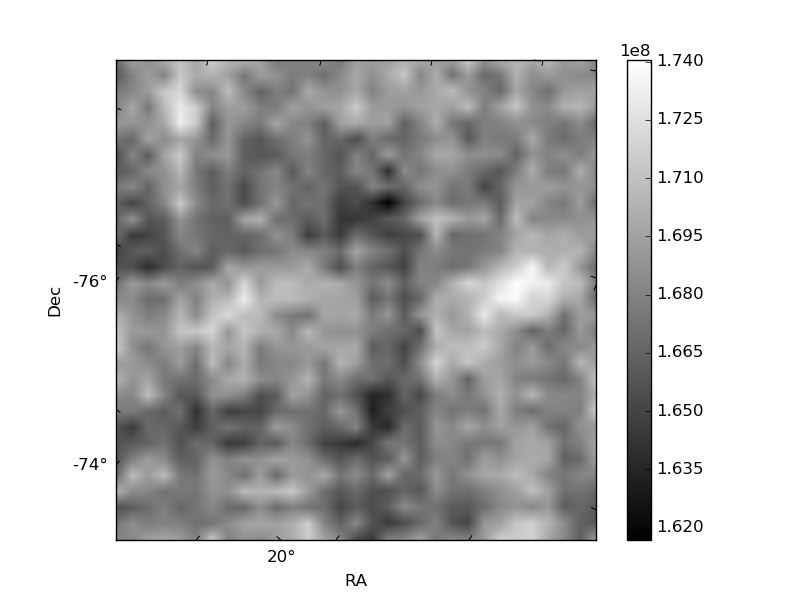
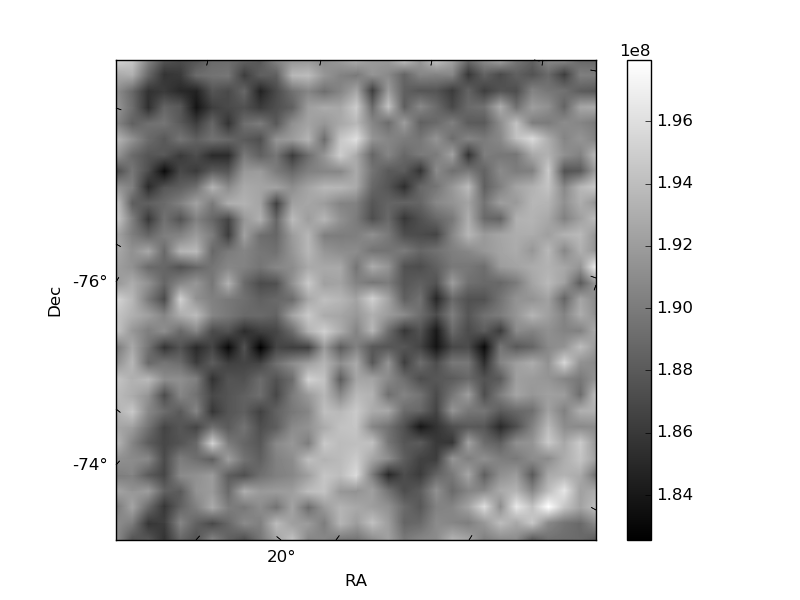
Histogram calculated using DETX and DETY for each event in the final _common_clean file
| Quadrant A | 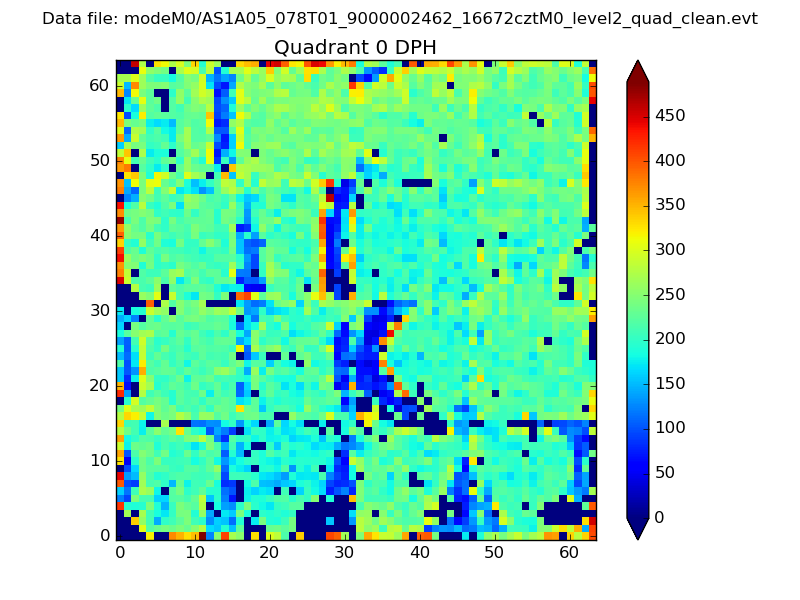 |
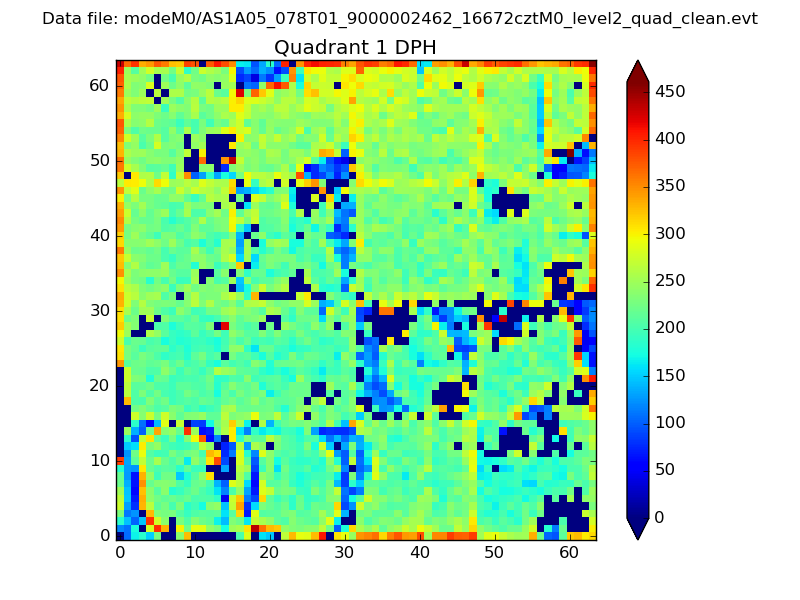 |
Quadrant B |
|---|---|---|---|
| Quadrant D | 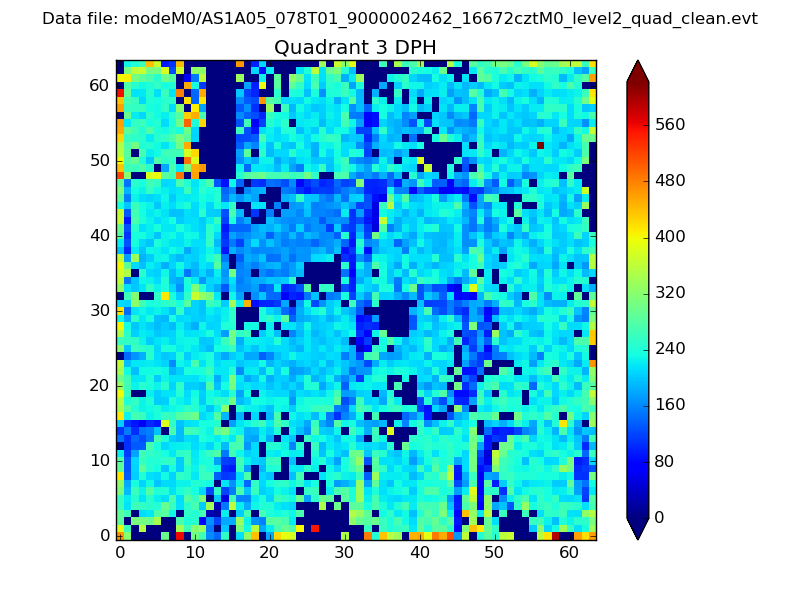 |
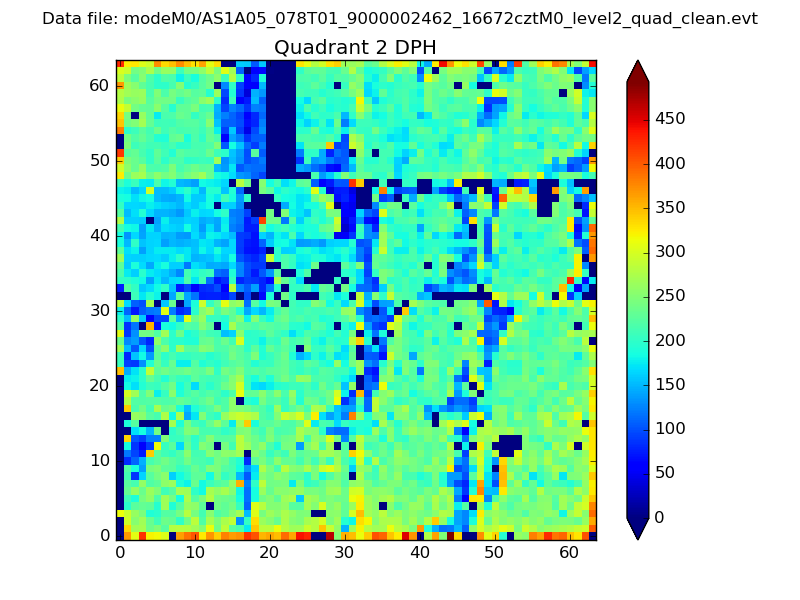 |
Quadrant C |
| Plot type | Count rate plots | Images |
|---|---|---|
| Comparison with Poisson distribution Blue bars denote a histogram of data divided into 1 sec bins. Red curve is a Poisson curve with rate = median count rate of data. |
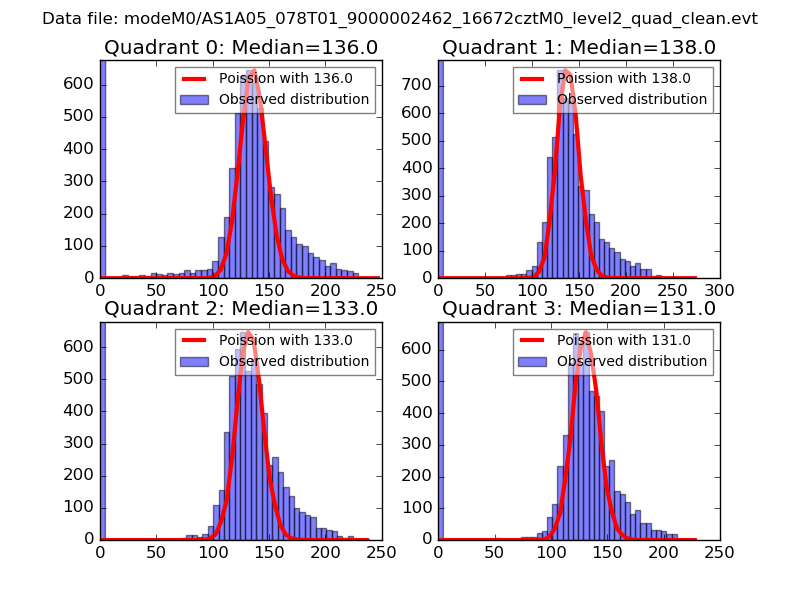 |
 |
| Quadrant-wise count rates Data is divided into 100 sec bins |
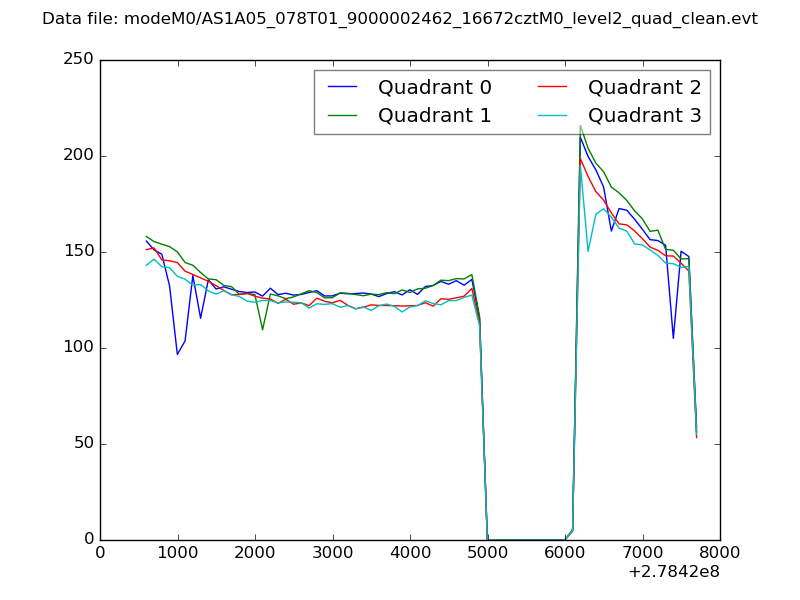 |
|
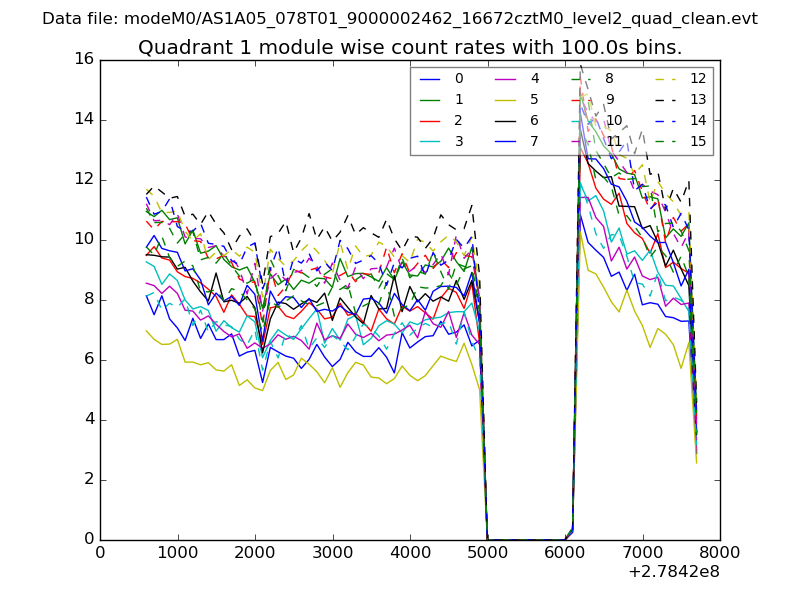
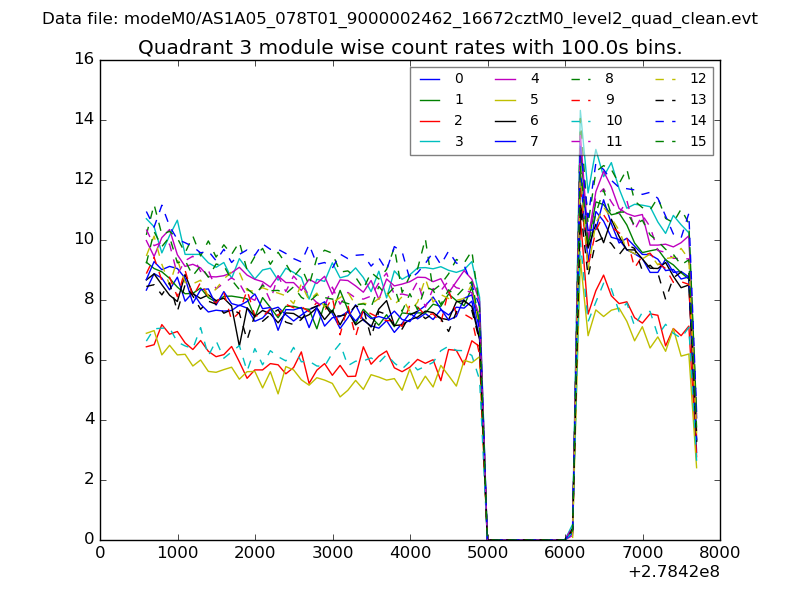
| Module-wise count rates for Quadrant A Data is divided into 100 sec bins |
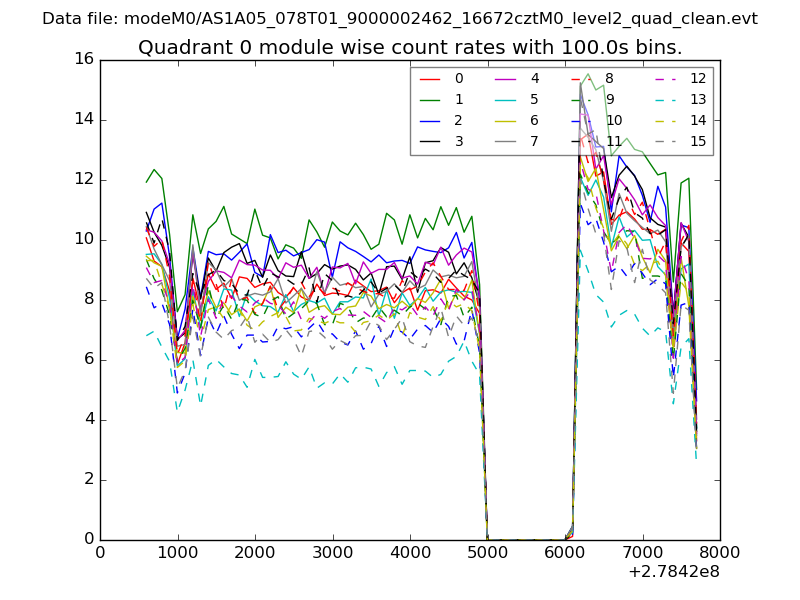 |
 |
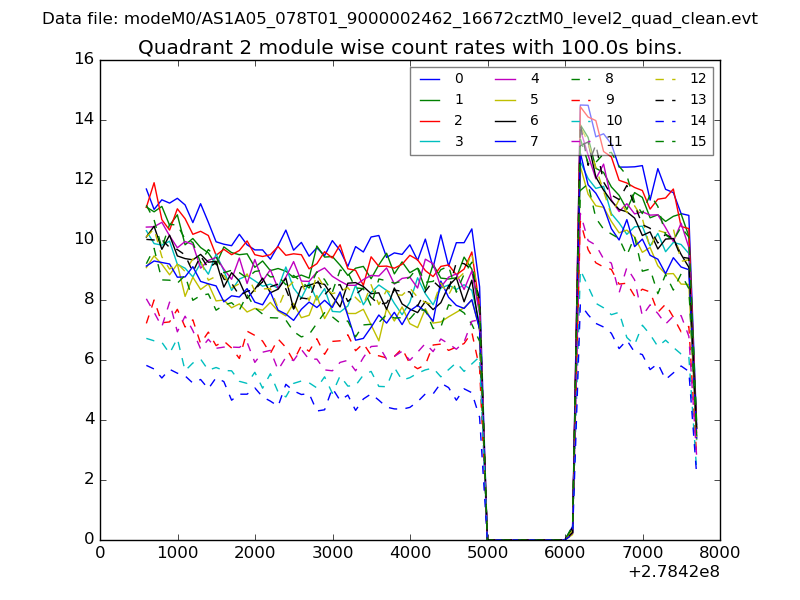
| Module-wise count rates for Quadrant B Data is divided into 100 sec bins |
 |
 |
| Module-wise count rates for Quadrant C Data is divided into 100 sec bins |
 |
 |
| Module-wise count rates for Quadrant D Data is divided into 100 sec bins |
 |
 |
| Parameter | Plot |
|---|---|
| CZT HV Monitor |  |
| D_VDD | 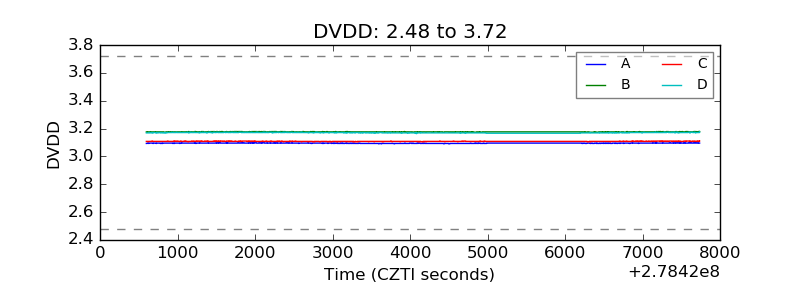 |
| Temperature 1 | 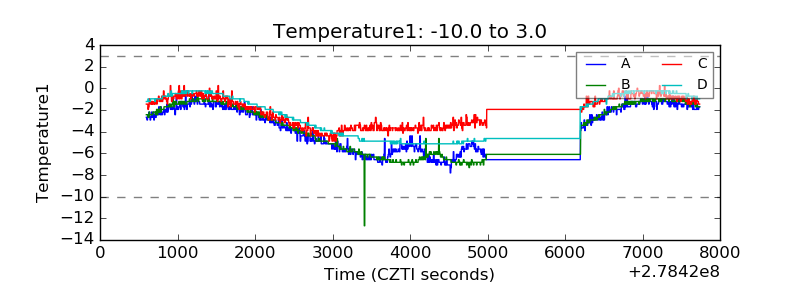 |
| Veto HV Monitor | 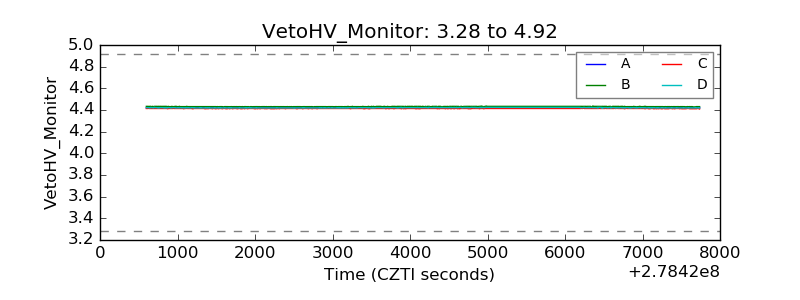 |
| Veto LLD | 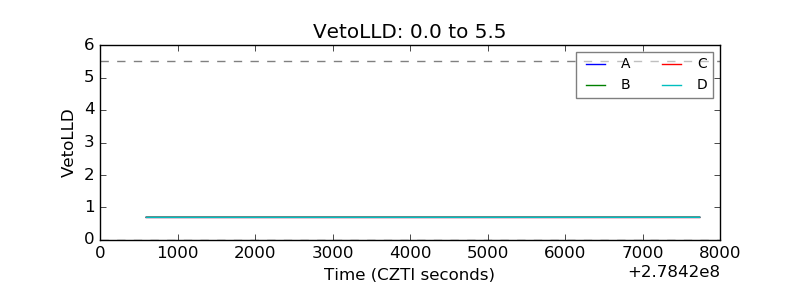 |
| Alpha Counter | 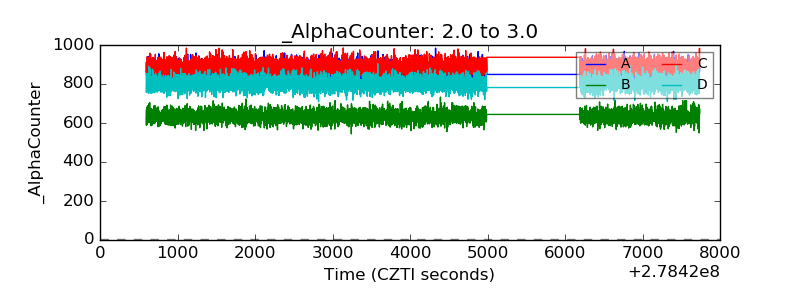 |
| _CPM_Rate | 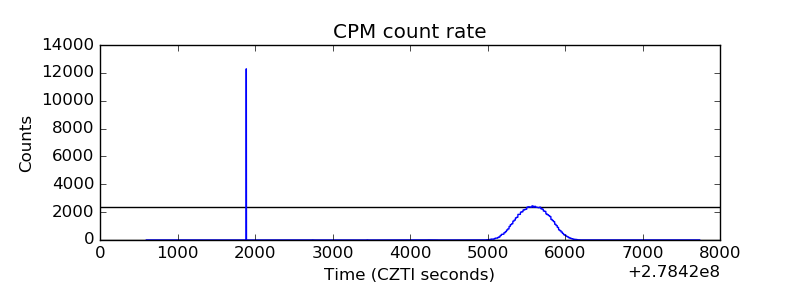 |
| CZT Counter | 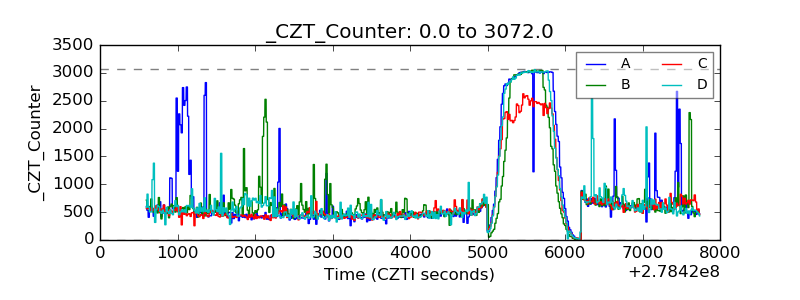 |
| +2.5 Volts monitor |  |
| +5 Volts monitor |  |
| _ROLL_ROT | 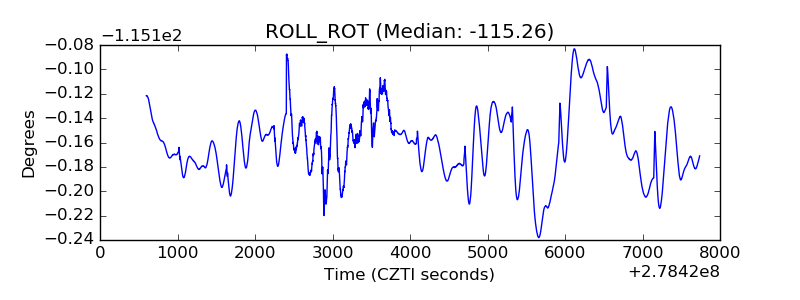 |
| _Roll_DEC | 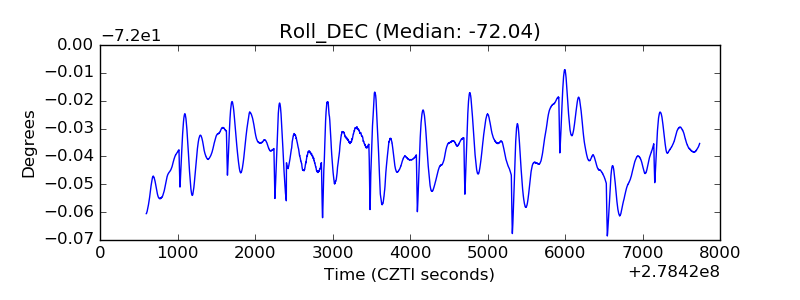 |
| _Roll_RA | 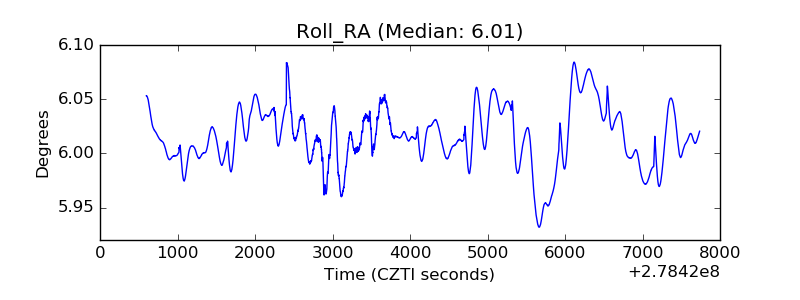 |
| Veto Counter | 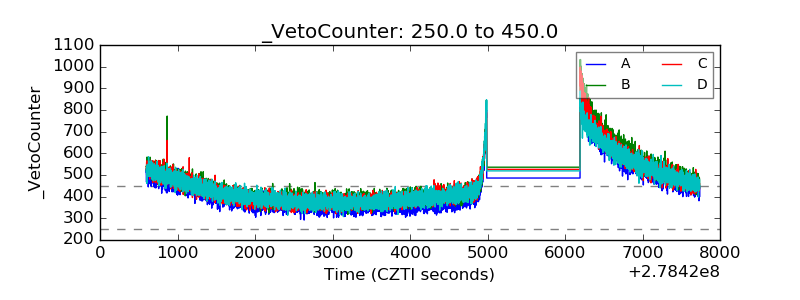 |