| Param | Original file | Final file |
|---|---|---|
| Filename | modeM0/AS1A05_078T01_9000002462_16673cztM0_level2.evt | modeM0/AS1A05_078T01_9000002462_16673cztM0_level2_quad_clean.evt |
| Size (bytes) | 497,485,440 | 125,536,320 |
| Size | 474.4 MB | 119.7 MB |
| Events in quadrant A | 3,295,069 | 873,930 |
| Events in quadrant B | 3,456,702 | 887,065 |
| Events in quadrant C | 3,649,732 | 835,000 |
| Events in quadrant D | 4,265,235 | 794,514 |
| Mode M0 | |||
|---|---|---|---|
| Quadrant | BADHDUFLAG | Total packets | Discarded packets |
| A | 0 | 13823 | 2 |
| B | 0 | 14081 | 1 |
| C | 0 | 14829 | 1 |
| D | 0 | 16644 | 1 |
| Mode SS | |||
|---|---|---|---|
| Quadrant | BADHDUFLAG | Total packets | Discarded packets |
| A | 0 | 120 | 0 |
| B | 0 | 120 | 0 |
| C | 0 | 120 | 0 |
| D | 0 | 120 | 0 |
| Mode M9 | |||
|---|---|---|---|
| Quadrant | BADHDUFLAG | Total packets | Discarded packets |
| A | 0 | 13 | 0 |
| B | 0 | 13 | 0 |
| C | 0 | 13 | 0 |
| D | 0 | 13 | 0 |
| Quadrant | Total seconds | Saturated seconds | Saturation percentage |
|---|---|---|---|
| A | 5890 | 134 | 2.275042% |
| B | 5890 | 103 | 1.748727% |
| C | 5890 | 109 | 1.850594% |
| D | 5890 | 491 | 8.336163% |
Noise dominated data is calculated using 1-second bins in cleaned event files. If a bin has >2000 counts, and if more than 50% of those come from <1% of pixels, then it is considered to be noise-dominated and hence unusable.
| Quadrant | # 1 sec bins | Bins with >0 counts | Bins with >2000 counts | High rate bins dominated by noise | Noise dominated (total time) | Noise dominated (detector-on time) | Marked lightcurve |
|---|---|---|---|---|---|---|---|
| A | 7176 | 5892 | 51 | 51 | 0.71% | 0.87% | 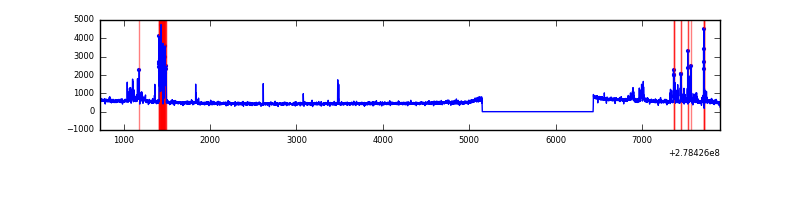 |
| B | 7176 | 5892 | 22 | 22 | 0.31% | 0.37% | 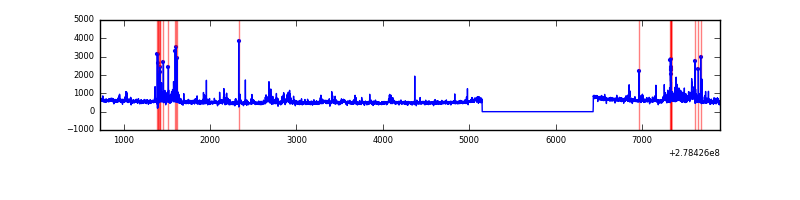 |
| C | 7176 | 5892 | 1 | 1 | 0.01% | 0.02% | 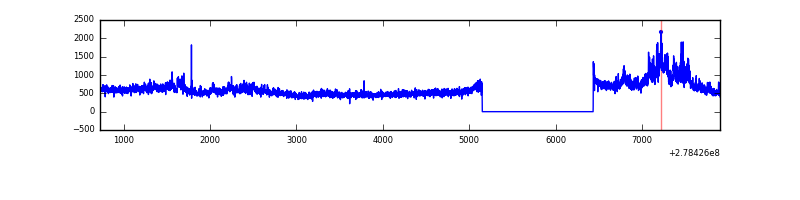 |
| D | 7176 | 5892 | 363 | 363 | 5.06% | 6.16% | 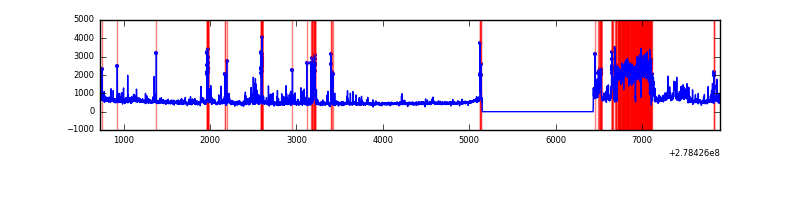 |
Top three noisy pixels from each quadrant. If the there are fewer than three noisy pixels in the level2.evt file, extra rows are filled as -1
| Pixel properties | Quadrant properties | ||||||
|---|---|---|---|---|---|---|---|
| Quadrant | DetID | PixID | Counts | Sigma | Mean | Median | Sigma |
| A | 15 | 174 | 300663 | 1984.08 | 758 | 746 | 151.2 |
| A | 9 | 143 | 63200 | 413.16 | 758 | 746 | 151.2 |
| A | 12 | 96 | 8338 | 50.22 | 758 | 746 | 151.2 |
| B | 7 | 220 | 174330 | 1248.9 | 758 | 743 | 139.0 |
| B | 15 | 35 | 127529 | 912.18 | 758 | 743 | 139.0 |
| B | 0 | 229 | 103071 | 736.22 | 758 | 743 | 139.0 |
| C | 3 | 233 | 725766 | 4444.35 | 713 | 718 | 163.1 |
| C | 14 | 238 | 113121 | 689.0 | 713 | 718 | 163.1 |
| C | 5 | 237 | 24355 | 144.89 | 713 | 718 | 163.1 |
| D | 2 | 16 | 971484 | 5744.59 | 707 | 687 | 169.0 |
| D | 1 | 52 | 280771 | 1657.37 | 707 | 687 | 169.0 |
| D | 15 | 0 | 121090 | 712.47 | 707 | 687 | 169.0 |
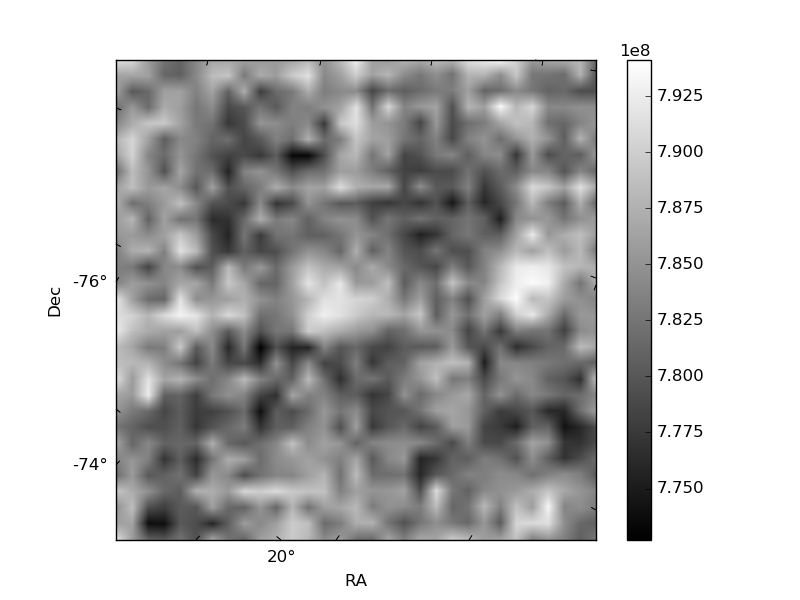
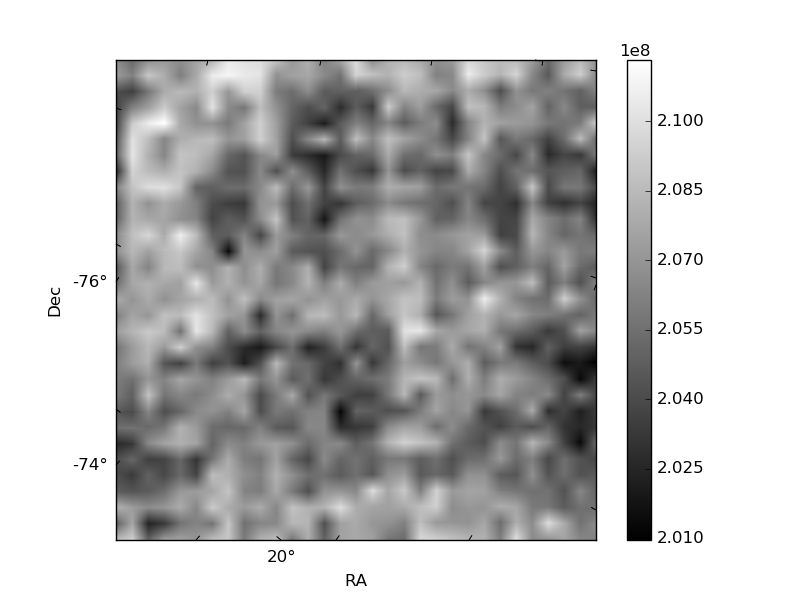
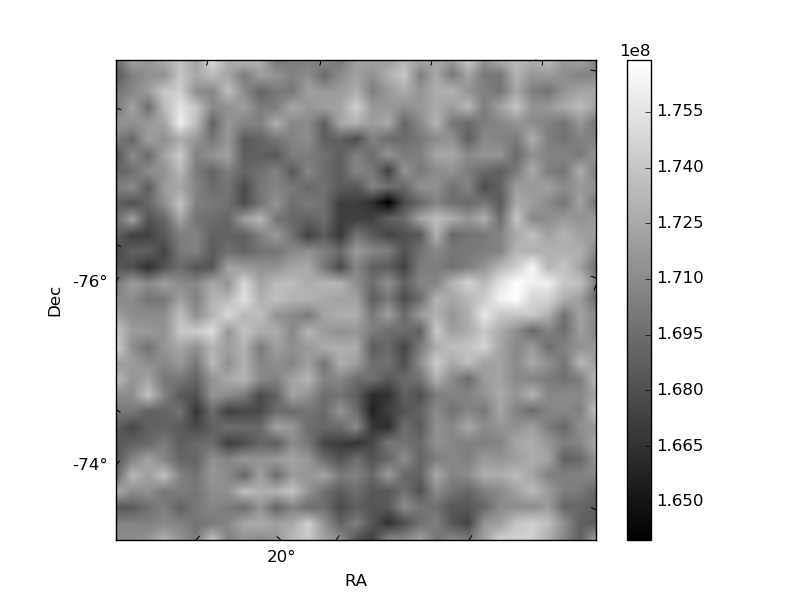
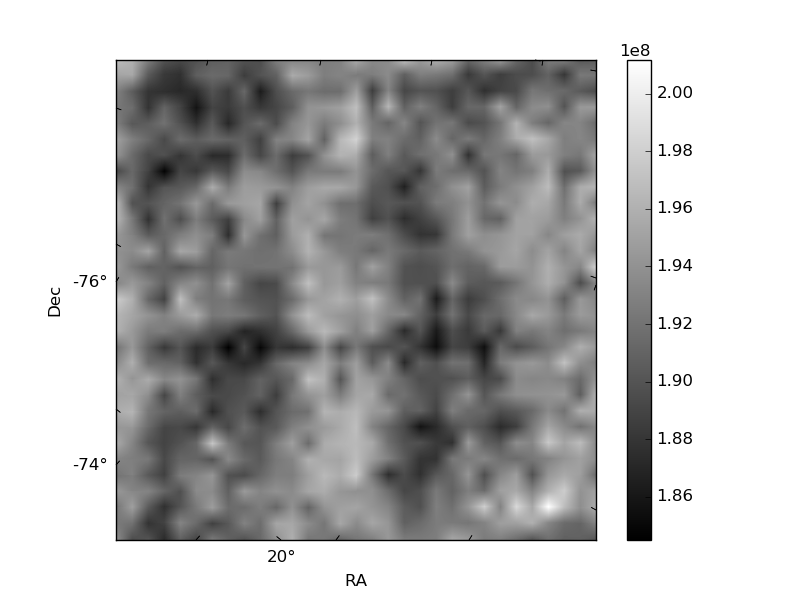
Histogram calculated using DETX and DETY for each event in the final _common_clean file
| Quadrant A | 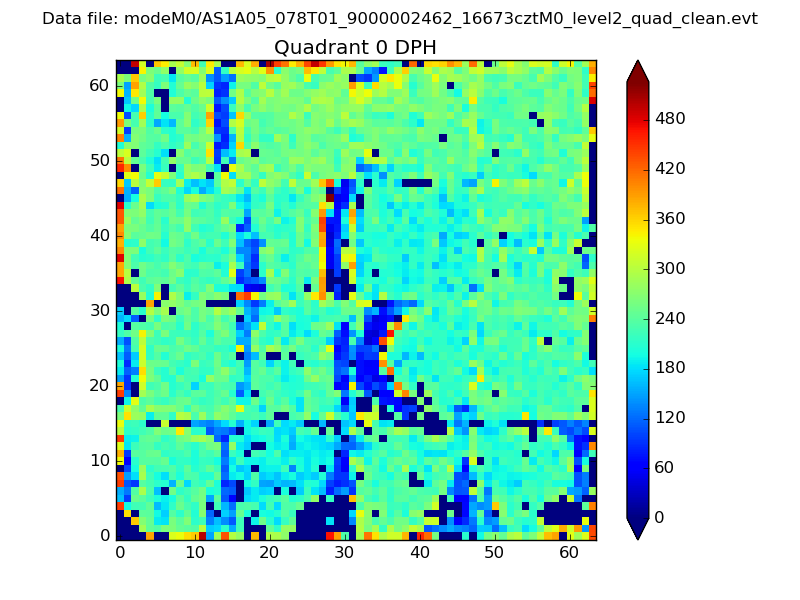 |
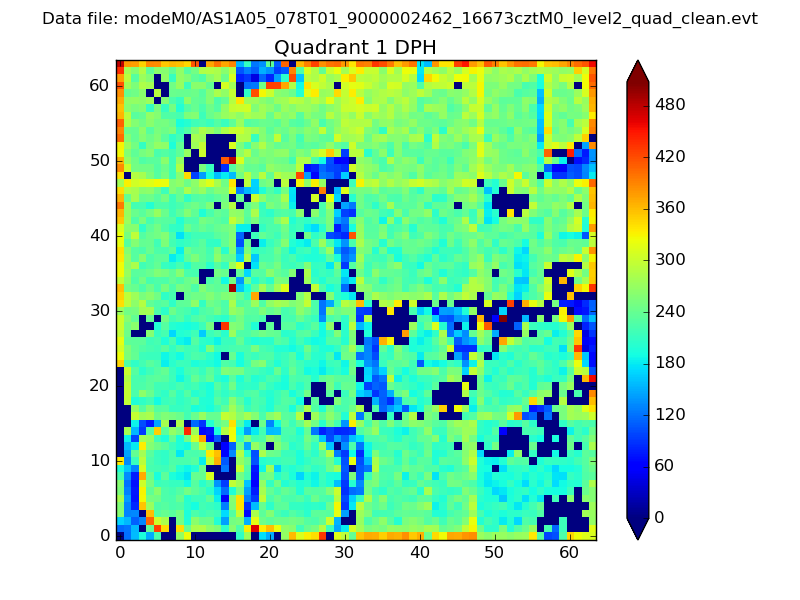 |
Quadrant B |
|---|---|---|---|
| Quadrant D | 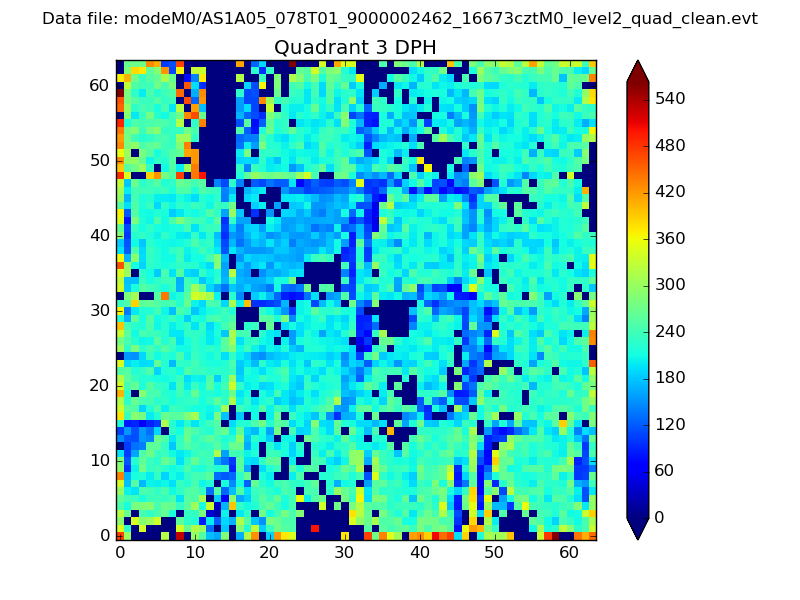 |
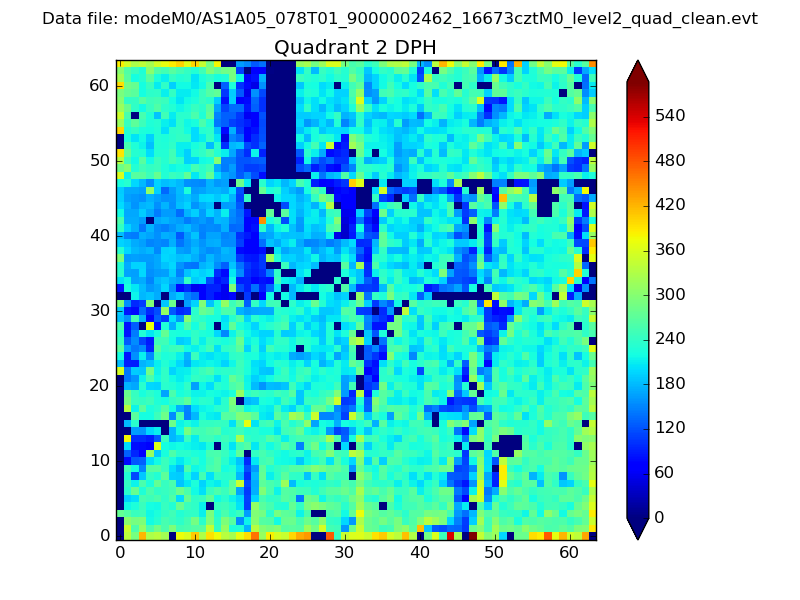 |
Quadrant C |
| Plot type | Count rate plots | Images |
|---|---|---|
| Comparison with Poisson distribution Blue bars denote a histogram of data divided into 1 sec bins. Red curve is a Poisson curve with rate = median count rate of data. |
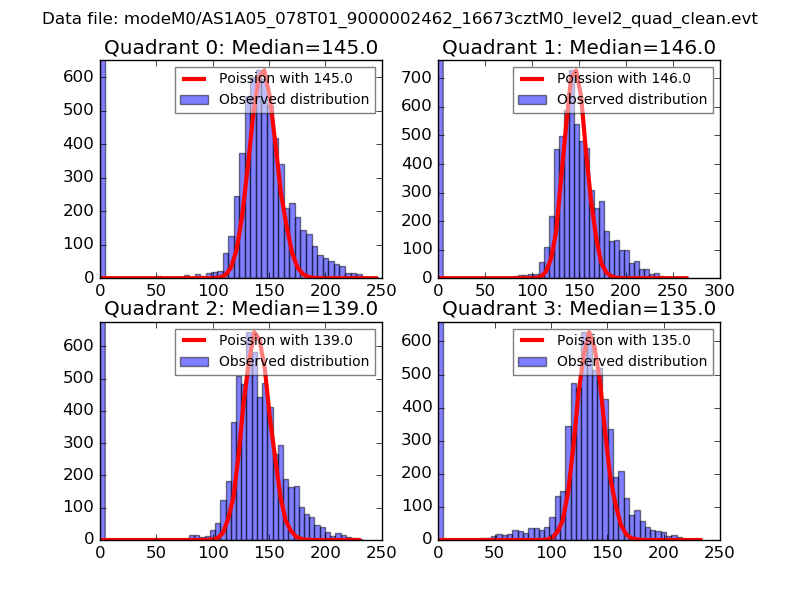 |
 |
| Quadrant-wise count rates Data is divided into 100 sec bins |
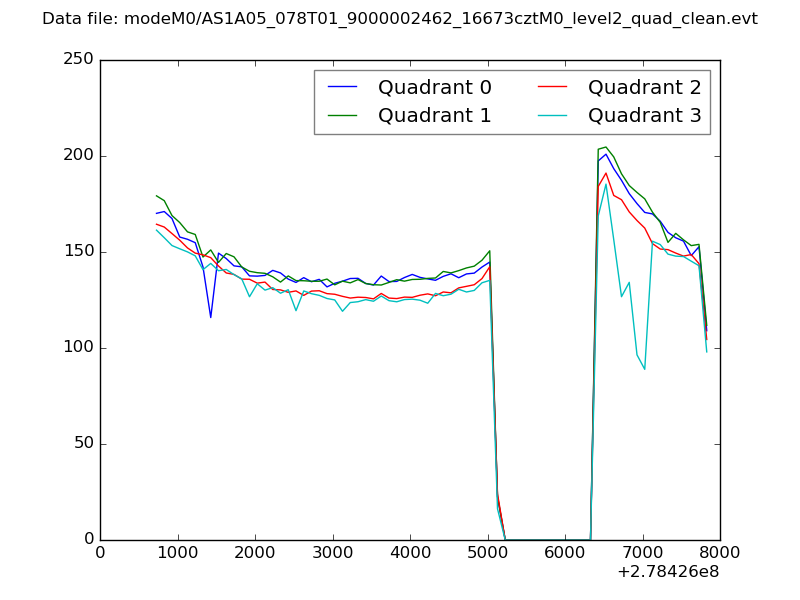 |
|
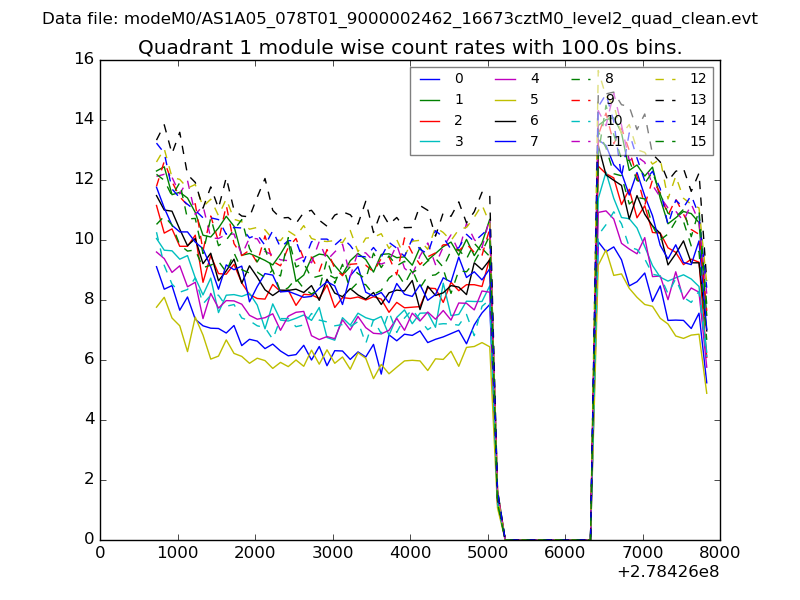
| Module-wise count rates for Quadrant A Data is divided into 100 sec bins |
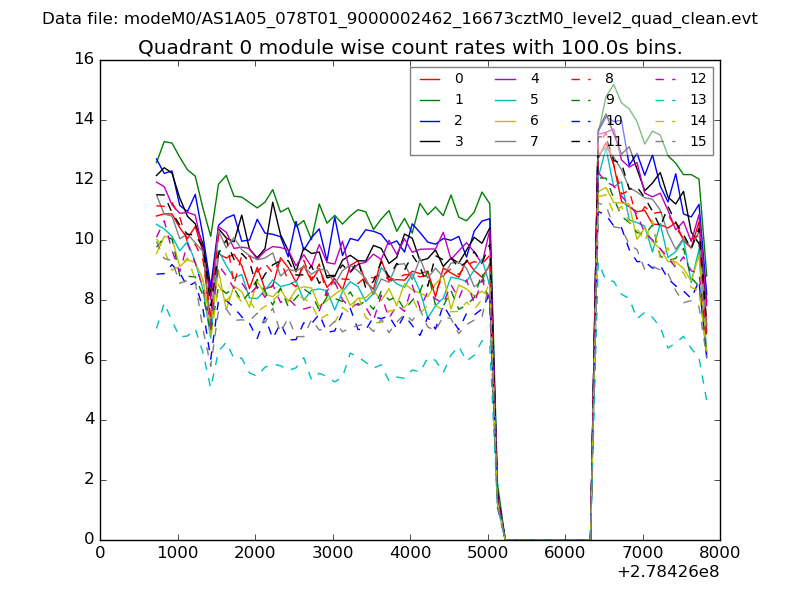 |
 |
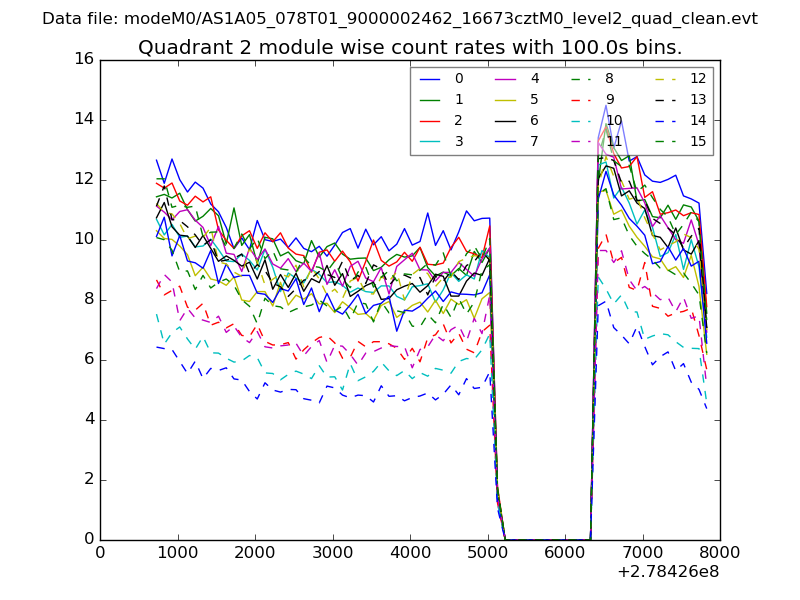
| Module-wise count rates for Quadrant B Data is divided into 100 sec bins |
 |
 |
| Module-wise count rates for Quadrant C Data is divided into 100 sec bins |
 |
 |
| Module-wise count rates for Quadrant D Data is divided into 100 sec bins |
 |
 |
| Parameter | Plot |
|---|---|
| CZT HV Monitor | 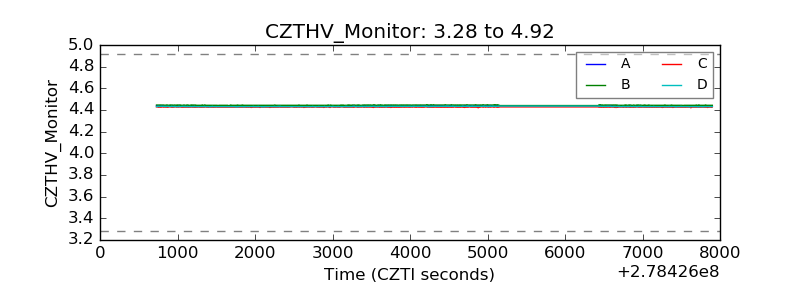 |
| D_VDD | 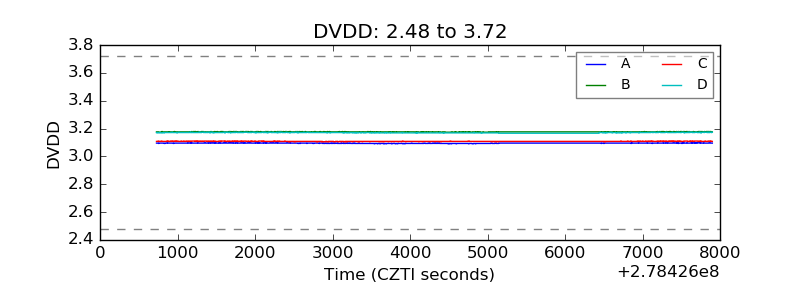 |
| Temperature 1 | 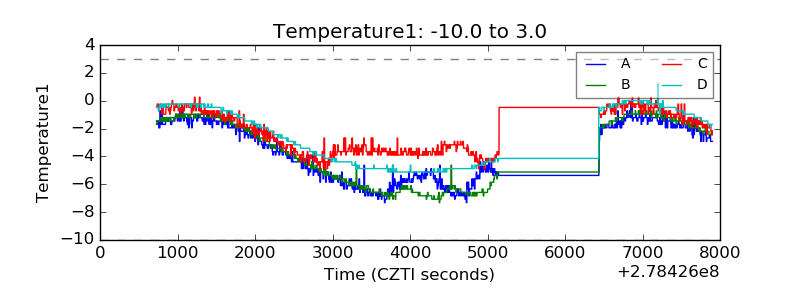 |
| Veto HV Monitor | 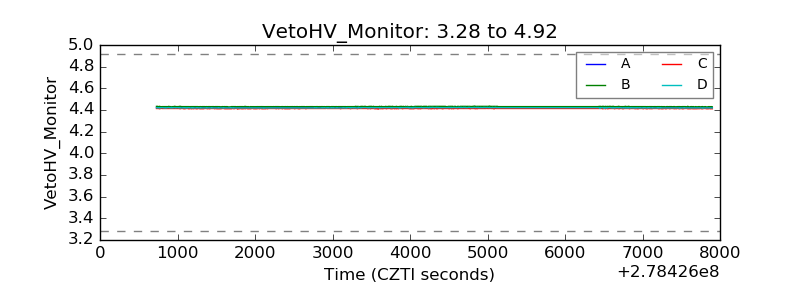 |
| Veto LLD | 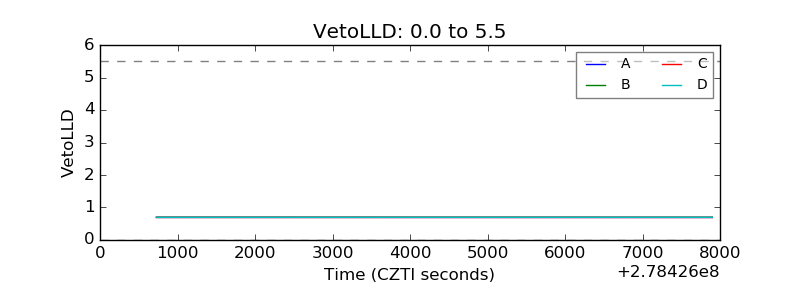 |
| Alpha Counter | 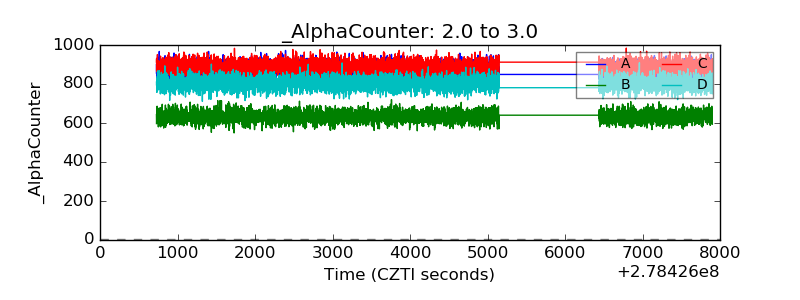 |
| _CPM_Rate | 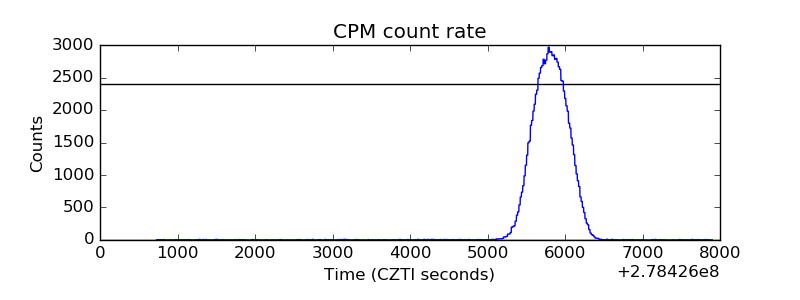 |
| CZT Counter | 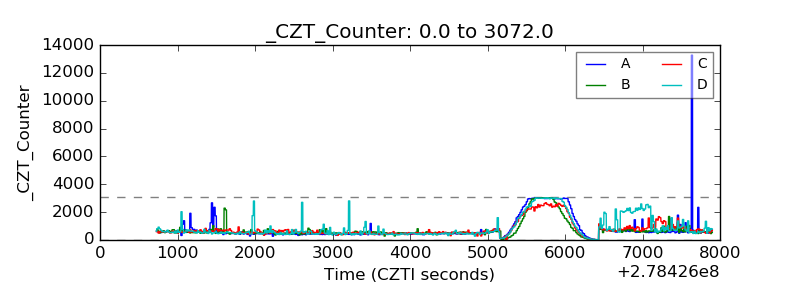 |
| +2.5 Volts monitor |  |
| +5 Volts monitor | 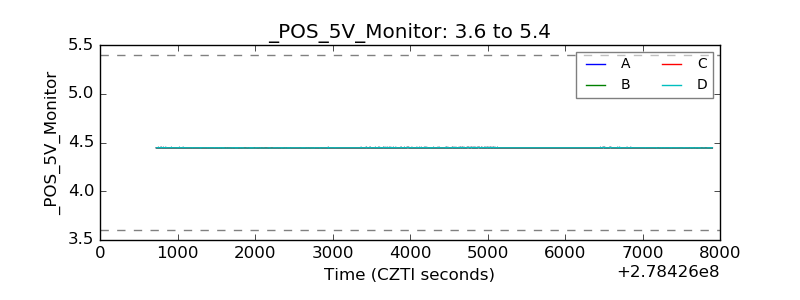 |
| _ROLL_ROT | 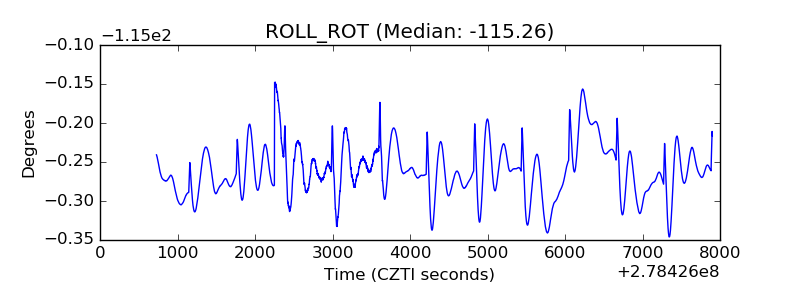 |
| _Roll_DEC | 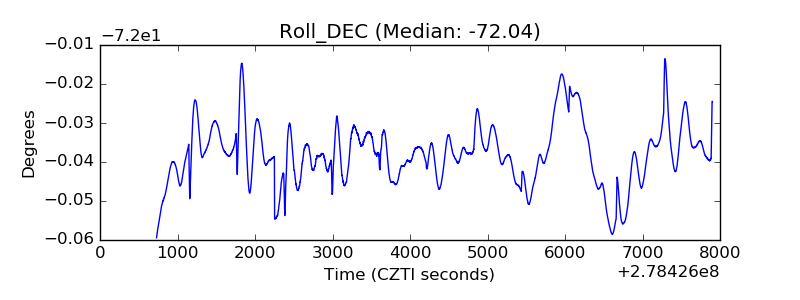 |
| _Roll_RA | 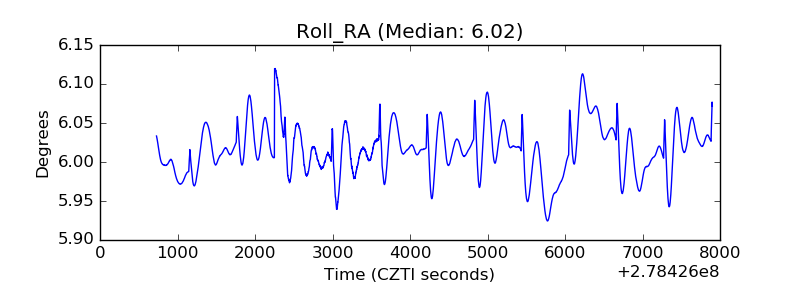 |
| Veto Counter | 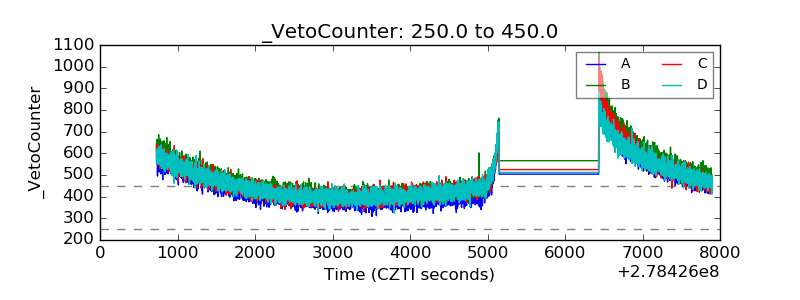 |