| Param | Original file | Final file |
|---|---|---|
| Filename | modeM0/AS1A05_101T09_9000002466cztM0_level2.fits | modeM0/AS1A05_101T09_9000002466cztM0_level2_quad_clean.evt |
| Size (bytes) | 179,323,200 | 256,366,080 |
| Size | 171.0 MB | 244.5 MB |
| Events in quadrant A | 1,067,276 | 1,632,904 |
| Events in quadrant B | 1,052,388 | 1,725,268 |
| Events in quadrant C | 1,067,188 | 1,638,577 |
| Events in quadrant D | 894,718 | 1,419,329 |
| Mode SS | |||
|---|---|---|---|
| Quadrant | BADHDUFLAG | Total packets | Discarded packets |
| A | 0 | 396 | 0 |
| B | 0 | 396 | 0 |
| C | 0 | 396 | 0 |
| D | 0 | 396 | 0 |
| Mode M9 | |||
|---|---|---|---|
| Quadrant | BADHDUFLAG | Total packets | Discarded packets |
| A | 0 | 15 | 0 |
| B | 0 | 15 | 0 |
| C | 0 | 15 | 0 |
| D | 0 | 15 | 0 |
| Mode M0 | |||
|---|---|---|---|
| Quadrant | BADHDUFLAG | Total packets | Discarded packets |
| A | 0 | 50811 | 0 |
| B | 0 | 42852 | 0 |
| C | 0 | 40019 | 0 |
| D | 0 | 69622 | 0 |
| Quadrant | Total seconds | Saturated seconds | Saturation percentage |
|---|---|---|---|
| A | 19578 | 1195 | 6.103790% |
| B | 19578 | 308 | 1.573194% |
| C | 19578 | 220 | 1.123710% |
| D | 19578 | 1560 | 7.968127% |
Noise dominated data is calculated using 1-second bins in cleaned event files. If a bin has >2000 counts, and if more than 50% of those come from <1% of pixels, then it is considered to be noise-dominated and hence unusable.
| Quadrant | # 1 sec bins | Bins with >0 counts | Bins with >2000 counts | High rate bins dominated by noise | Noise dominated (total time) | Noise dominated (detector-on time) | Marked lightcurve |
|---|---|---|---|---|---|---|---|
| A | 20993 | 19572 | 0 | 0 | 0.00% | 0.00% |  |
| B | 20993 | 19578 | 0 | 0 | 0.00% | 0.00% |  |
| C | 20993 | 19578 | 0 | 0 | 0.00% | 0.00% |  |
| D | 20993 | 19575 | 0 | 0 | 0.00% | 0.00% |  |
Top three noisy pixels from each quadrant. If the there are fewer than three noisy pixels in the level2.evt file, extra rows are filled as -1
| Pixel properties | Quadrant properties | ||||||
|---|---|---|---|---|---|---|---|
| Quadrant | DetID | PixID | Counts | Sigma | Mean | Median | Sigma |
| A | 0 | 29 | 1033 | 10.91 | 277 | 262 | 70.7 |
| A | 7 | 110 | 895 | 8.96 | 277 | 262 | 70.7 |
| A | 0 | 30 | 801 | 7.63 | 277 | 262 | 70.7 |
| B | 2 | 9 | 834 | 9.8 | 278 | 266 | 57.9 |
| B | 2 | 8 | 725 | 7.92 | 278 | 266 | 57.9 |
| B | 14 | 254 | 707 | 7.61 | 278 | 266 | 57.9 |
| C | 1 | 80 | 789 | 7.18 | 281 | 262 | 73.4 |
| C | 12 | 241 | 784 | 7.11 | 281 | 262 | 73.4 |
| C | 1 | 81 | 767 | 6.88 | 281 | 262 | 73.4 |
| D | 3 | 14 | 666 | 6.22 | 255 | 232 | 69.8 |
| D | 10 | 189 | 646 | 5.93 | 255 | 232 | 69.8 |
| D | 6 | 231 | 646 | 5.93 | 255 | 232 | 69.8 |
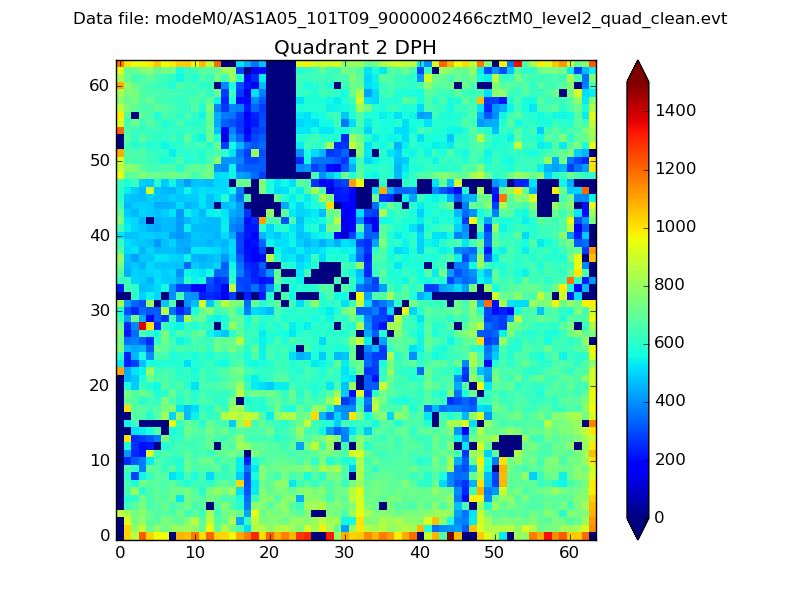
Histogram calculated using DETX and DETY for each event in the final _common_clean file
| Quadrant A |  |
 |
Quadrant B |
|---|---|---|---|
| Quadrant D |  |
 |
Quadrant C |
| Plot type | Count rate plots | Images |
|---|---|---|
| Comparison with Poisson distribution Blue bars denote a histogram of data divided into 1 sec bins. Red curve is a Poisson curve with rate = median count rate of data. |
 |
 |
| Quadrant-wise count rates Data is divided into 100 sec bins |
 |
|
| Module-wise count rates for Quadrant A Data is divided into 100 sec bins |
 |
 |
| Module-wise count rates for Quadrant B Data is divided into 100 sec bins |
 |
 |
| Module-wise count rates for Quadrant C Data is divided into 100 sec bins |
 |
 |
| Module-wise count rates for Quadrant D Data is divided into 100 sec bins |
 |
 |
| Parameter | Plot |
|---|---|
| CZT HV Monitor |  |
| D_VDD |  |
| Temperature 1 |  |
| Veto HV Monitor |  |
| Veto LLD |  |
| Alpha Counter |  |
| _CPM_Rate |  |
| CZT Counter | 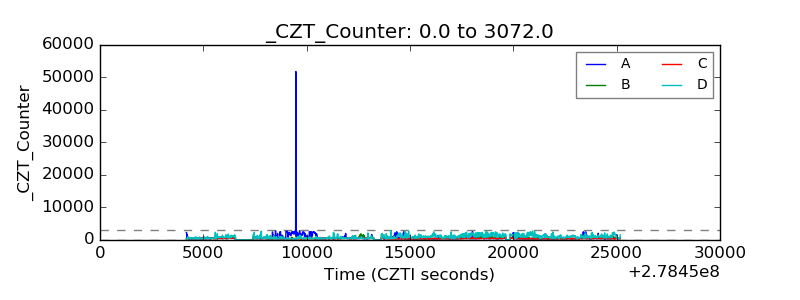 |
| +2.5 Volts monitor |  |
| +5 Volts monitor |  |
| _ROLL_ROT |  |
| _Roll_DEC |  |
| _Roll_RA |  |
| Veto Counter |  |