| Param | Original file | Final file |
|---|---|---|
| Filename | modeM0/AS1A05_101T09_9000002466_16678cztM0_level2.evt | modeM0/AS1A05_101T09_9000002466_16678cztM0_level2_quad_clean.evt |
| Size (bytes) | 643,970,880 | 134,850,240 |
| Size | 614.1 MB | 128.6 MB |
| Events in quadrant A | 6,298,480 | 878,856 |
| Events in quadrant B | 3,851,019 | 934,957 |
| Events in quadrant C | 3,444,676 | 892,657 |
| Events in quadrant D | 5,404,831 | 859,863 |
| Mode SS | |||
|---|---|---|---|
| Quadrant | BADHDUFLAG | Total packets | Discarded packets |
| A | 0 | 150 | 0 |
| B | 0 | 150 | 0 |
| C | 0 | 150 | 0 |
| D | 0 | 150 | 0 |
| Mode M9 | |||
|---|---|---|---|
| Quadrant | BADHDUFLAG | Total packets | Discarded packets |
| A | 0 | 8 | 0 |
| B | 0 | 8 | 0 |
| C | 0 | 8 | 0 |
| D | 0 | 9 | 0 |
| Mode M0 | |||
|---|---|---|---|
| Quadrant | BADHDUFLAG | Total packets | Discarded packets |
| A | 0 | 23676 | 3 |
| B | 0 | 16381 | 2 |
| C | 0 | 15262 | 2 |
| D | 0 | 21184 | 2 |
| Quadrant | Total seconds | Saturated seconds | Saturation percentage |
|---|---|---|---|
| A | 7438 | 889 | 11.952138% |
| B | 7438 | 125 | 1.680559% |
| C | 7438 | 82 | 1.102447% |
| D | 7438 | 296 | 3.979564% |
Noise dominated data is calculated using 1-second bins in cleaned event files. If a bin has >2000 counts, and if more than 50% of those come from <1% of pixels, then it is considered to be noise-dominated and hence unusable.
| Quadrant | # 1 sec bins | Bins with >0 counts | Bins with >2000 counts | High rate bins dominated by noise | Noise dominated (total time) | Noise dominated (detector-on time) | Marked lightcurve |
|---|---|---|---|---|---|---|---|
| A | 7819 | 7440 | 826 | 826 | 10.56% | 11.10% | 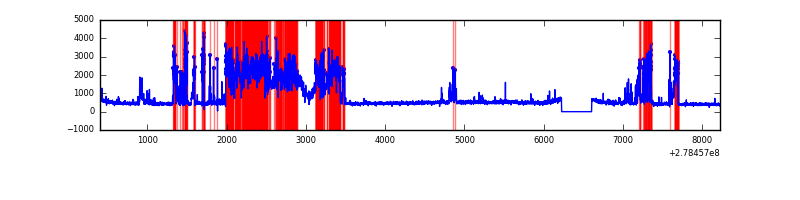 |
| B | 7819 | 7440 | 20 | 20 | 0.26% | 0.27% | 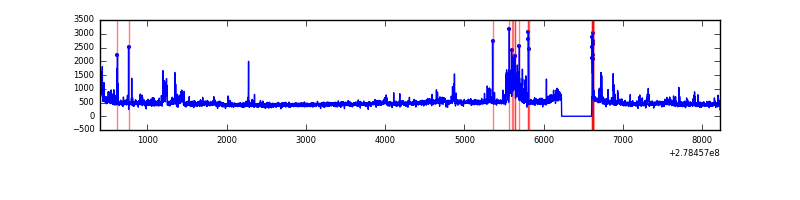 |
| C | 7819 | 7440 | 0 | 0 | 0.00% | 0.00% | 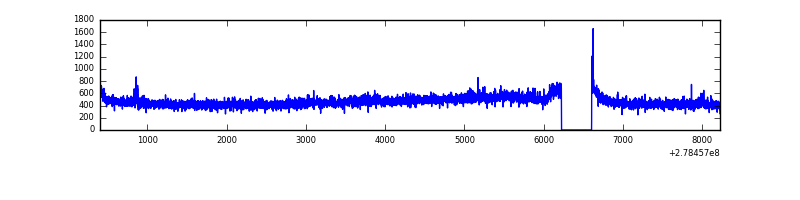 |
| D | 7819 | 7440 | 220 | 220 | 2.81% | 2.96% | 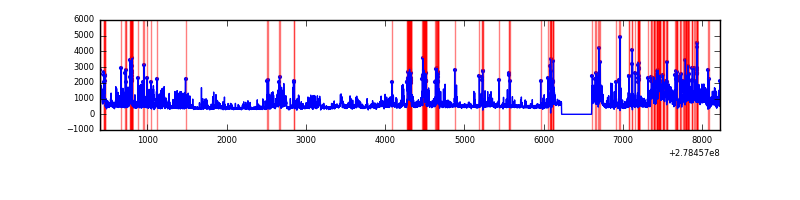 |
Top three noisy pixels from each quadrant. If the there are fewer than three noisy pixels in the level2.evt file, extra rows are filled as -1
| Pixel properties | Quadrant properties | ||||||
|---|---|---|---|---|---|---|---|
| Quadrant | DetID | PixID | Counts | Sigma | Mean | Median | Sigma |
| A | 15 | 174 | 3082035 | 18403.77 | 827 | 809 | 167.4 |
| A | 3 | 1 | 25998 | 150.45 | 827 | 809 | 167.4 |
| A | 0 | 226 | 7292 | 38.72 | 827 | 809 | 167.4 |
| B | 15 | 35 | 218840 | 1339.64 | 860 | 838 | 162.7 |
| B | 7 | 220 | 71182 | 432.27 | 860 | 838 | 162.7 |
| B | 0 | 229 | 67877 | 411.96 | 860 | 838 | 162.7 |
| C | 14 | 238 | 127342 | 666.92 | 816 | 819 | 189.7 |
| C | 3 | 233 | 91120 | 475.99 | 816 | 819 | 189.7 |
| C | 7 | 247 | 38177 | 196.92 | 816 | 819 | 189.7 |
| D | 1 | 52 | 1398244 | 7085.37 | 817 | 791 | 197.2 |
| D | 2 | 16 | 608517 | 3081.29 | 817 | 791 | 197.2 |
| D | 10 | 70 | 140150 | 706.58 | 817 | 791 | 197.2 |
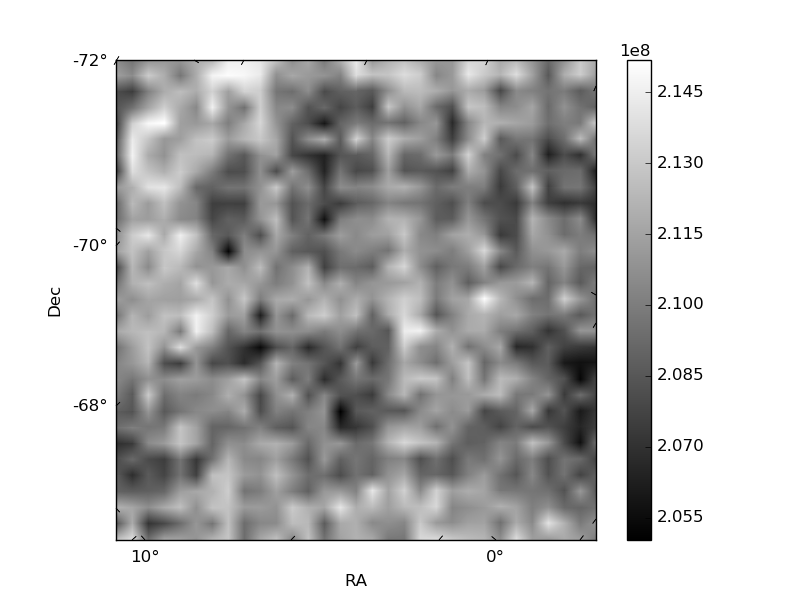
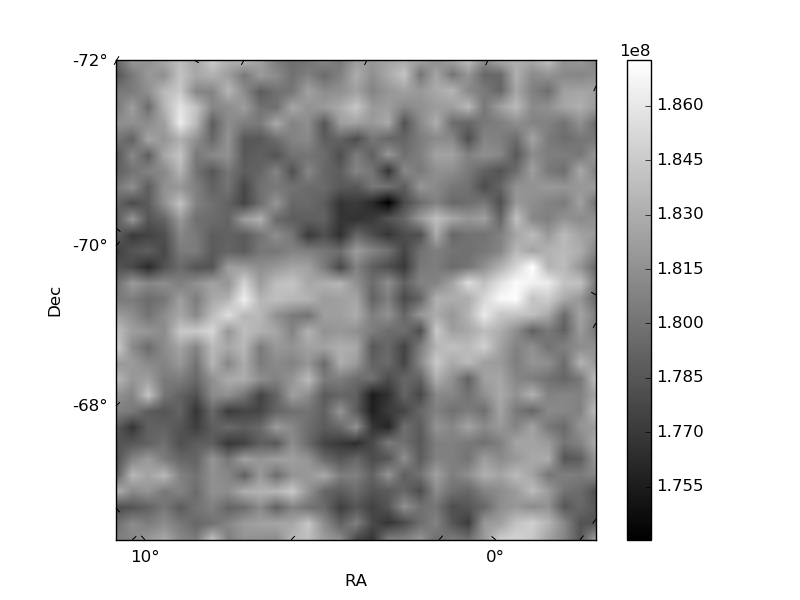
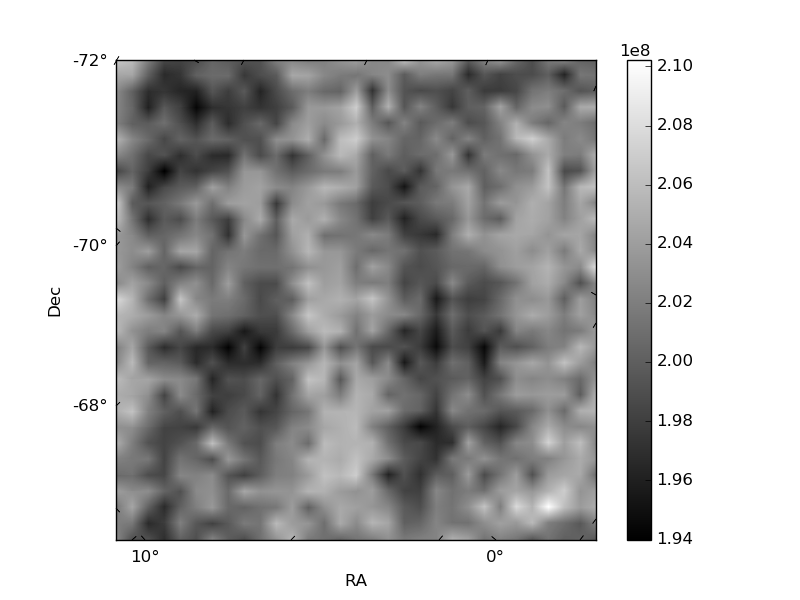
Histogram calculated using DETX and DETY for each event in the final _common_clean file
| Quadrant A | 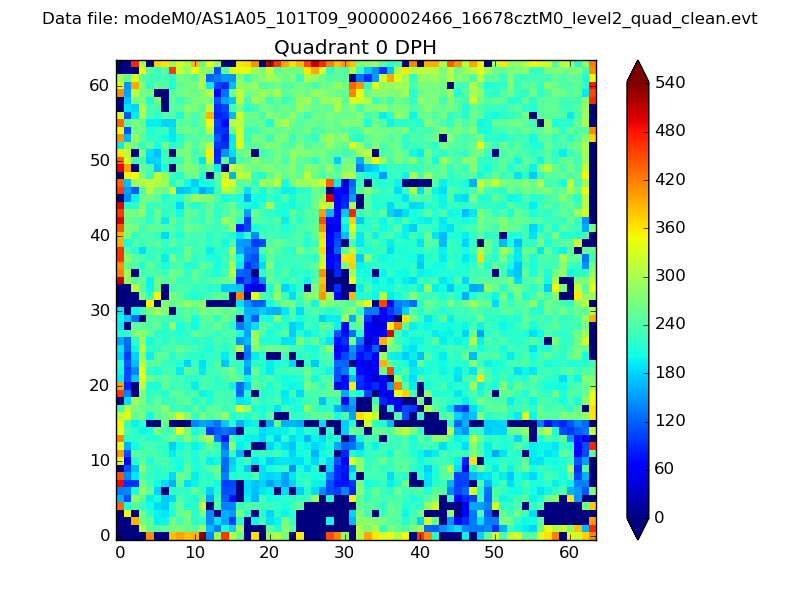 |
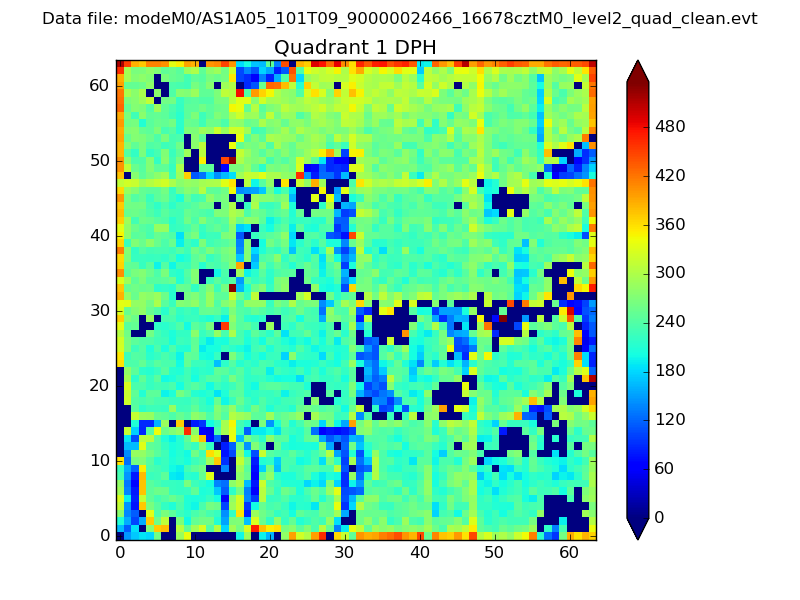 |
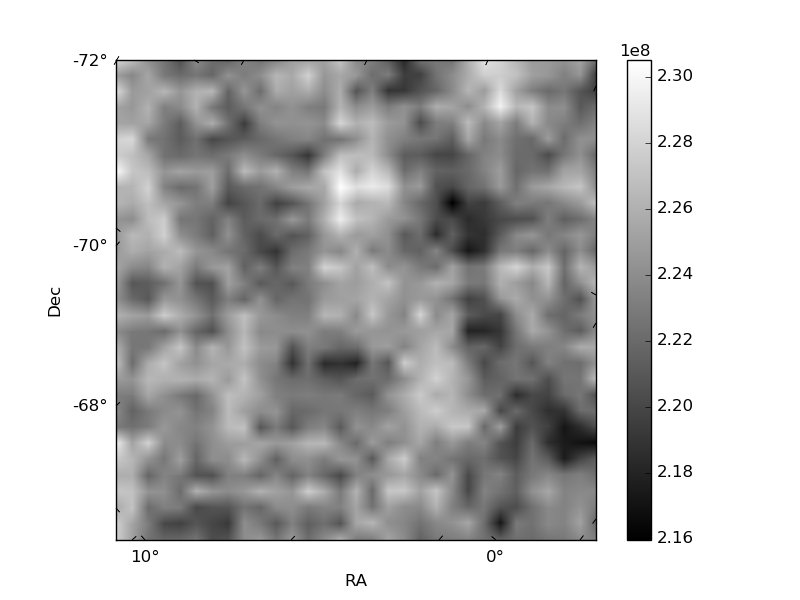
Quadrant B |
|---|---|---|---|
| Quadrant D | 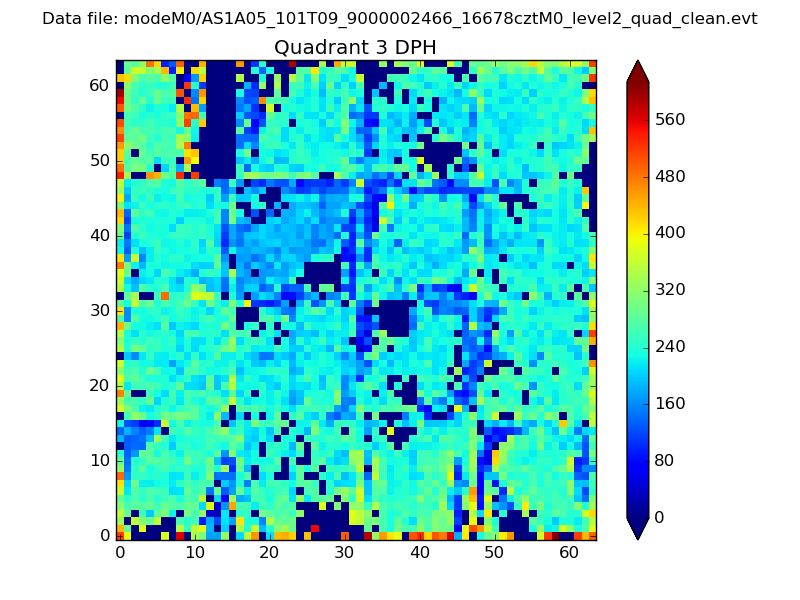 |
 |
Quadrant C |
| Plot type | Count rate plots | Images |
|---|---|---|
| Comparison with Poisson distribution Blue bars denote a histogram of data divided into 1 sec bins. Red curve is a Poisson curve with rate = median count rate of data. |
 |
 |
| Quadrant-wise count rates Data is divided into 100 sec bins |
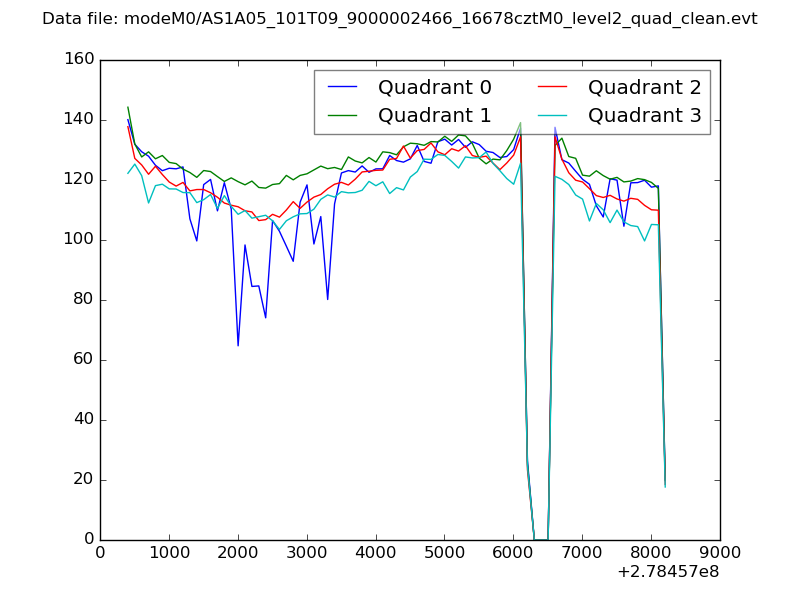 |
|
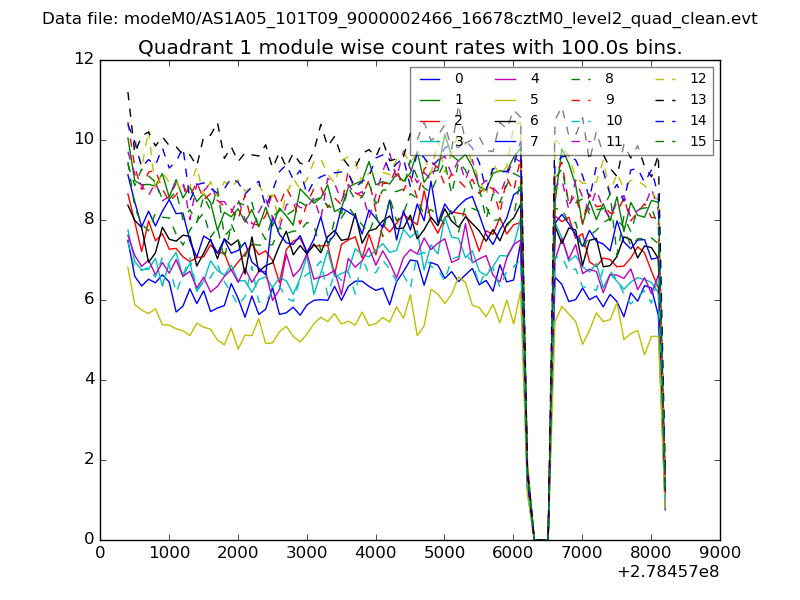
| Module-wise count rates for Quadrant A Data is divided into 100 sec bins |
 |
 |
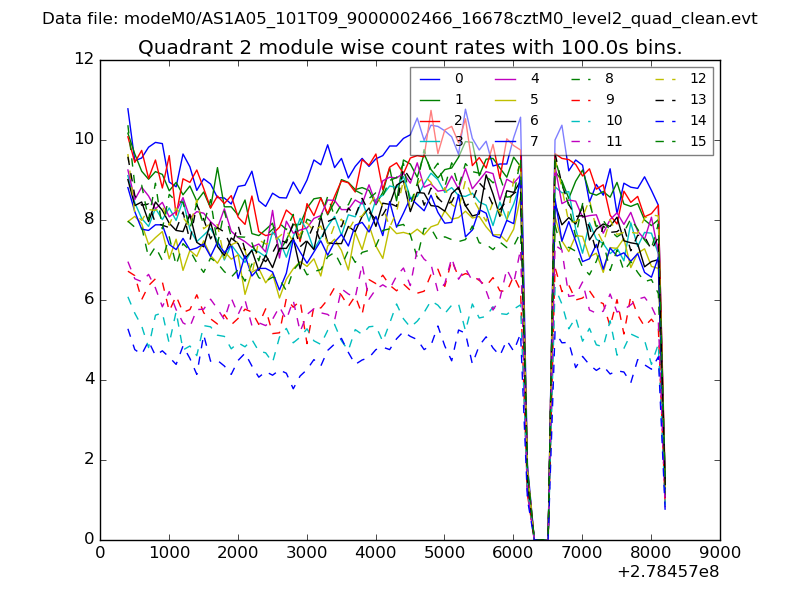
| Module-wise count rates for Quadrant B Data is divided into 100 sec bins |
 |
 |
| Module-wise count rates for Quadrant C Data is divided into 100 sec bins |
 |
 |
| Module-wise count rates for Quadrant D Data is divided into 100 sec bins |
 |
 |
| Parameter | Plot |
|---|---|
| CZT HV Monitor | 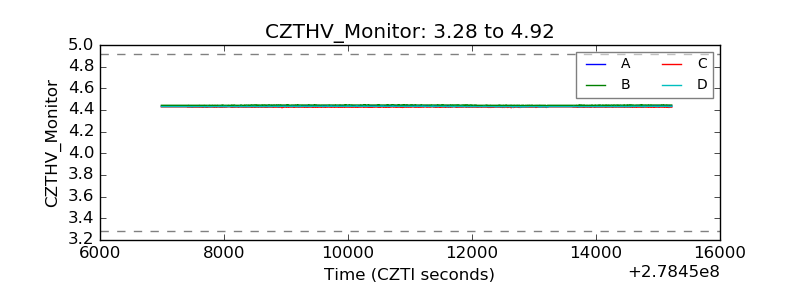 |
| D_VDD | 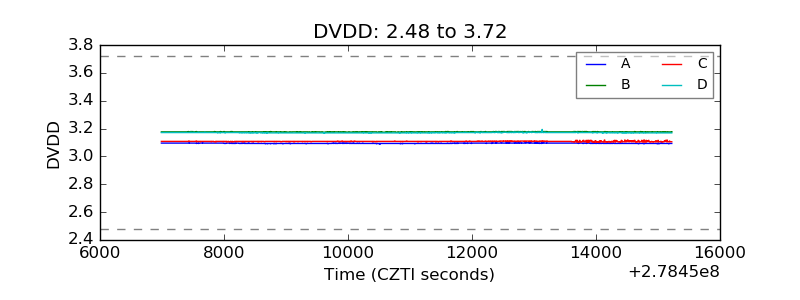 |
| Temperature 1 | 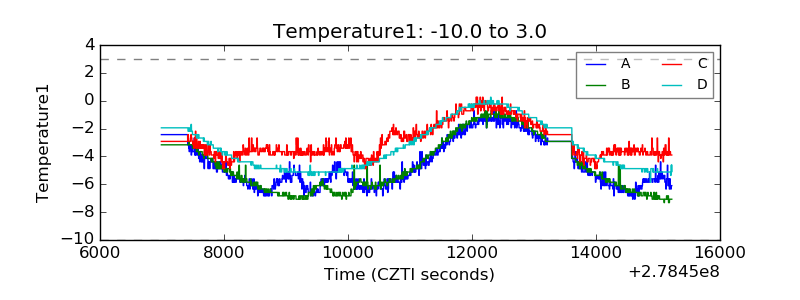 |
| Veto HV Monitor | 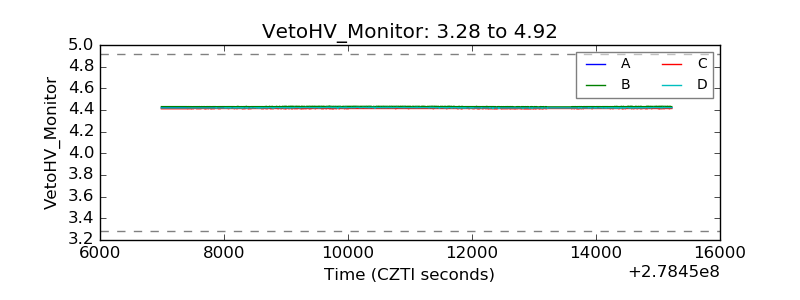 |
| Veto LLD | 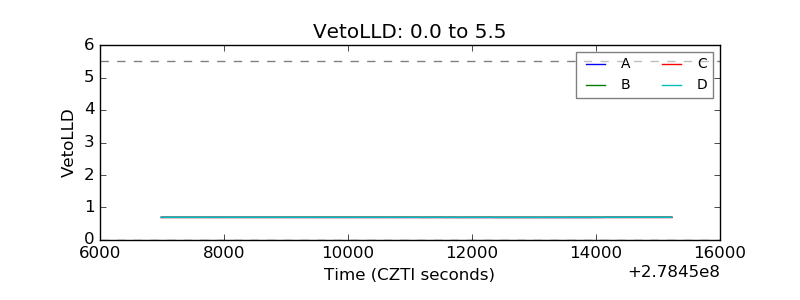 |
| Alpha Counter | 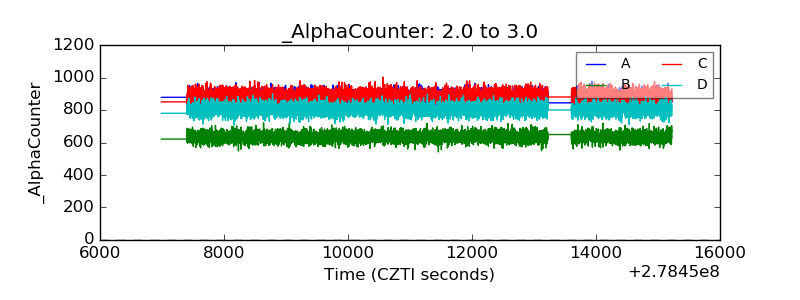 |
| _CPM_Rate | 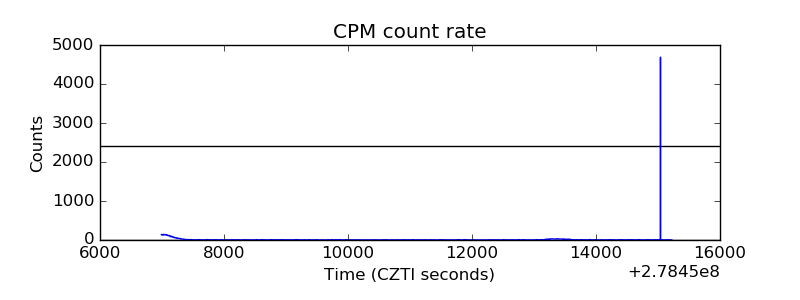 |
| CZT Counter |  |
| +2.5 Volts monitor |  |
| +5 Volts monitor |  |
| _ROLL_ROT |  |
| _Roll_DEC |  |
| _Roll_RA |  |
| Veto Counter | 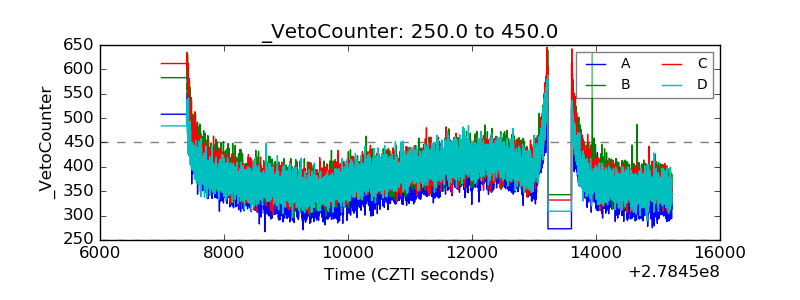 |