| Param | Original file | Final file |
|---|---|---|
| Filename | modeM0/AS1A05_101T09_9000002466_16679cztM0_level2.evt | modeM0/AS1A05_101T09_9000002466_16679cztM0_level2_quad_clean.evt |
| Size (bytes) | 765,138,240 | 147,009,600 |
| Size | 729.7 MB | 140.2 MB |
| Events in quadrant A | 4,509,890 | 997,883 |
| Events in quadrant B | 4,356,319 | 1,017,755 |
| Events in quadrant C | 3,820,087 | 975,751 |
| Events in quadrant D | 9,931,087 | 890,014 |
| Mode SS | |||
|---|---|---|---|
| Quadrant | BADHDUFLAG | Total packets | Discarded packets |
| A | 0 | 168 | 0 |
| B | 0 | 168 | 0 |
| C | 0 | 168 | 0 |
| D | 0 | 168 | 0 |
| Mode M9 | |||
|---|---|---|---|
| Quadrant | BADHDUFLAG | Total packets | Discarded packets |
| A | 0 | 6 | 0 |
| B | 0 | 6 | 0 |
| C | 0 | 6 | 0 |
| D | 0 | 6 | 0 |
| Mode M0 | |||
|---|---|---|---|
| Quadrant | BADHDUFLAG | Total packets | Discarded packets |
| A | 0 | 19126 | 3 |
| B | 0 | 18286 | 2 |
| C | 0 | 16986 | 2 |
| D | 0 | 35222 | 2 |
| Quadrant | Total seconds | Saturated seconds | Saturation percentage |
|---|---|---|---|
| A | 8210 | 316 | 3.848965% |
| B | 8210 | 234 | 2.850183% |
| C | 8210 | 174 | 2.119367% |
| D | 8210 | 1201 | 14.628502% |
Noise dominated data is calculated using 1-second bins in cleaned event files. If a bin has >2000 counts, and if more than 50% of those come from <1% of pixels, then it is considered to be noise-dominated and hence unusable.
| Quadrant | # 1 sec bins | Bins with >0 counts | Bins with >2000 counts | High rate bins dominated by noise | Noise dominated (total time) | Noise dominated (detector-on time) | Marked lightcurve |
|---|---|---|---|---|---|---|---|
| A | 8761 | 8213 | 150 | 150 | 1.71% | 1.83% | 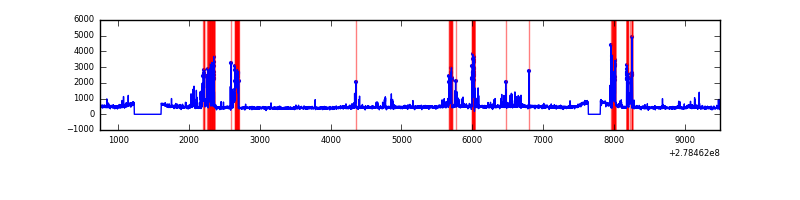 |
| B | 8761 | 8213 | 24 | 24 | 0.27% | 0.29% | 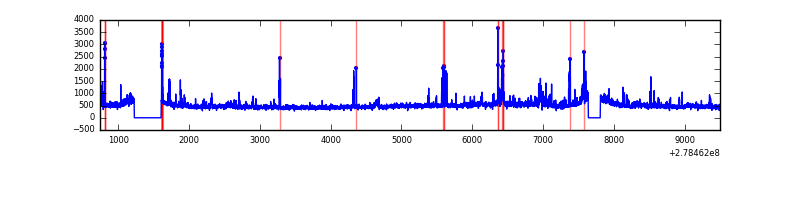 |
| C | 8761 | 8213 | 0 | 0 | 0.00% | 0.00% | 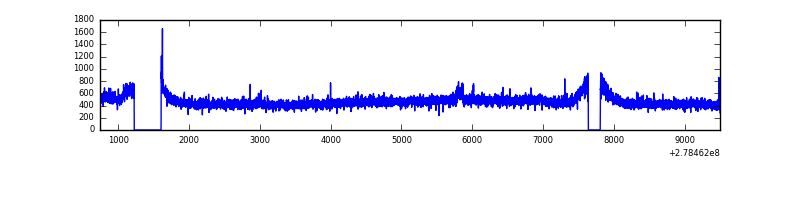 |
| D | 8761 | 8213 | 848 | 848 | 9.68% | 10.33% | 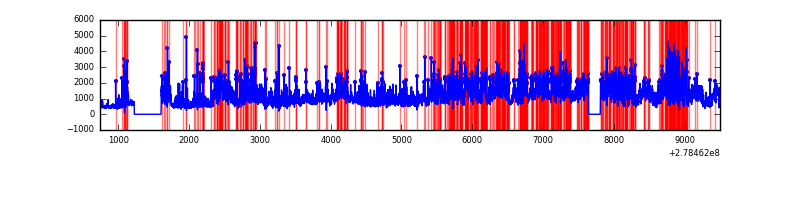 |
Top three noisy pixels from each quadrant. If the there are fewer than three noisy pixels in the level2.evt file, extra rows are filled as -1
| Pixel properties | Quadrant properties | ||||||
|---|---|---|---|---|---|---|---|
| Quadrant | DetID | PixID | Counts | Sigma | Mean | Median | Sigma |
| A | 15 | 174 | 749049 | 3912.73 | 952 | 930 | 191.2 |
| A | 12 | 96 | 47690 | 244.56 | 952 | 930 | 191.2 |
| A | 9 | 143 | 34160 | 173.8 | 952 | 930 | 191.2 |
| B | 15 | 35 | 226651 | 1222.33 | 963 | 937 | 184.7 |
| B | 0 | 229 | 137636 | 740.28 | 963 | 937 | 184.7 |
| B | 0 | 189 | 61555 | 328.27 | 963 | 937 | 184.7 |
| C | 14 | 238 | 140391 | 650.76 | 918 | 920 | 214.3 |
| C | 3 | 233 | 50097 | 229.46 | 918 | 920 | 214.3 |
| C | 7 | 247 | 33941 | 154.07 | 918 | 920 | 214.3 |
| D | 2 | 16 | 4646513 | 21615.39 | 888 | 860 | 214.9 |
| D | 1 | 52 | 1501692 | 6983.1 | 888 | 860 | 214.9 |
| D | 10 | 70 | 189344 | 876.98 | 888 | 860 | 214.9 |
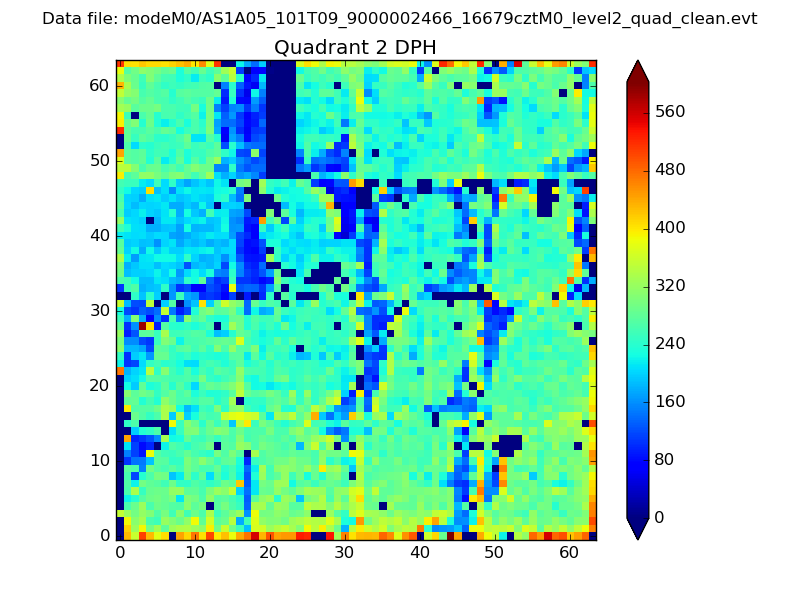
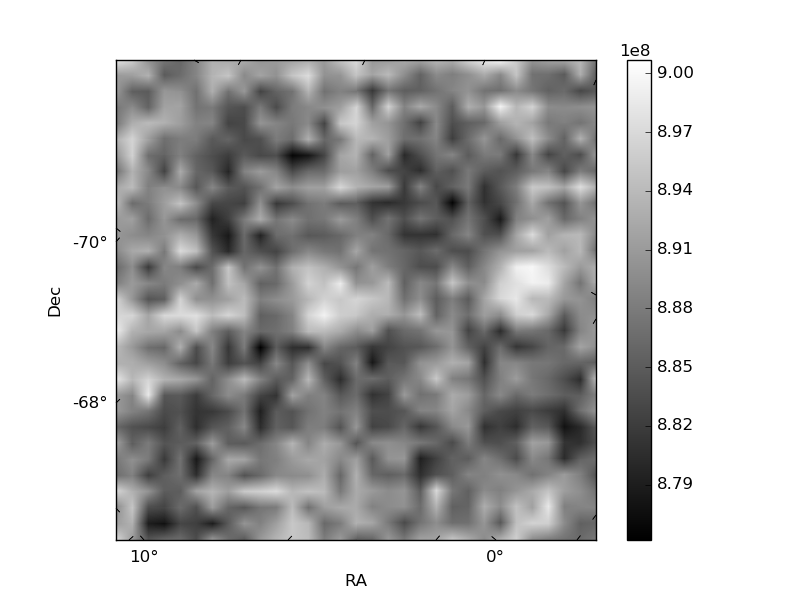
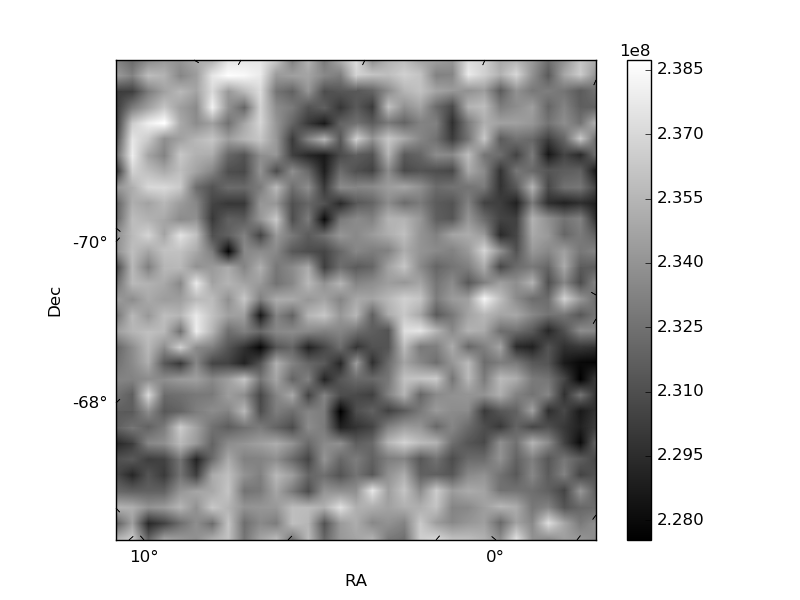
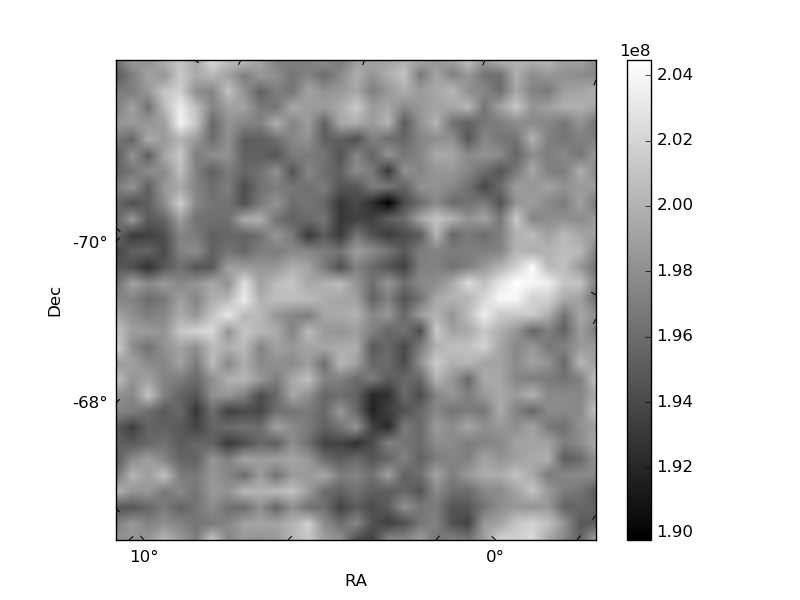
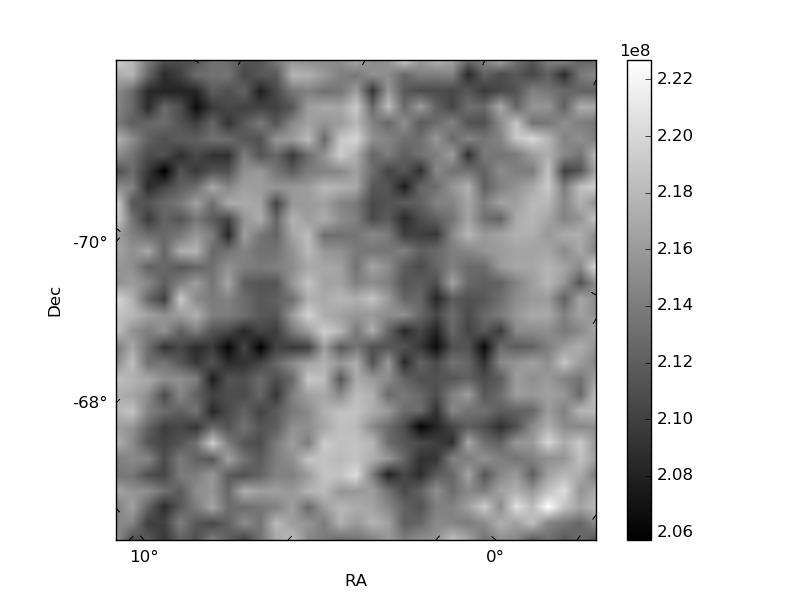
Histogram calculated using DETX and DETY for each event in the final _common_clean file
| Quadrant A | 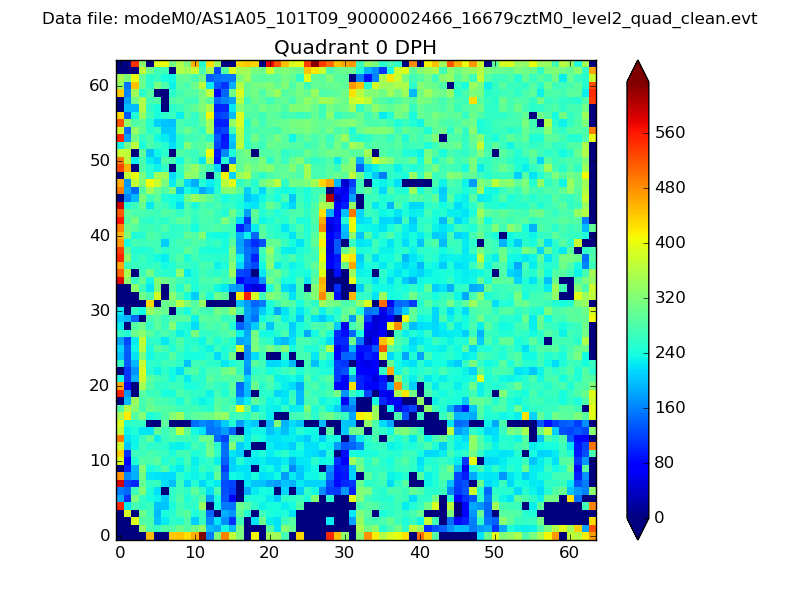 |
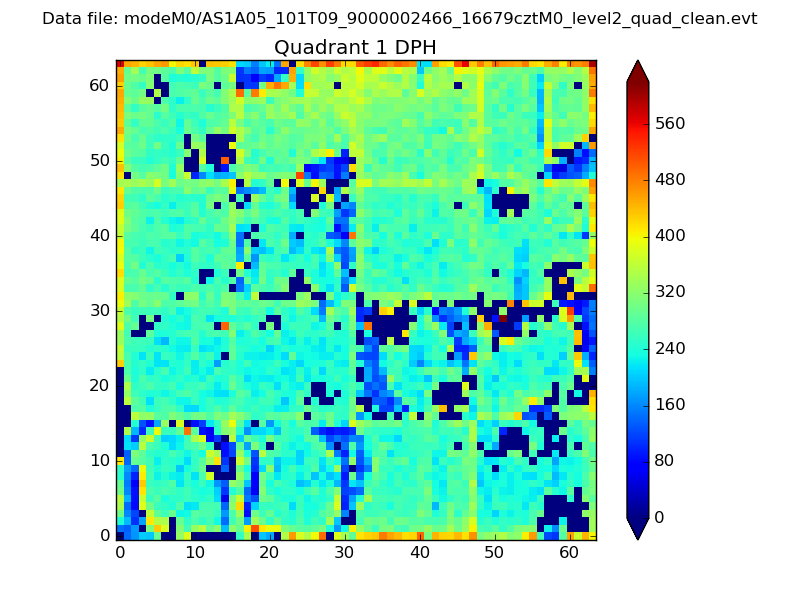 |
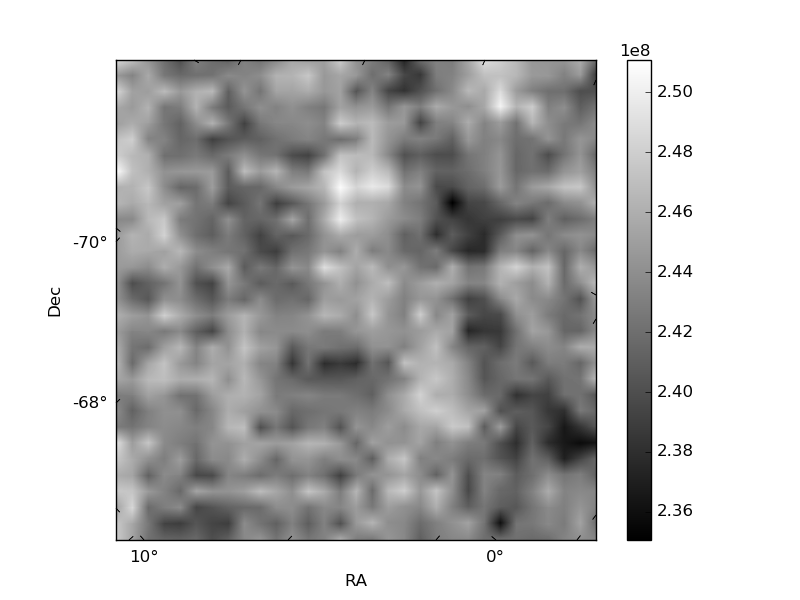
Quadrant B |
|---|---|---|---|
| Quadrant D | 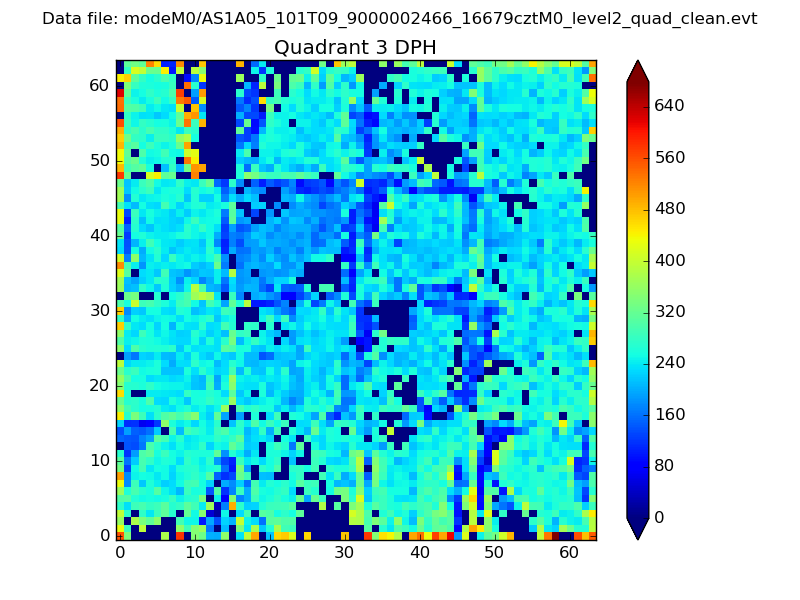 |
 |
Quadrant C |
| Plot type | Count rate plots | Images |
|---|---|---|
| Comparison with Poisson distribution Blue bars denote a histogram of data divided into 1 sec bins. Red curve is a Poisson curve with rate = median count rate of data. |
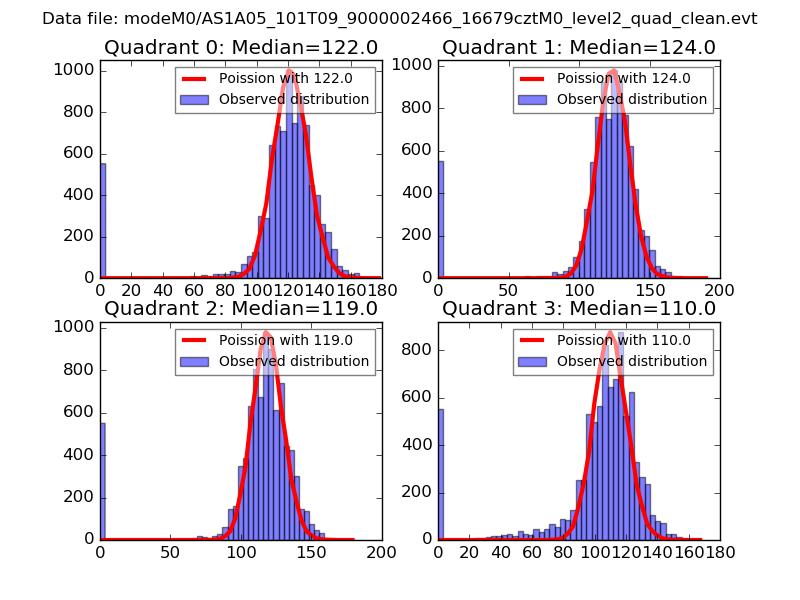 |
 |
| Quadrant-wise count rates Data is divided into 100 sec bins |
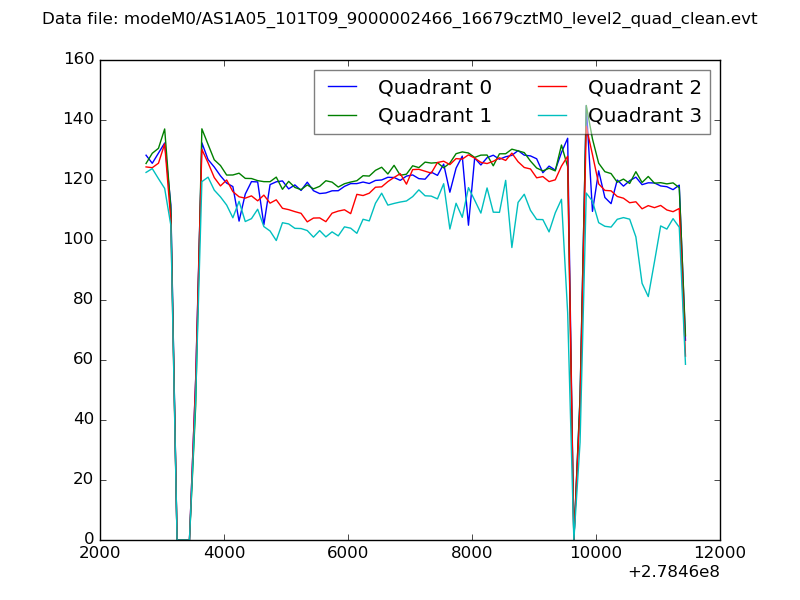 |
|
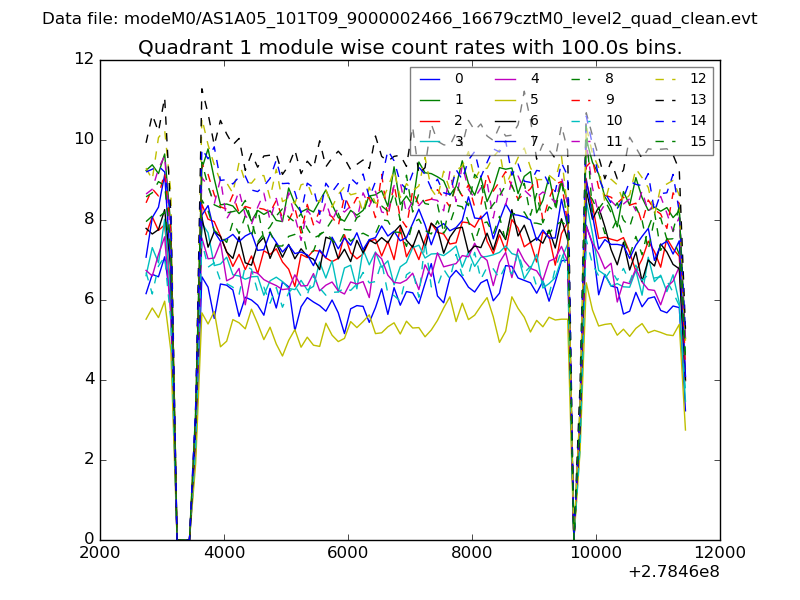
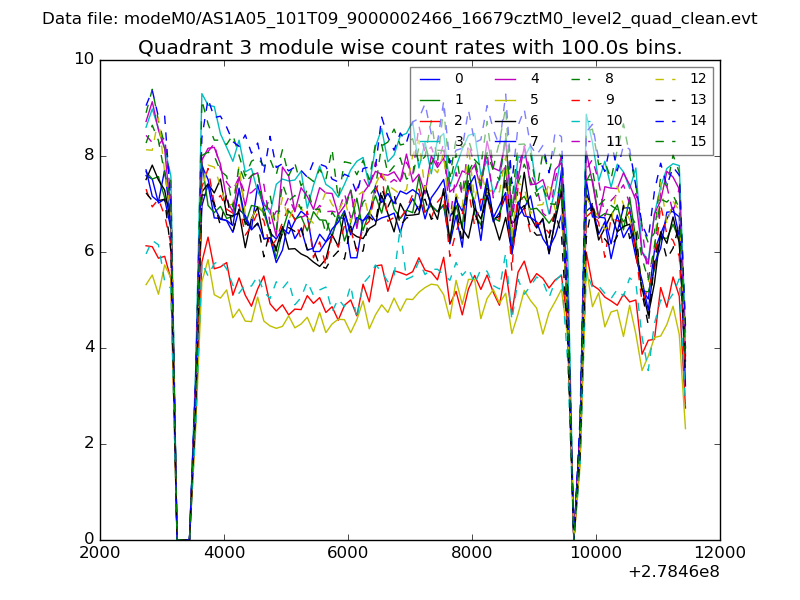
| Module-wise count rates for Quadrant A Data is divided into 100 sec bins |
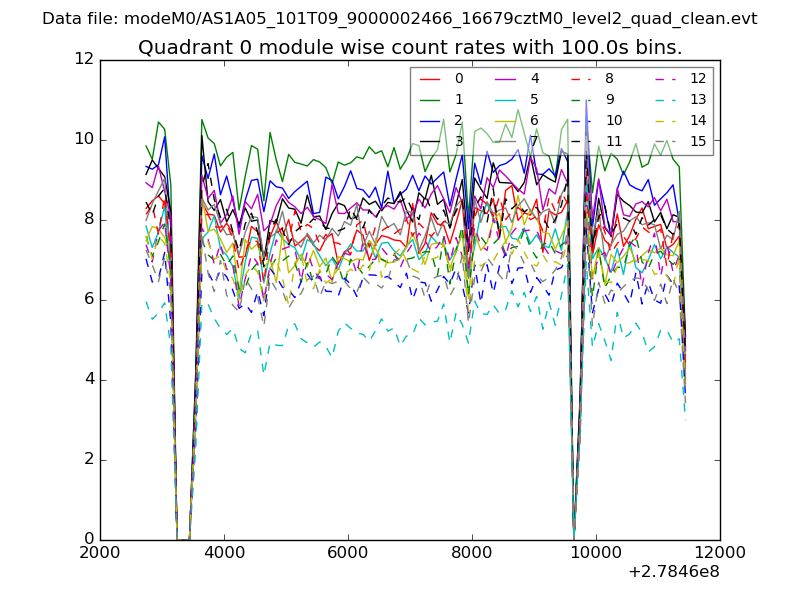 |
 |
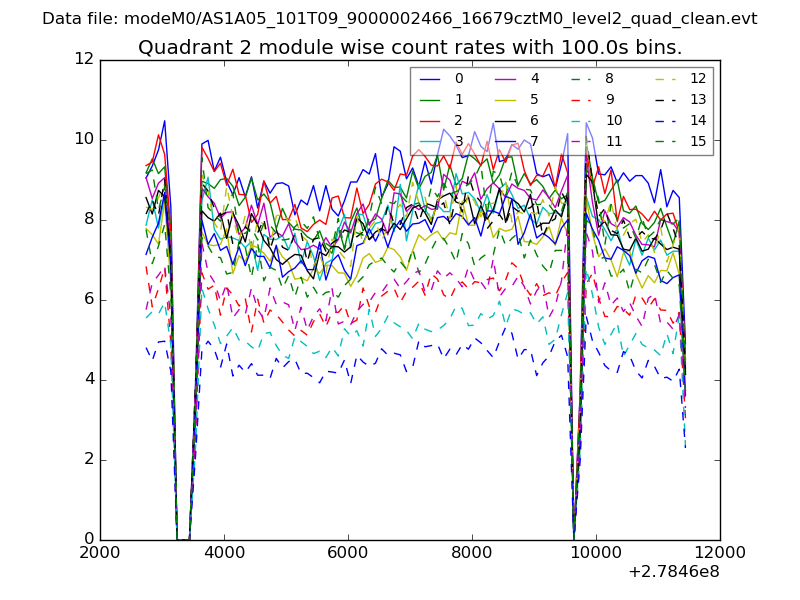
| Module-wise count rates for Quadrant B Data is divided into 100 sec bins |
 |
 |
| Module-wise count rates for Quadrant C Data is divided into 100 sec bins |
 |
 |
| Module-wise count rates for Quadrant D Data is divided into 100 sec bins |
 |
 |
| Parameter | Plot |
|---|---|
| CZT HV Monitor | 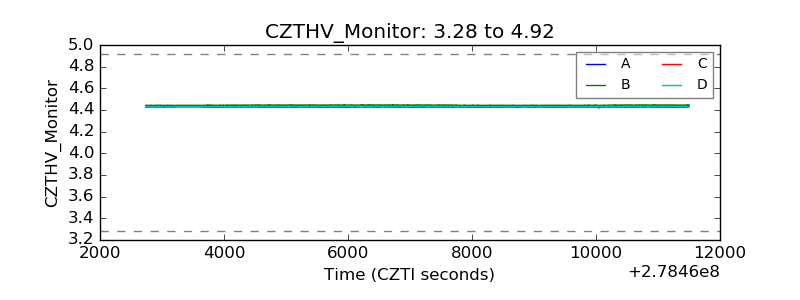 |
| D_VDD | 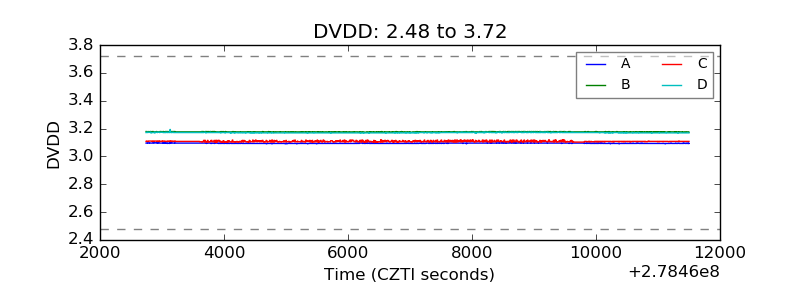 |
| Temperature 1 | 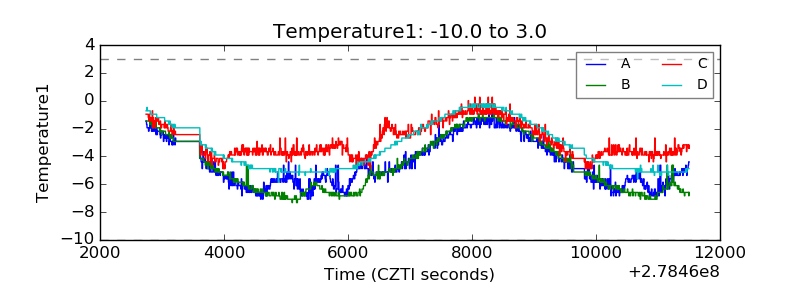 |
| Veto HV Monitor | 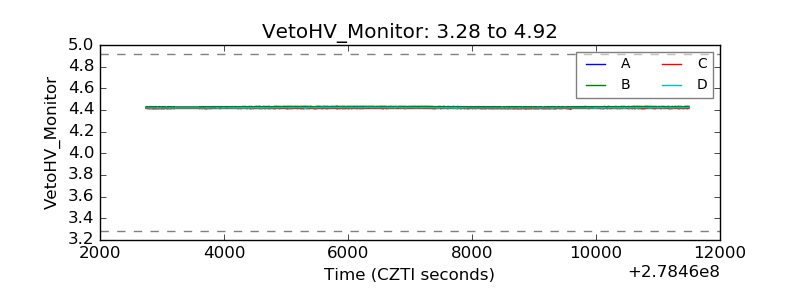 |
| Veto LLD | 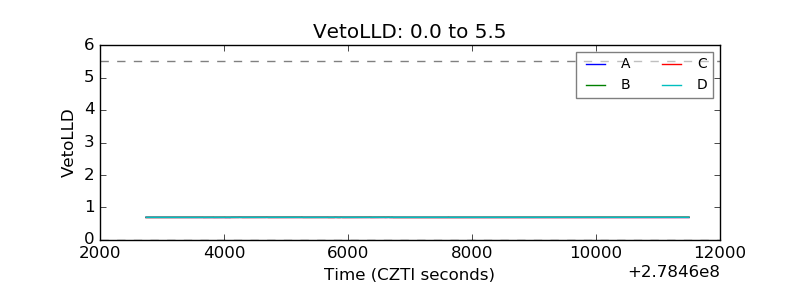 |
| Alpha Counter | 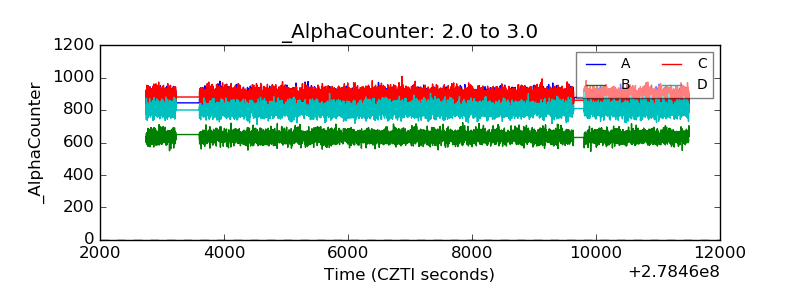 |
| _CPM_Rate | 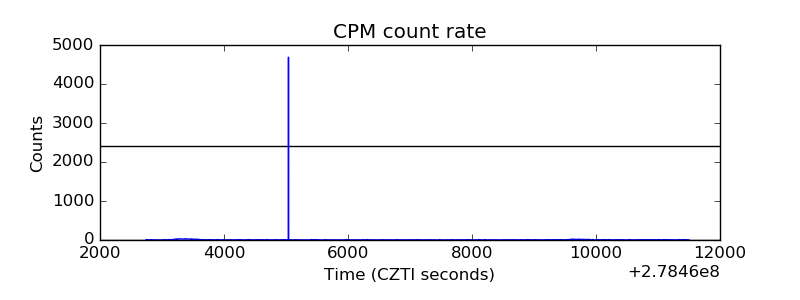 |
| CZT Counter | 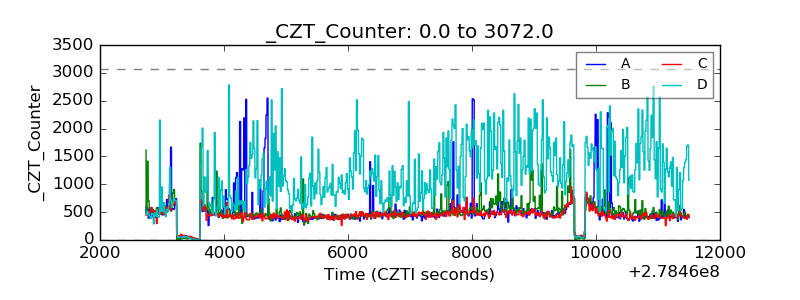 |
| +2.5 Volts monitor |  |
| +5 Volts monitor | 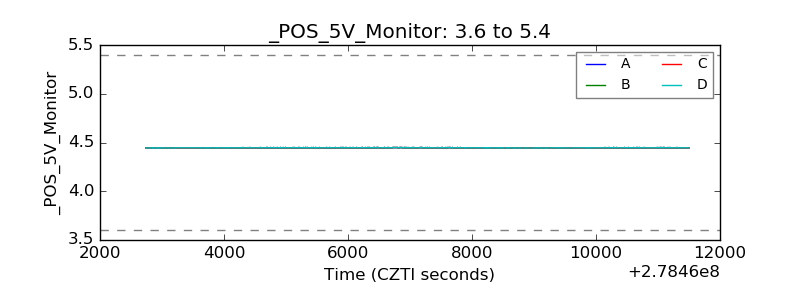 |
| _ROLL_ROT | 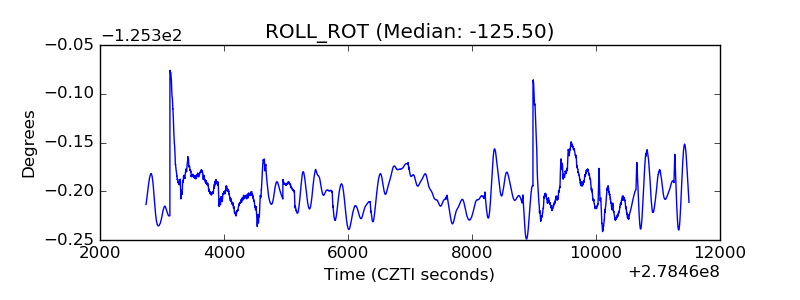 |
| _Roll_DEC | 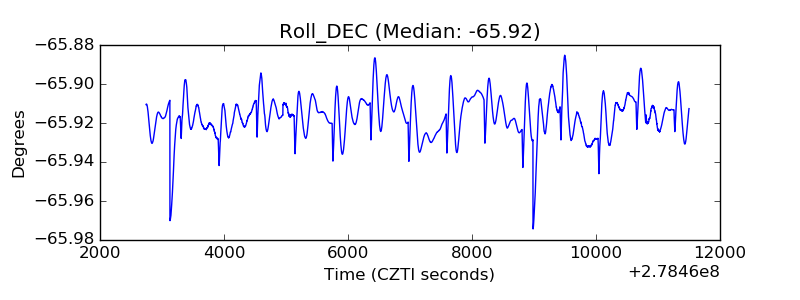 |
| _Roll_RA | 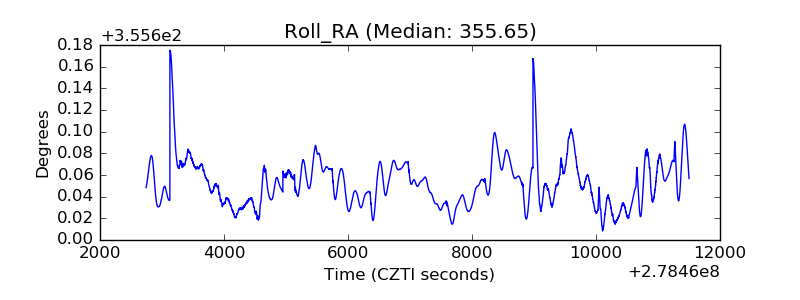 |
| Veto Counter | 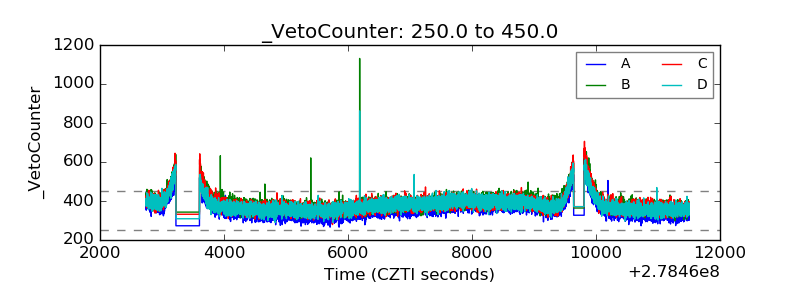 |