| Param | Original file | Final file |
|---|---|---|
| Filename | modeM0/AS1A05_101T09_9000002466_16680cztM0_level2.evt | modeM0/AS1A05_101T09_9000002466_16680cztM0_level2_quad_clean.evt |
| Size (bytes) | 476,841,600 | 95,653,440 |
| Size | 454.8 MB | 91.2 MB |
| Events in quadrant A | 2,884,004 | 640,549 |
| Events in quadrant B | 2,730,306 | 660,376 |
| Events in quadrant C | 2,414,160 | 632,135 |
| Events in quadrant D | 6,049,560 | 588,646 |
| Mode SS | |||
|---|---|---|---|
| Quadrant | BADHDUFLAG | Total packets | Discarded packets |
| A | 0 | 106 | 0 |
| B | 0 | 106 | 0 |
| C | 0 | 106 | 0 |
| D | 0 | 106 | 0 |
| Mode M9 | |||
|---|---|---|---|
| Quadrant | BADHDUFLAG | Total packets | Discarded packets |
| A | 1 | 273359709408 | 0 |
| B | 1 | -1 | -1 |
| C | 1 | -1 | -1 |
| D | 1 | -1 | -1 |
| Mode M0 | |||
|---|---|---|---|
| Quadrant | BADHDUFLAG | Total packets | Discarded packets |
| A | 0 | 12291 | 1 |
| B | 0 | 11562 | 1 |
| C | 0 | 10857 | 1 |
| D | 0 | 21787 | 1 |
| Quadrant | Total seconds | Saturated seconds | Saturation percentage |
|---|---|---|---|
| A | 5361 | 171 | 3.189703% |
| B | 5361 | 63 | 1.175154% |
| C | 5361 | 58 | 1.081888% |
| D | 5361 | 469 | 8.748368% |
Noise dominated data is calculated using 1-second bins in cleaned event files. If a bin has >2000 counts, and if more than 50% of those come from <1% of pixels, then it is considered to be noise-dominated and hence unusable.
| Quadrant | # 1 sec bins | Bins with >0 counts | Bins with >2000 counts | High rate bins dominated by noise | Noise dominated (total time) | Noise dominated (detector-on time) | Marked lightcurve |
|---|---|---|---|---|---|---|---|
| A | 5362 | 5362 | 99 | 99 | 1.85% | 1.85% | 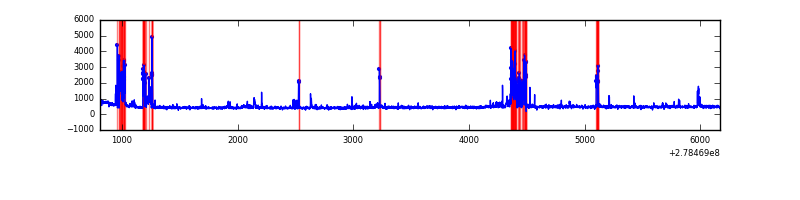 |
| B | 5362 | 5362 | 2 | 2 | 0.04% | 0.04% | 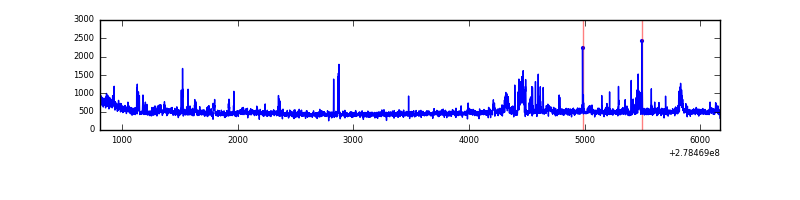 |
| C | 5362 | 5362 | 0 | 0 | 0.00% | 0.00% | 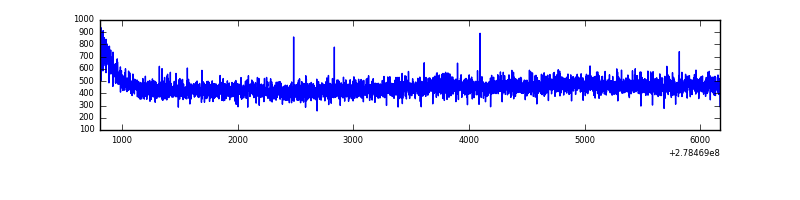 |
| D | 5362 | 5362 | 346 | 346 | 6.45% | 6.45% | 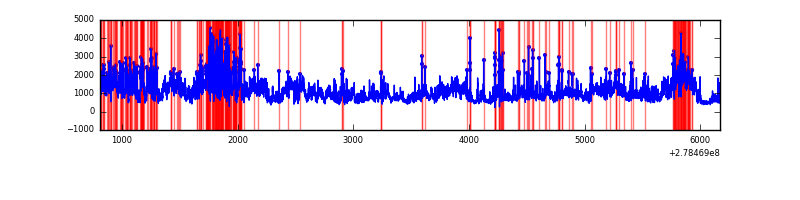 |
Top three noisy pixels from each quadrant. If the there are fewer than three noisy pixels in the level2.evt file, extra rows are filled as -1
| Pixel properties | Quadrant properties | ||||||
|---|---|---|---|---|---|---|---|
| Quadrant | DetID | PixID | Counts | Sigma | Mean | Median | Sigma |
| A | 15 | 174 | 509483 | 4047.13 | 611 | 597 | 125.7 |
| A | 12 | 96 | 10064 | 75.29 | 611 | 597 | 125.7 |
| A | 14 | 254 | 8051 | 59.28 | 611 | 597 | 125.7 |
| B | 15 | 35 | 123008 | 1027.99 | 619 | 603 | 119.1 |
| B | 0 | 229 | 92571 | 772.37 | 619 | 603 | 119.1 |
| B | 0 | 189 | 34296 | 282.96 | 619 | 603 | 119.1 |
| C | 14 | 238 | 90677 | 648.6 | 592 | 596 | 138.9 |
| C | 3 | 233 | 7881 | 52.45 | 592 | 596 | 138.9 |
| C | 7 | 247 | 6774 | 44.48 | 592 | 596 | 138.9 |
| D | 2 | 16 | 2764571 | 19568.68 | 581 | 564 | 141.2 |
| D | 1 | 52 | 826416 | 5846.89 | 581 | 564 | 141.2 |
| D | 10 | 70 | 156863 | 1106.57 | 581 | 564 | 141.2 |
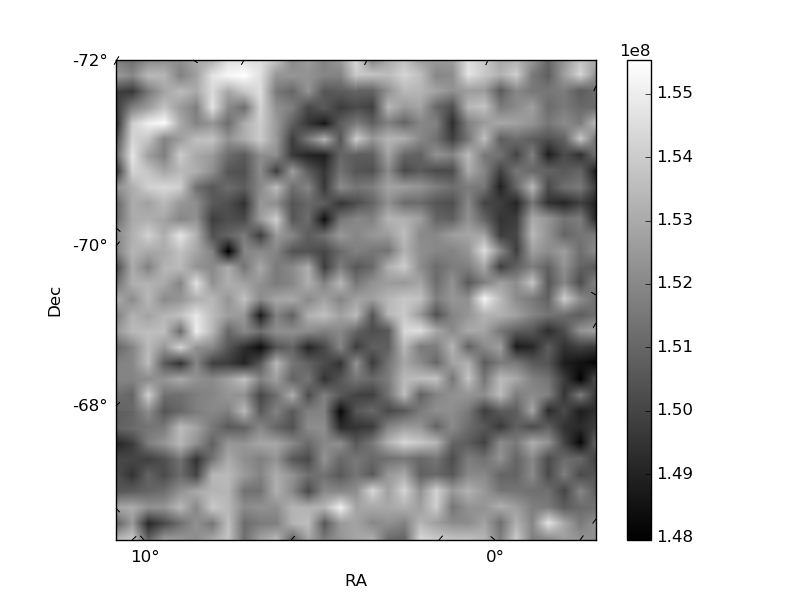
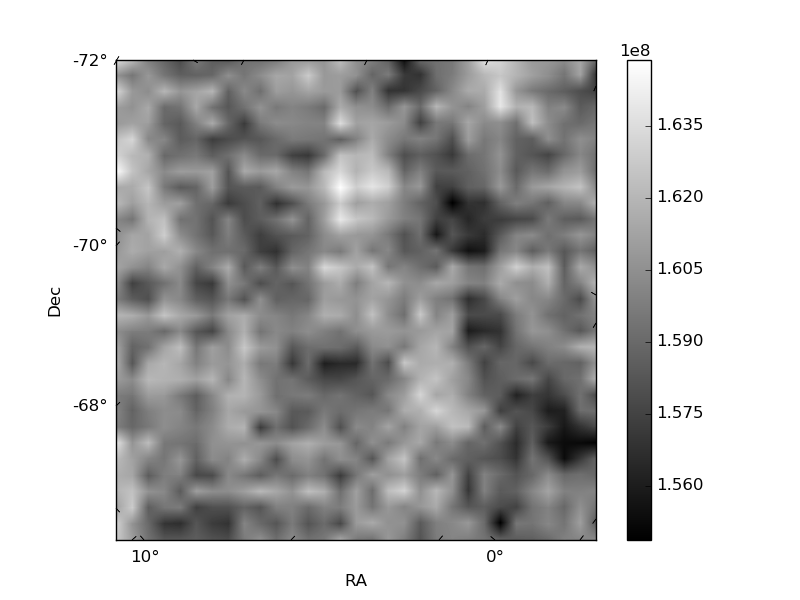
Histogram calculated using DETX and DETY for each event in the final _common_clean file
| Quadrant A | 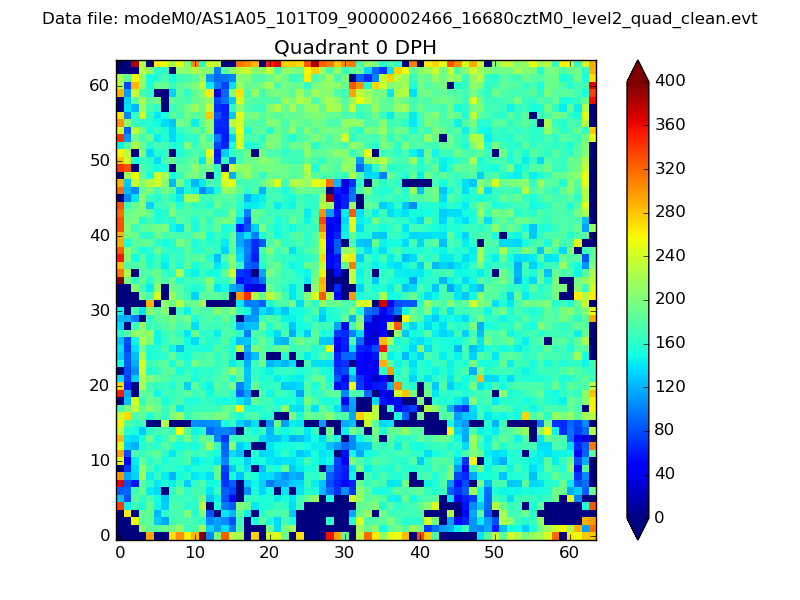 |
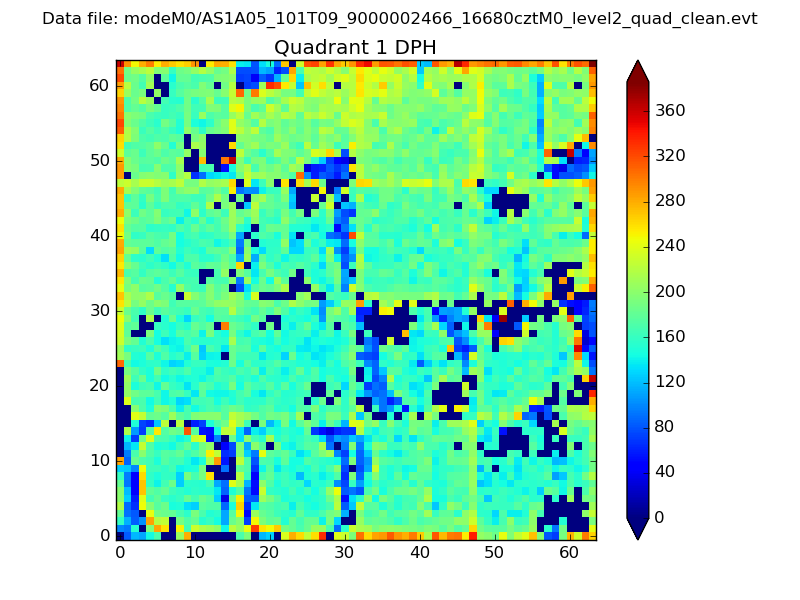 |
Quadrant B |
|---|---|---|---|
| Quadrant D |  |
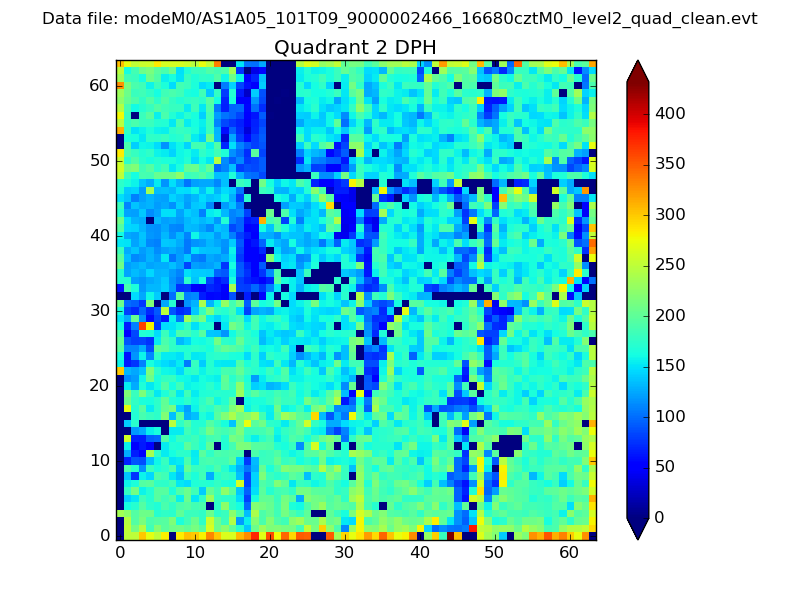 |
Quadrant C |
| Plot type | Count rate plots | Images |
|---|---|---|
| Comparison with Poisson distribution Blue bars denote a histogram of data divided into 1 sec bins. Red curve is a Poisson curve with rate = median count rate of data. |
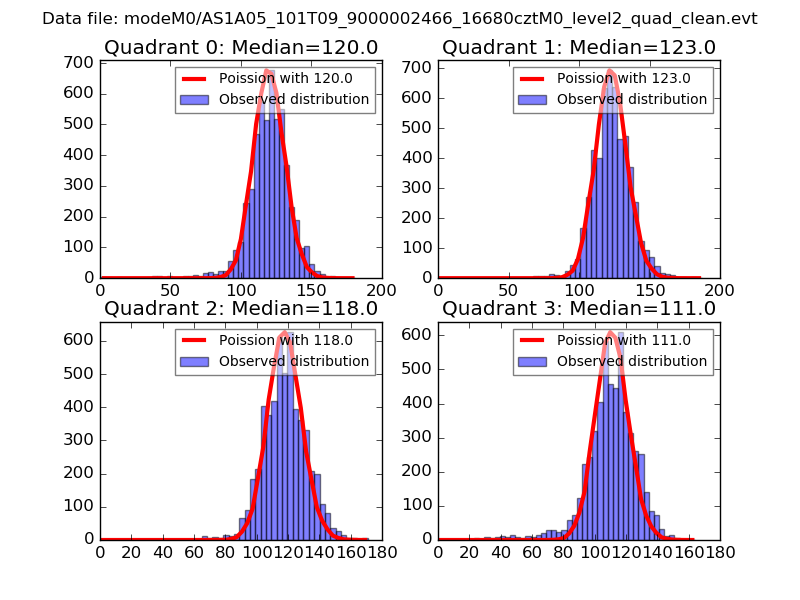 |
 |
| Quadrant-wise count rates Data is divided into 100 sec bins |
 |
|
| Module-wise count rates for Quadrant A Data is divided into 100 sec bins |
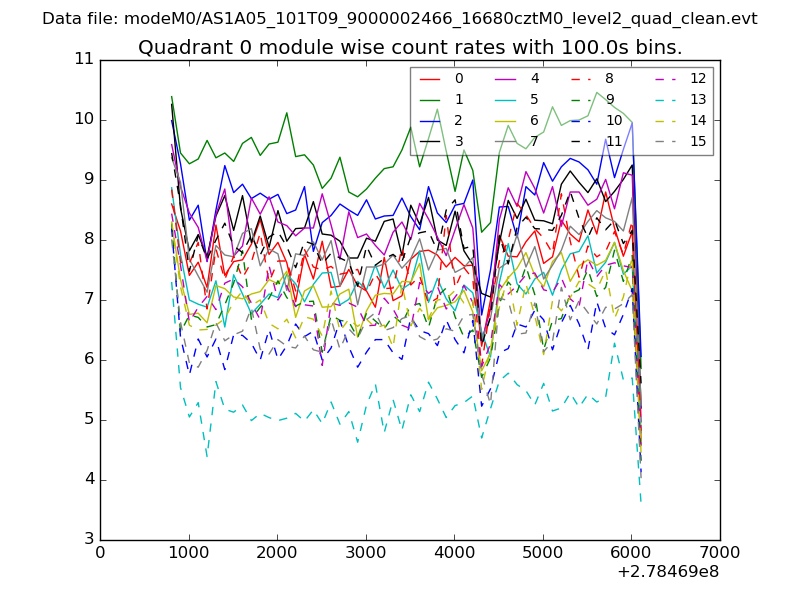 |
 |
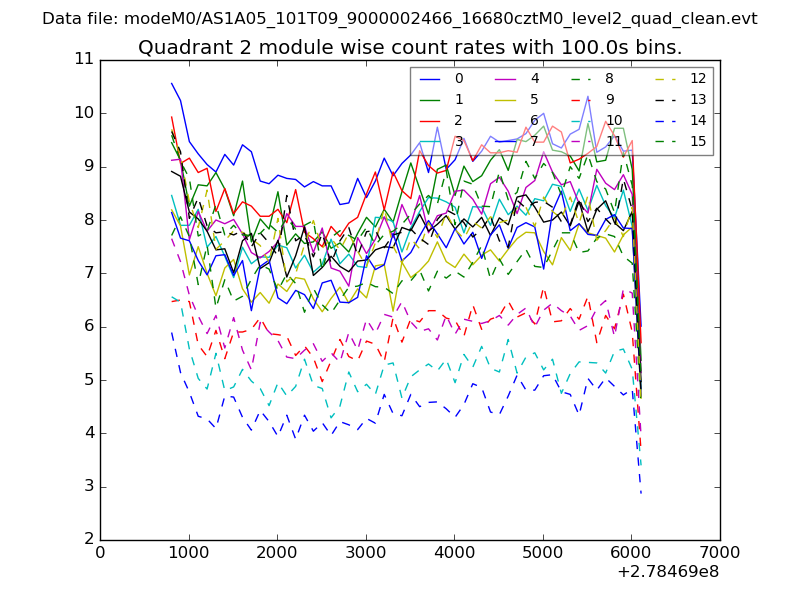
| Module-wise count rates for Quadrant B Data is divided into 100 sec bins |
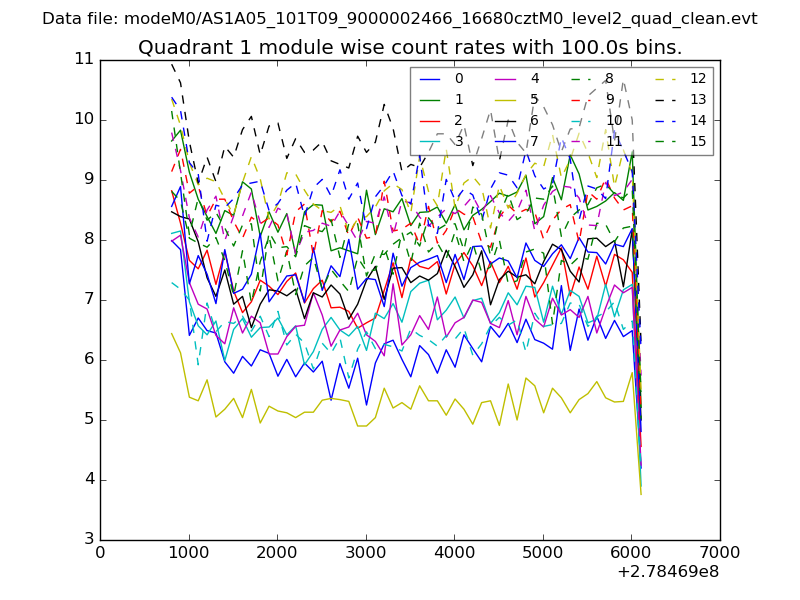 |
 |
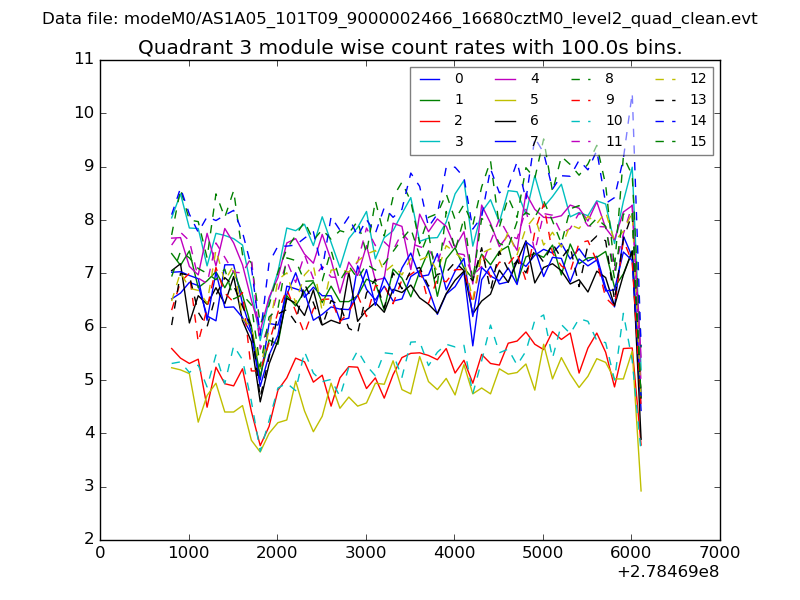
| Module-wise count rates for Quadrant C Data is divided into 100 sec bins |
 |
 |
| Module-wise count rates for Quadrant D Data is divided into 100 sec bins |
 |
 |
| Parameter | Plot |
|---|---|
| CZT HV Monitor | 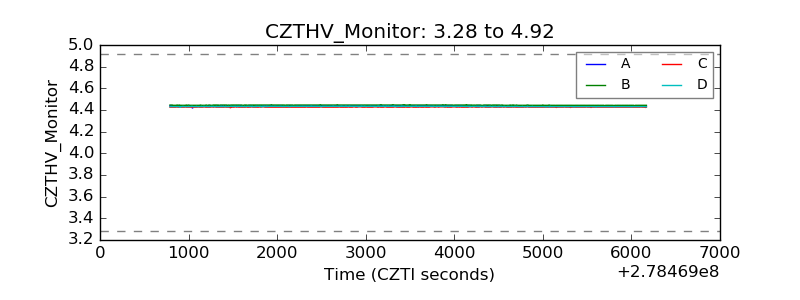 |
| D_VDD | 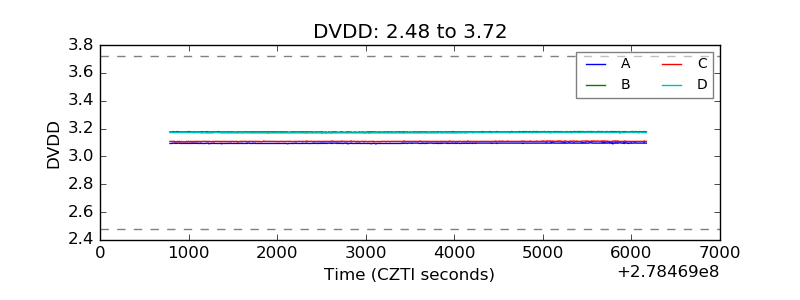 |
| Temperature 1 | 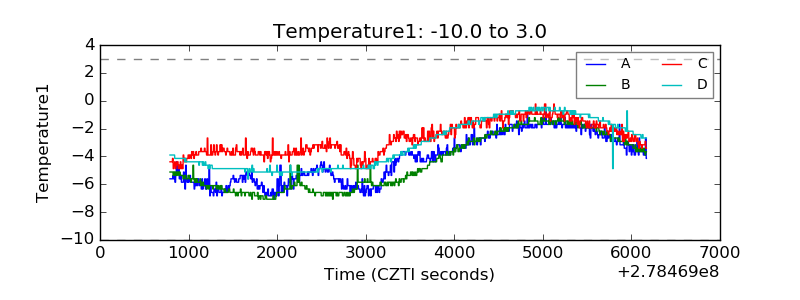 |
| Veto HV Monitor | 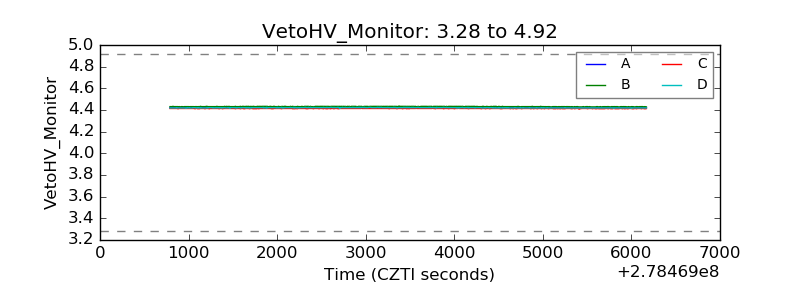 |
| Veto LLD | 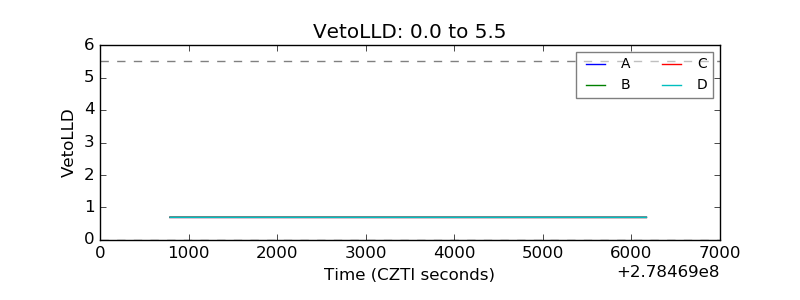 |
| Alpha Counter |  |
| _CPM_Rate | 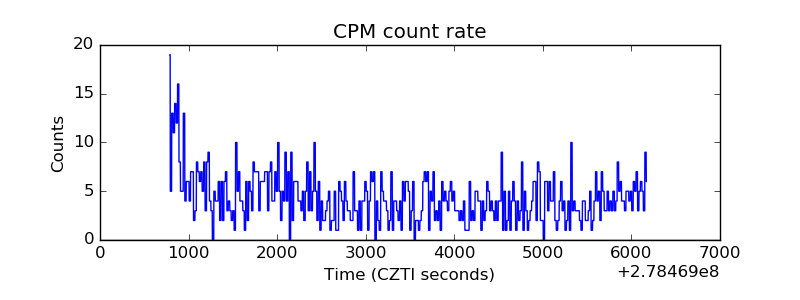 |
| CZT Counter |  |
| +2.5 Volts monitor |  |
| +5 Volts monitor |  |
| _ROLL_ROT | 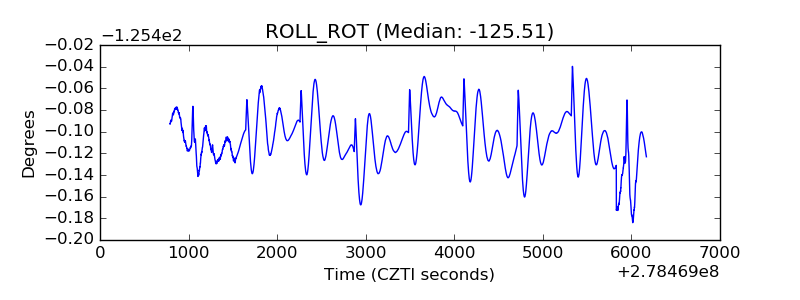 |
| _Roll_DEC | 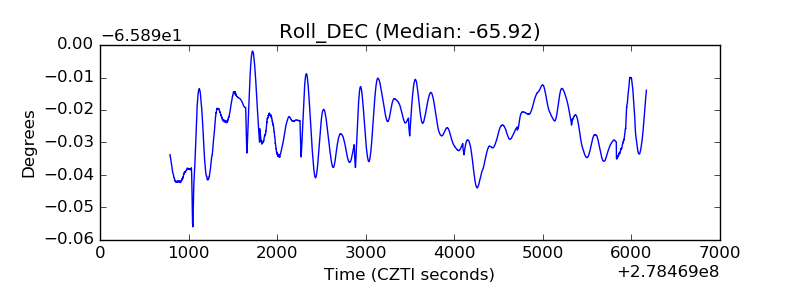 |
| _Roll_RA | 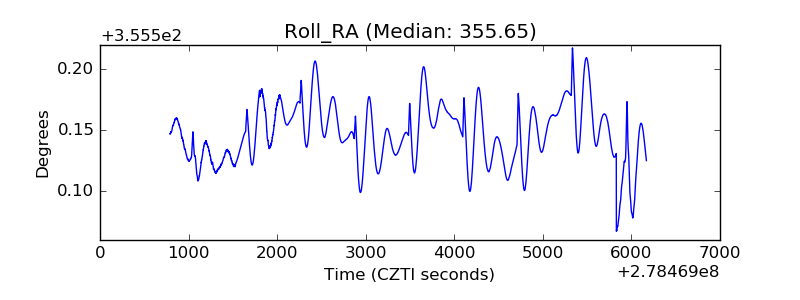 |
| Veto Counter | 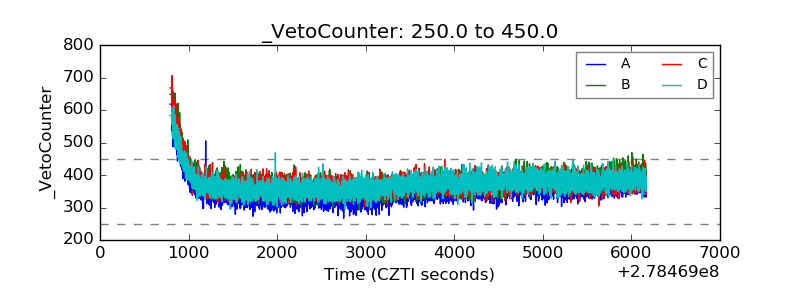 |