| Param | Original file | Final file |
|---|---|---|
| Filename | modeM0/AS1A05_104T04_9000002464cztM0_level2.fits | modeM0/AS1A05_104T04_9000002464cztM0_level2_quad_clean.evt |
| Size (bytes) | 135,567,360 | 83,908,800 |
| Size | 129.3 MB | 80.0 MB |
| Events in quadrant A | 861,104 | 433,114 |
| Events in quadrant B | 815,656 | 427,618 |
| Events in quadrant C | 828,396 | 410,009 |
| Events in quadrant D | 704,130 | 372,856 |
| Mode M9 | |||
|---|---|---|---|
| Quadrant | BADHDUFLAG | Total packets | Discarded packets |
| A | 0 | 37 | 0 |
| B | 0 | 37 | 0 |
| C | 0 | 37 | 0 |
| D | 0 | 37 | 0 |
| Mode M0 | |||
|---|---|---|---|
| Quadrant | BADHDUFLAG | Total packets | Discarded packets |
| A | 0 | 27988 | 0 |
| B | 0 | 30353 | 0 |
| C | 0 | 27847 | 0 |
| D | 0 | 38439 | 0 |
| Mode SS | |||
|---|---|---|---|
| Quadrant | BADHDUFLAG | Total packets | Discarded packets |
| A | 0 | 266 | 0 |
| B | 0 | 266 | 0 |
| C | 0 | 266 | 0 |
| D | 0 | 266 | 0 |
| Quadrant | Total seconds | Saturated seconds | Saturation percentage |
|---|---|---|---|
| A | 12963 | 327 | 2.522564% |
| B | 12963 | 358 | 2.761706% |
| C | 12963 | 374 | 2.885135% |
| D | 12963 | 1258 | 9.704544% |
Noise dominated data is calculated using 1-second bins in cleaned event files. If a bin has >2000 counts, and if more than 50% of those come from <1% of pixels, then it is considered to be noise-dominated and hence unusable.
| Quadrant | # 1 sec bins | Bins with >0 counts | Bins with >2000 counts | High rate bins dominated by noise | Noise dominated (total time) | Noise dominated (detector-on time) | Marked lightcurve |
|---|---|---|---|---|---|---|---|
| A | 16713 | 12963 | 0 | 0 | 0.00% | 0.00% | 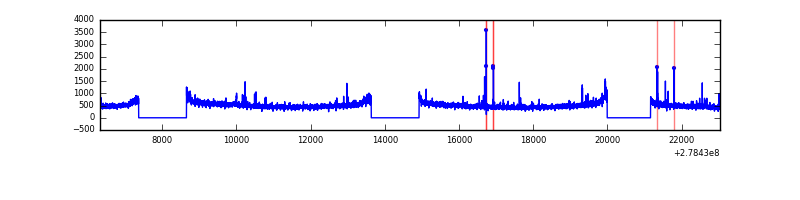 |
| B | 16713 | 12963 | 0 | 0 | 0.00% | 0.00% |  |
| C | 16713 | 12963 | 0 | 0 | 0.00% | 0.00% |  |
| D | 16713 | 12957 | 0 | 0 | 0.00% | 0.00% | 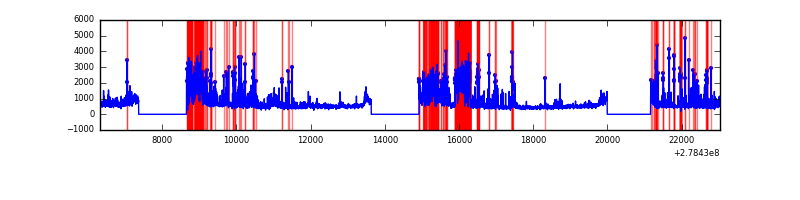 |
Top three noisy pixels from each quadrant. If the there are fewer than three noisy pixels in the level2.evt file, extra rows are filled as -1
| Pixel properties | Quadrant properties | ||||||
|---|---|---|---|---|---|---|---|
| Quadrant | DetID | PixID | Counts | Sigma | Mean | Median | Sigma |
| A | 0 | 29 | 767 | 9.58 | 224 | 211 | 58.0 |
| A | 9 | 19 | 658 | 7.7 | 224 | 211 | 58.0 |
| A | 7 | 110 | 643 | 7.45 | 224 | 211 | 58.0 |
| B | 2 | 9 | 628 | 9.38 | 216 | 207 | 44.9 |
| B | 5 | 128 | 562 | 7.91 | 216 | 207 | 44.9 |
| B | 3 | 17 | 536 | 7.33 | 216 | 207 | 44.9 |
| C | 1 | 80 | 625 | 7.29 | 218 | 204 | 57.7 |
| C | 1 | 81 | 618 | 7.17 | 218 | 204 | 57.7 |
| C | 12 | 241 | 608 | 7.0 | 218 | 204 | 57.7 |
| D | 1 | 19 | 515 | 6.13 | 201 | 184 | 54.0 |
| D | 3 | 14 | 514 | 6.11 | 201 | 184 | 54.0 |
| D | 10 | 189 | 507 | 5.98 | 201 | 184 | 54.0 |
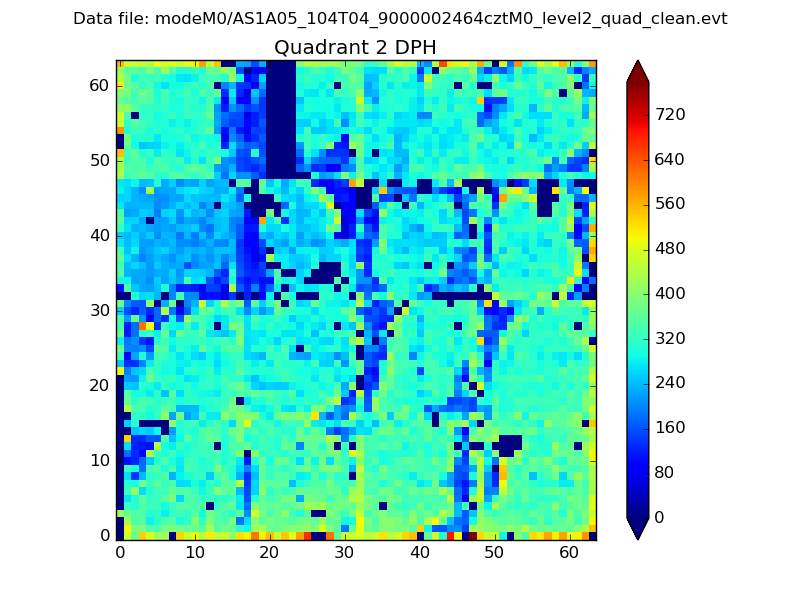
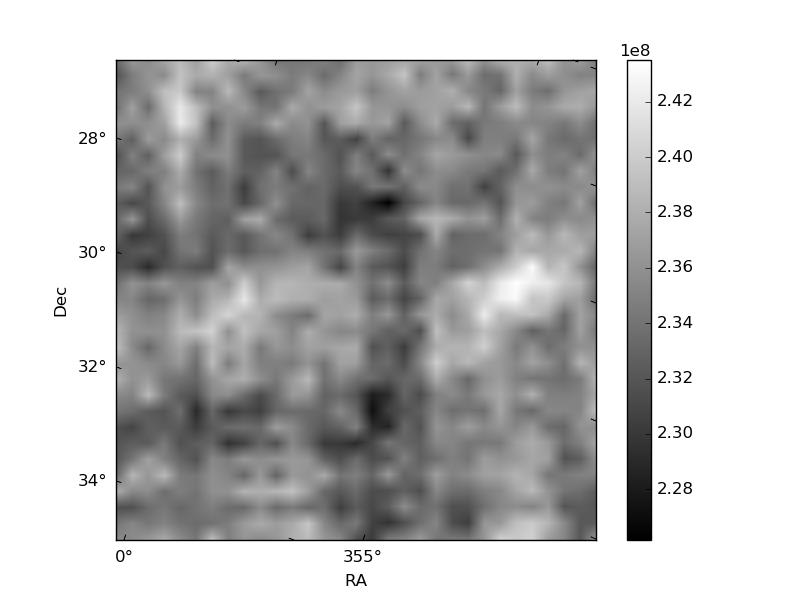
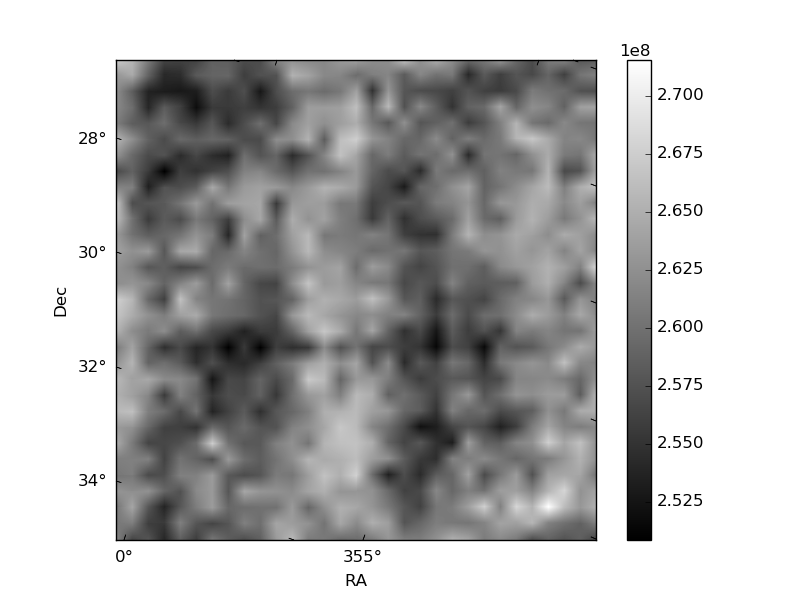
Histogram calculated using DETX and DETY for each event in the final _common_clean file
| Quadrant A | 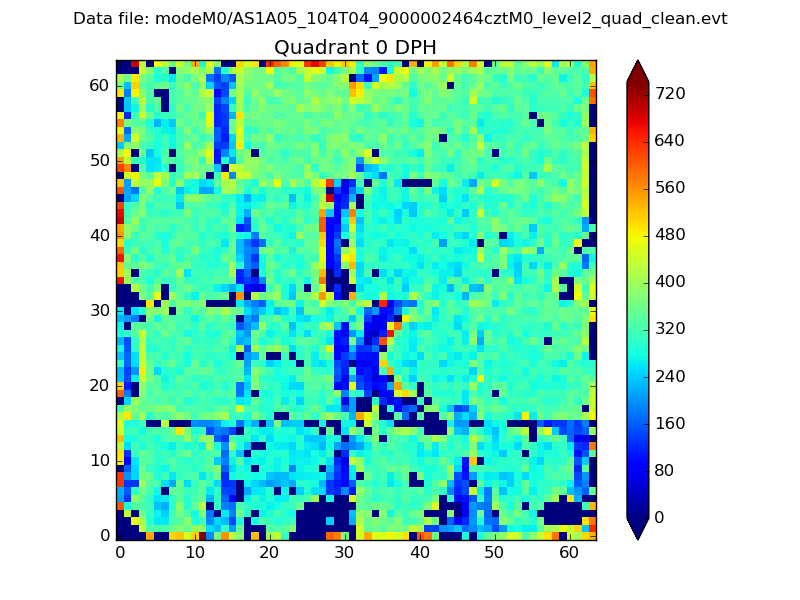 |
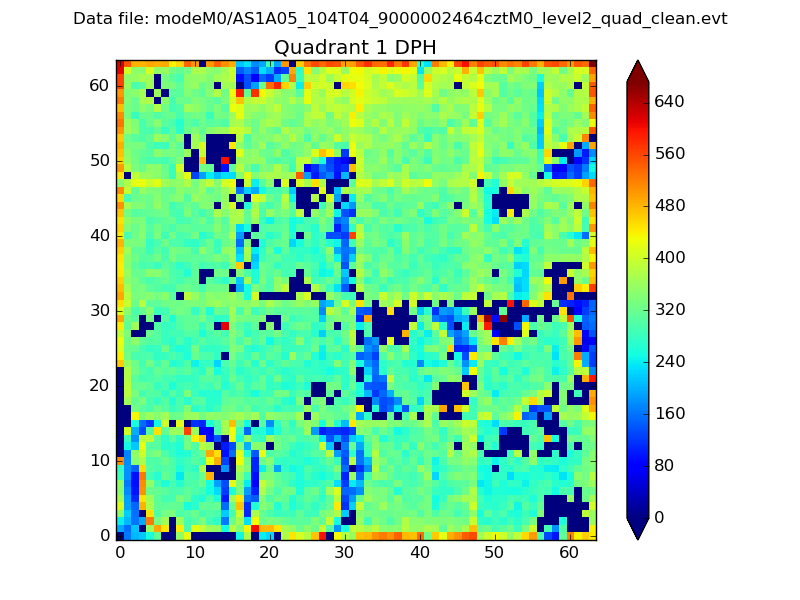 |
Quadrant B |
|---|---|---|---|
| Quadrant D |  |
 |
Quadrant C |
| Plot type | Count rate plots | Images |
|---|---|---|
| Comparison with Poisson distribution Blue bars denote a histogram of data divided into 1 sec bins. Red curve is a Poisson curve with rate = median count rate of data. |
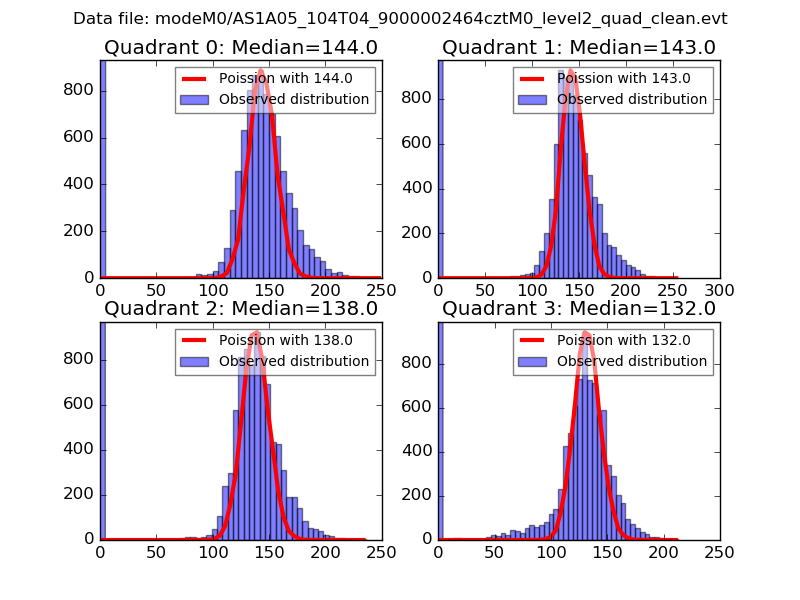 |
 |
| Quadrant-wise count rates Data is divided into 100 sec bins |
 |
|
| Module-wise count rates for Quadrant A Data is divided into 100 sec bins |
 |
 |
| Module-wise count rates for Quadrant B Data is divided into 100 sec bins |
 |
 |
| Module-wise count rates for Quadrant C Data is divided into 100 sec bins |
 |
 |
| Module-wise count rates for Quadrant D Data is divided into 100 sec bins |
 |
 |
| Parameter | Plot |
|---|---|
| CZT HV Monitor |  |
| D_VDD |  |
| Temperature 1 |  |
| Veto HV Monitor |  |
| Veto LLD |  |
| Alpha Counter |  |
| _CPM_Rate |  |
| CZT Counter |  |
| +2.5 Volts monitor |  |
| +5 Volts monitor |  |
| _ROLL_ROT |  |
| _Roll_DEC | 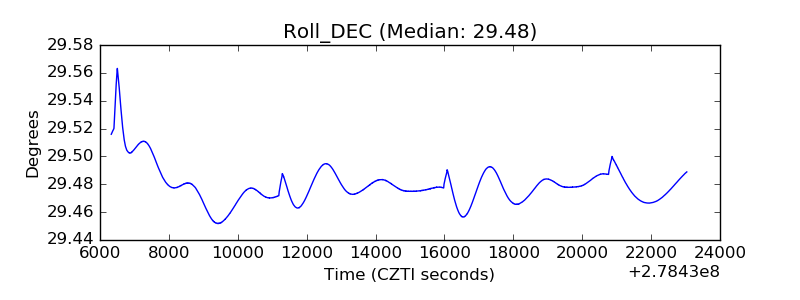 |
| _Roll_RA | 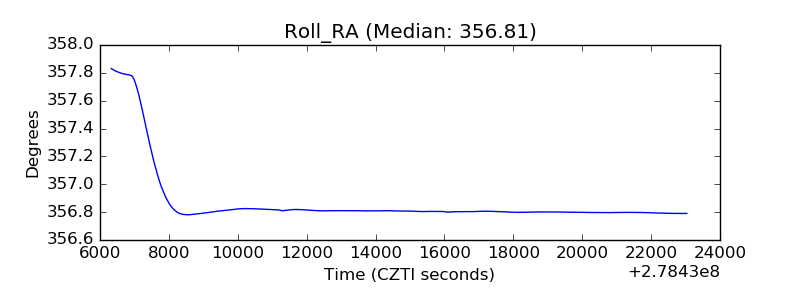 |
| Veto Counter |  |