| Param | Original file | Final file |
|---|---|---|
| Filename | modeM0/AS1A05_104T04_9000002464_16674cztM0_level2.evt | modeM0/AS1A05_104T04_9000002464_16674cztM0_level2_quad_clean.evt |
| Size (bytes) | 243,576,000 | 40,196,160 |
| Size | 232.3 MB | 38.3 MB |
| Events in quadrant A | 1,510,277 | 271,729 |
| Events in quadrant B | 1,636,367 | 272,719 |
| Events in quadrant C | 1,508,120 | 255,553 |
| Events in quadrant D | 2,540,794 | 227,460 |
| Mode M9 | |||
|---|---|---|---|
| Quadrant | BADHDUFLAG | Total packets | Discarded packets |
| A | 0 | 13 | 0 |
| B | 0 | 13 | 0 |
| C | 0 | 13 | 0 |
| D | 0 | 13 | 0 |
| Mode M0 | |||
|---|---|---|---|
| Quadrant | BADHDUFLAG | Total packets | Discarded packets |
| A | 0 | 6144 | 2 |
| B | 0 | 6710 | 1 |
| C | 0 | 6057 | 1 |
| D | 0 | 9471 | 1 |
| Mode SS | |||
|---|---|---|---|
| Quadrant | BADHDUFLAG | Total packets | Discarded packets |
| A | 0 | 54 | 0 |
| B | 0 | 54 | 0 |
| C | 0 | 54 | 0 |
| D | 0 | 54 | 0 |
| Quadrant | Total seconds | Saturated seconds | Saturation percentage |
|---|---|---|---|
| A | 2645 | 133 | 5.028355% |
| B | 2645 | 140 | 5.293006% |
| C | 2645 | 145 | 5.482042% |
| D | 2645 | 452 | 17.088847% |
Noise dominated data is calculated using 1-second bins in cleaned event files. If a bin has >2000 counts, and if more than 50% of those come from <1% of pixels, then it is considered to be noise-dominated and hence unusable.
| Quadrant | # 1 sec bins | Bins with >0 counts | Bins with >2000 counts | High rate bins dominated by noise | Noise dominated (total time) | Noise dominated (detector-on time) | Marked lightcurve |
|---|---|---|---|---|---|---|---|
| A | 3936 | 2647 | 0 | 0 | 0.00% | 0.00% | 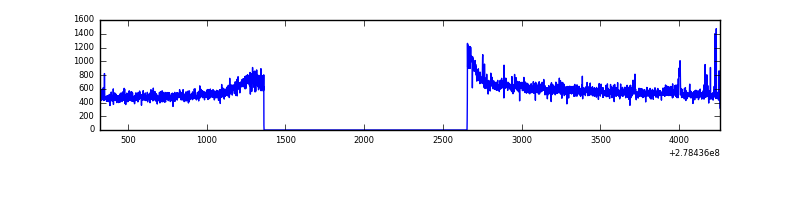 |
| B | 3936 | 2647 | 1 | 1 | 0.03% | 0.04% | 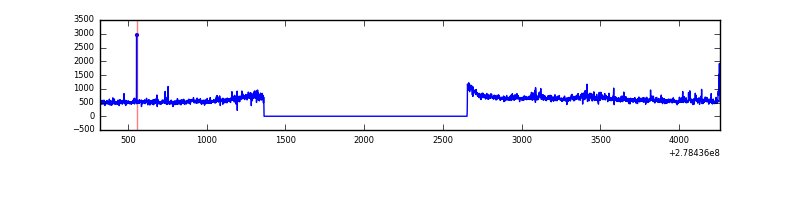 |
| C | 3936 | 2647 | 0 | 0 | 0.00% | 0.00% | 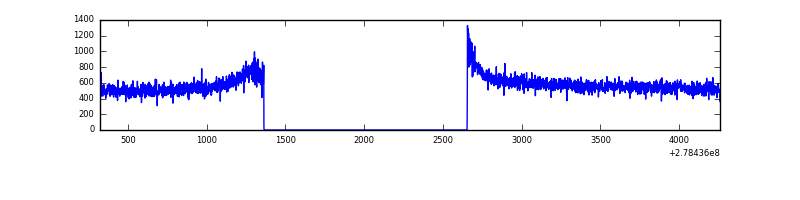 |
| D | 3936 | 2647 | 223 | 223 | 5.67% | 8.42% | 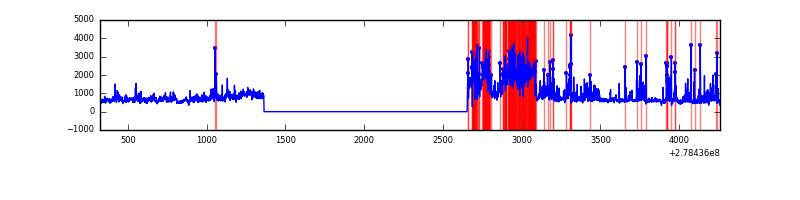 |
Top three noisy pixels from each quadrant. If the there are fewer than three noisy pixels in the level2.evt file, extra rows are filled as -1
| Pixel properties | Quadrant properties | ||||||
|---|---|---|---|---|---|---|---|
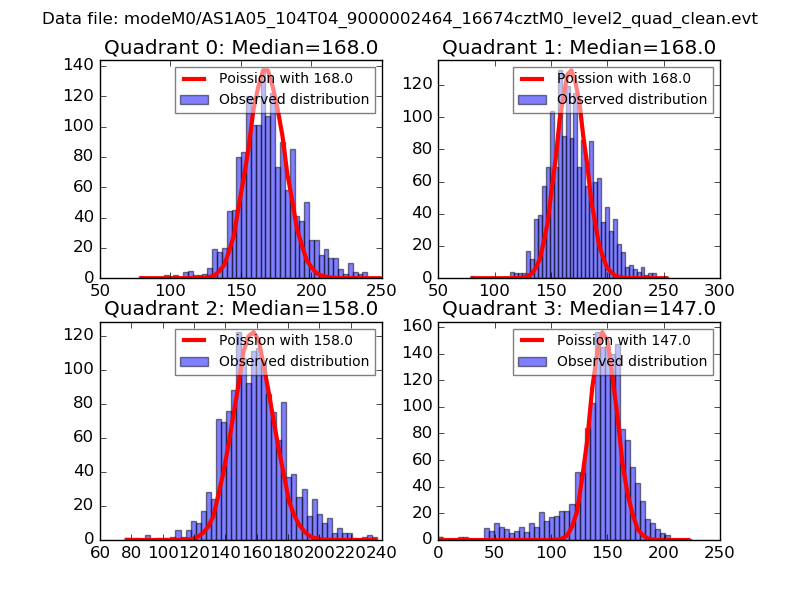
| Quadrant | DetID | PixID | Counts | Sigma | Mean | Median | Sigma |
| A | 3 | 1 | 9822 | 118.84 | 388 | 380 | 79.5 |
| A | 12 | 96 | 6231 | 73.64 | 388 | 380 | 79.5 |
| A | 0 | 226 | 3513 | 39.43 | 388 | 380 | 79.5 |
| B | 0 | 229 | 91326 | 1226.6 | 382 | 374 | 74.1 |
| B | 15 | 35 | 30005 | 399.61 | 382 | 374 | 74.1 |
| B | 0 | 189 | 8191 | 105.42 | 382 | 374 | 74.1 |
| C | 14 | 238 | 57239 | 665.67 | 363 | 368 | 85.4 |
| C | 3 | 233 | 33294 | 385.39 | 363 | 368 | 85.4 |
| C | 13 | 61 | 2610 | 26.24 | 363 | 368 | 85.4 |
| D | 2 | 16 | 632738 | 7331.82 | 354 | 344 | 86.3 |
| D | 1 | 52 | 393601 | 4559.33 | 354 | 344 | 86.3 |
| D | 10 | 70 | 144414 | 1670.31 | 354 | 344 | 86.3 |
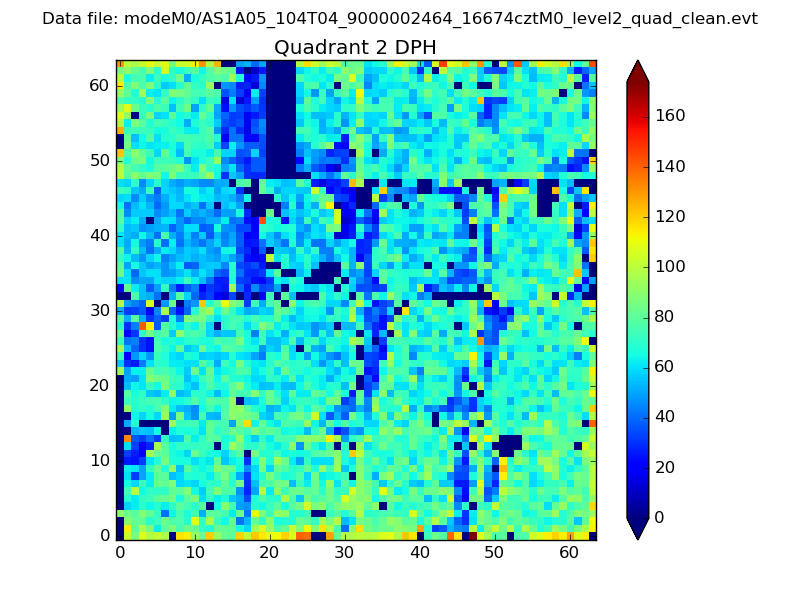
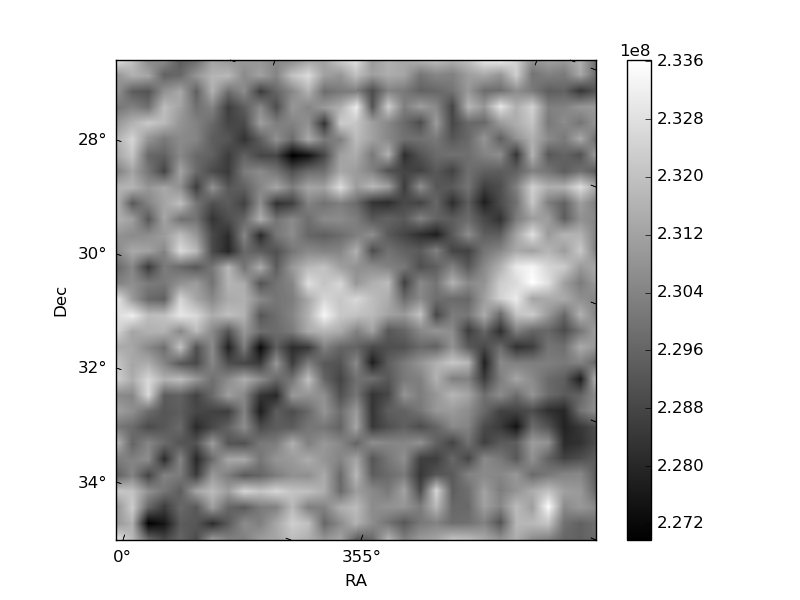
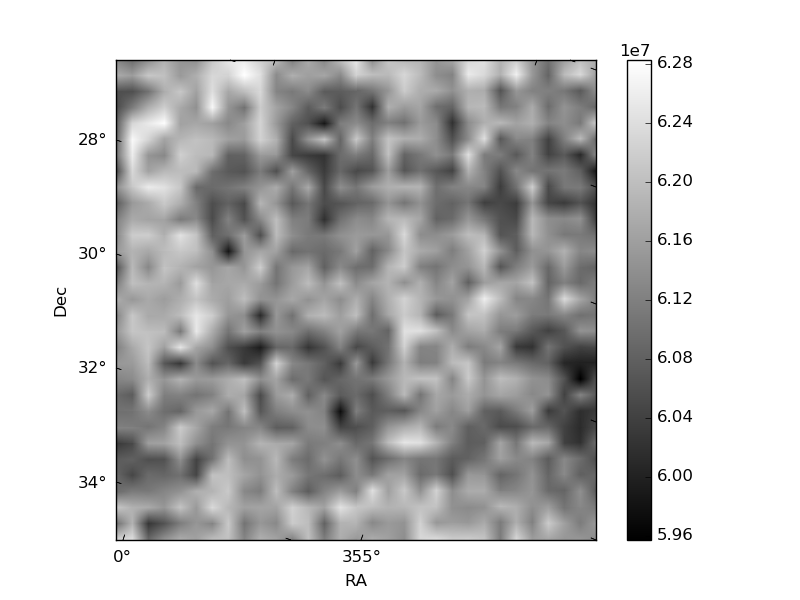
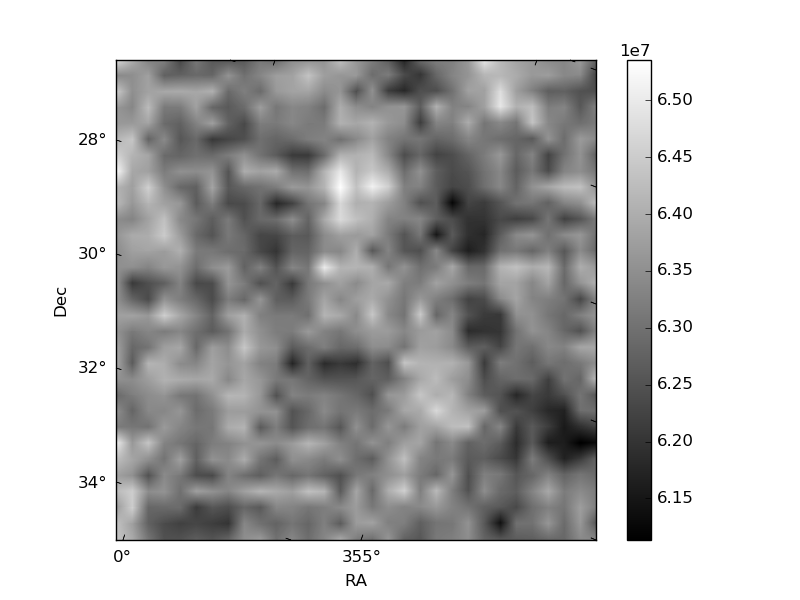
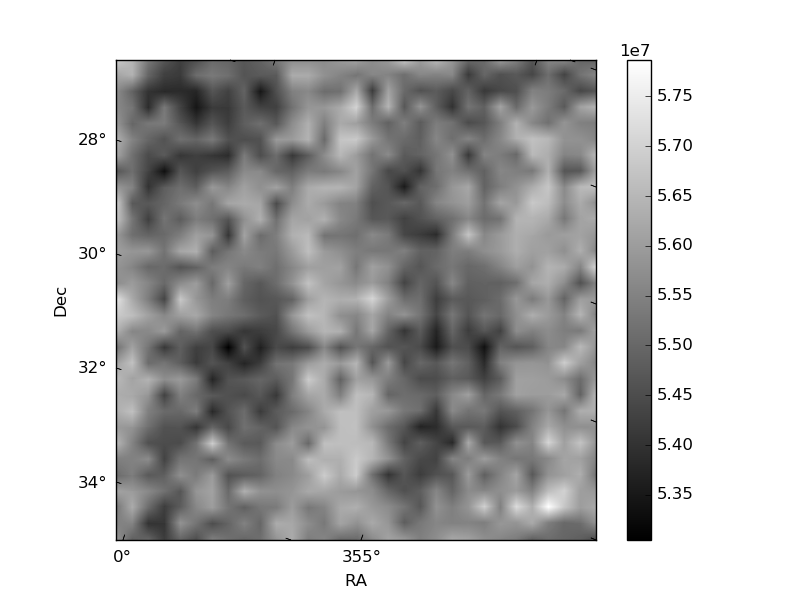
Histogram calculated using DETX and DETY for each event in the final _common_clean file
| Quadrant A | 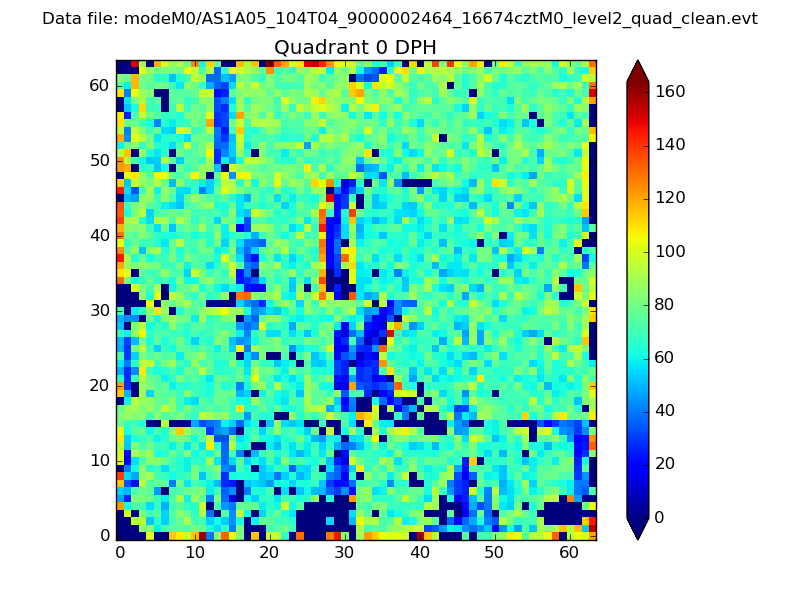 |
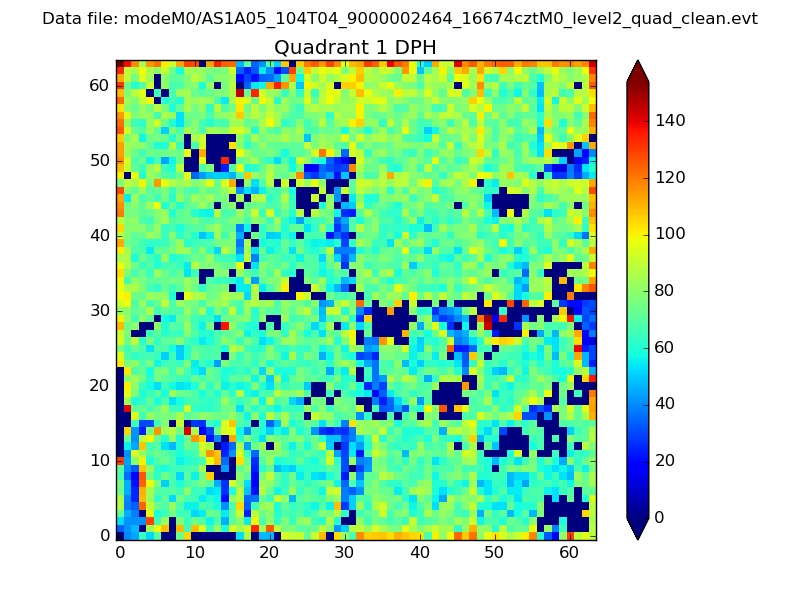 |
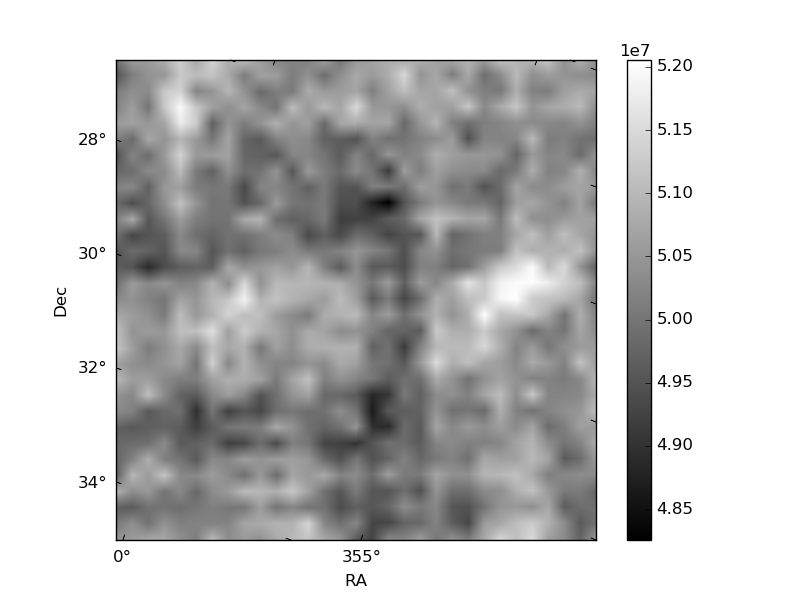
Quadrant B |
|---|---|---|---|
| Quadrant D | 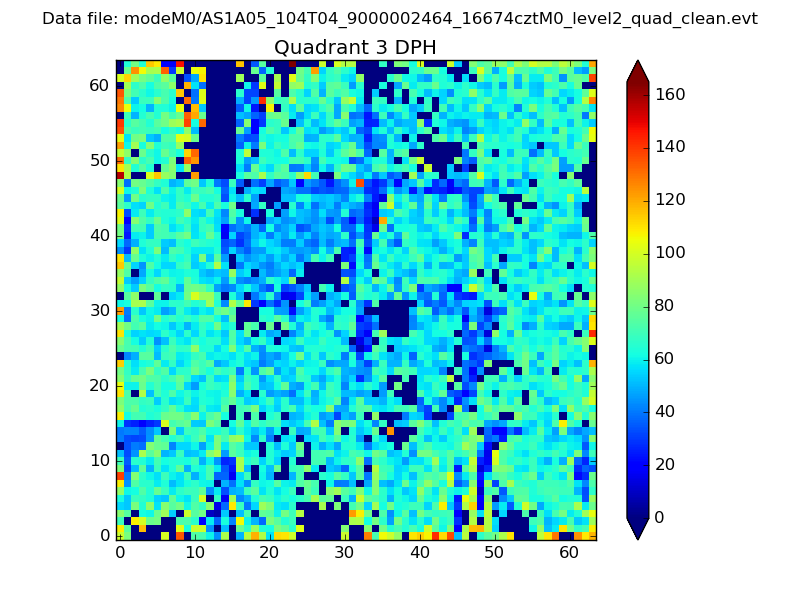 |
 |
Quadrant C |
| Plot type | Count rate plots | Images |
|---|---|---|
| Comparison with Poisson distribution Blue bars denote a histogram of data divided into 1 sec bins. Red curve is a Poisson curve with rate = median count rate of data. |
 |
 |
| Quadrant-wise count rates Data is divided into 100 sec bins |
 |
|
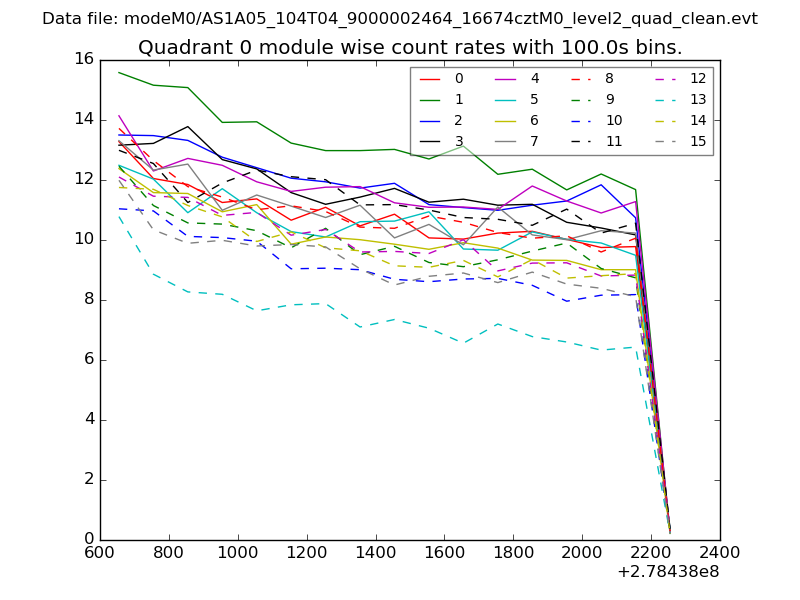
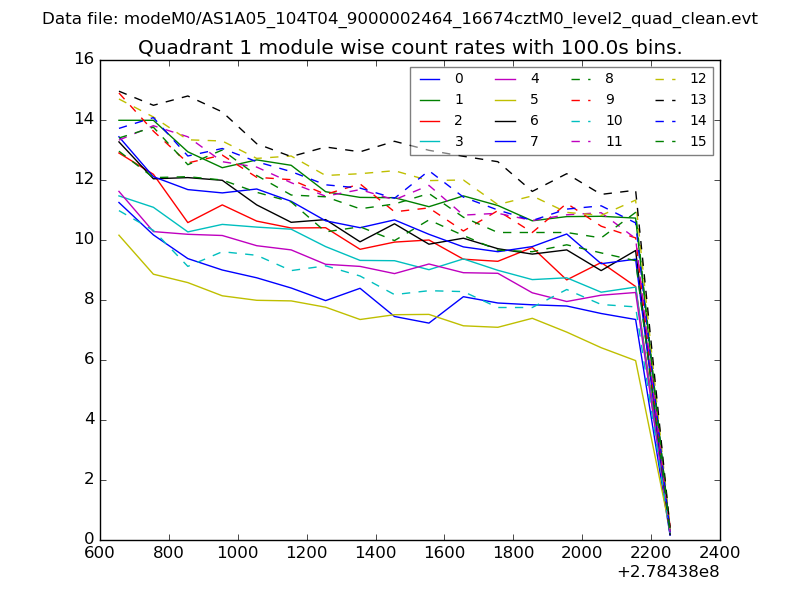
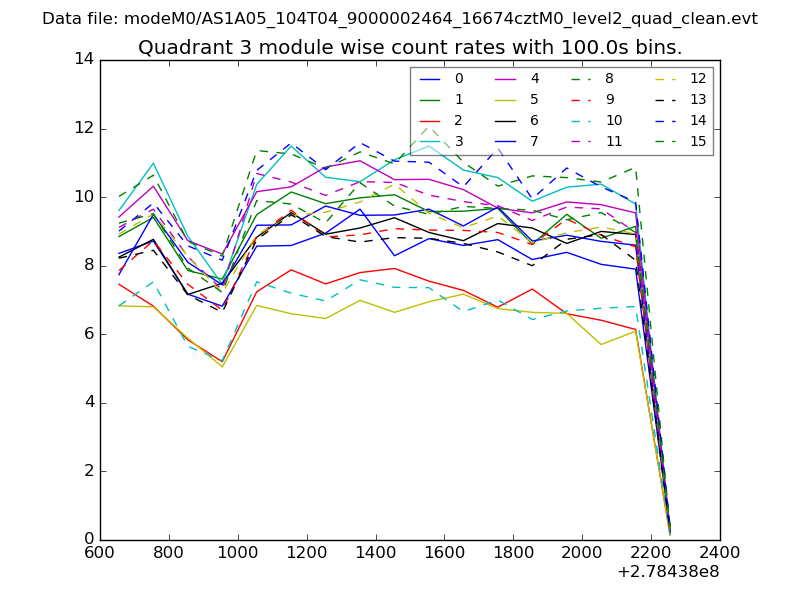
| Module-wise count rates for Quadrant A Data is divided into 100 sec bins |
 |
 |
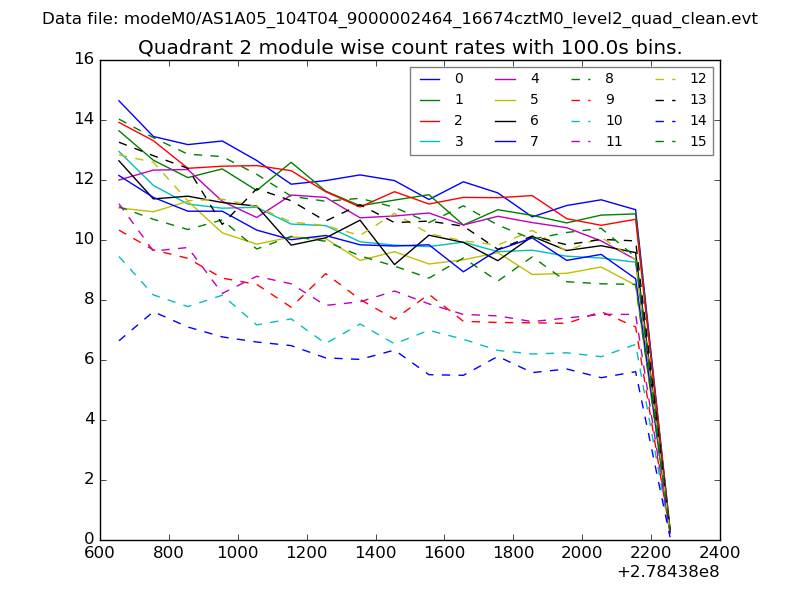
| Module-wise count rates for Quadrant B Data is divided into 100 sec bins |
 |
 |
| Module-wise count rates for Quadrant C Data is divided into 100 sec bins |
 |
 |
| Module-wise count rates for Quadrant D Data is divided into 100 sec bins |
 |
 |
| Parameter | Plot |
|---|---|
| CZT HV Monitor | 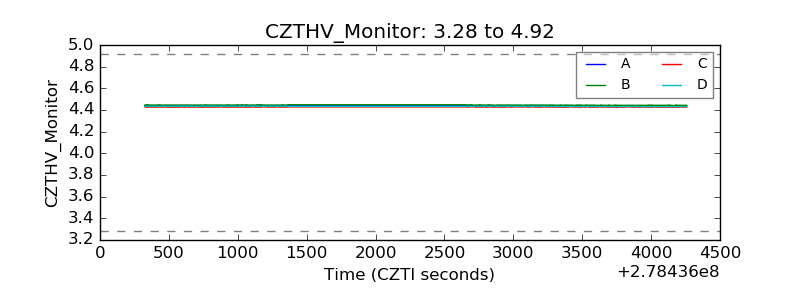 |
| D_VDD | 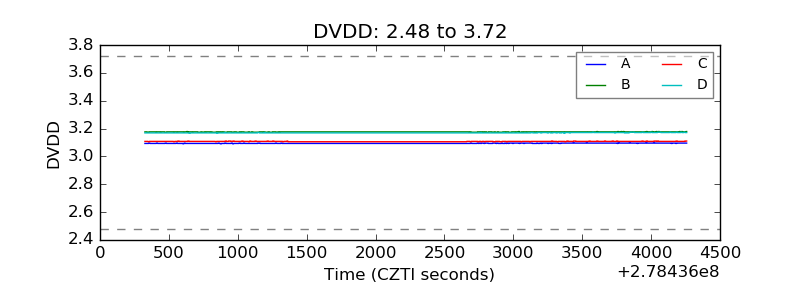 |
| Temperature 1 | 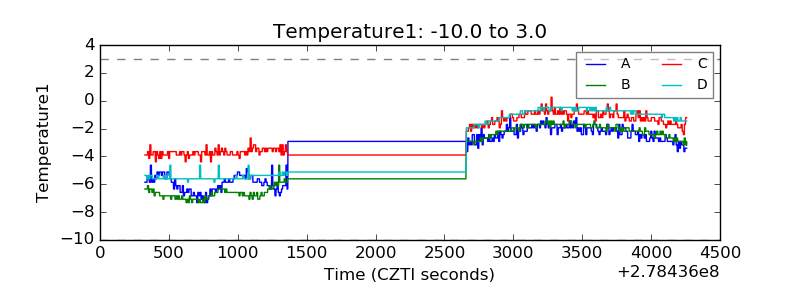 |
| Veto HV Monitor | 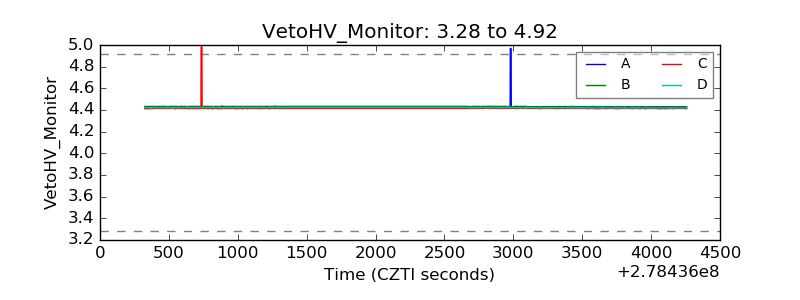 |
| Veto LLD | 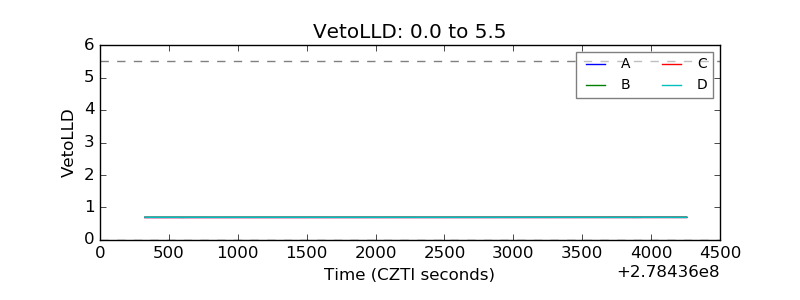 |
| Alpha Counter | 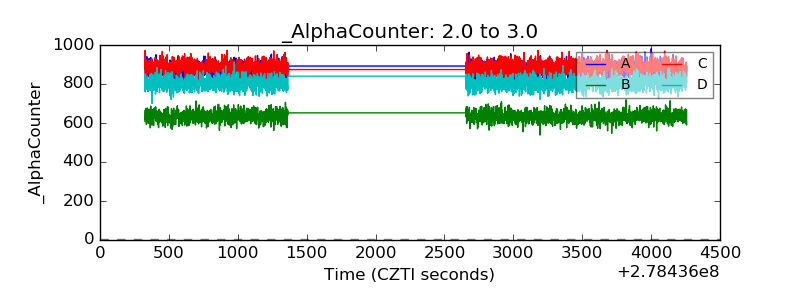 |
| _CPM_Rate | 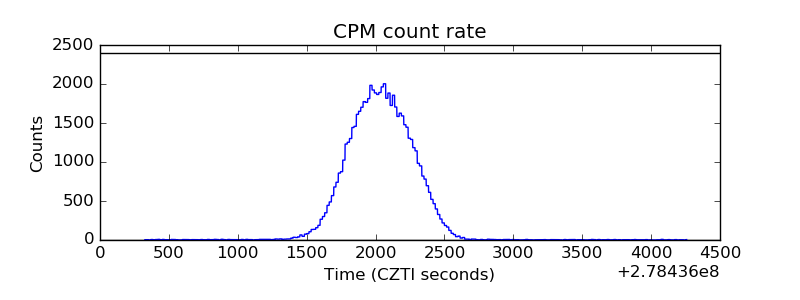 |
| CZT Counter | 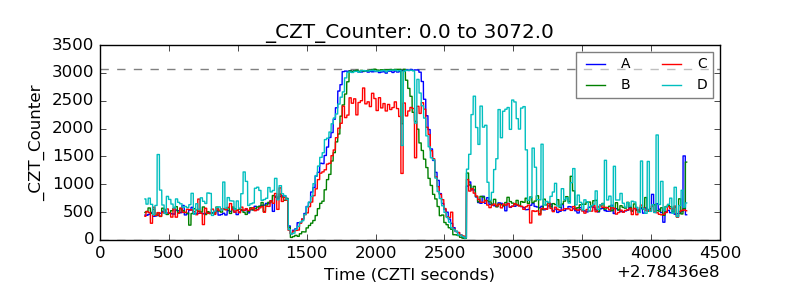 |
| +2.5 Volts monitor |  |
| +5 Volts monitor |  |
| _ROLL_ROT | 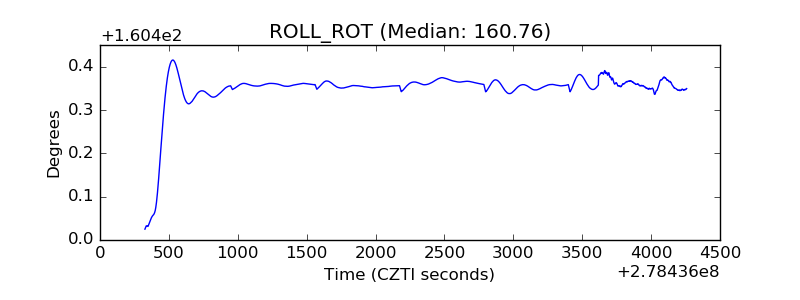 |
| _Roll_DEC | 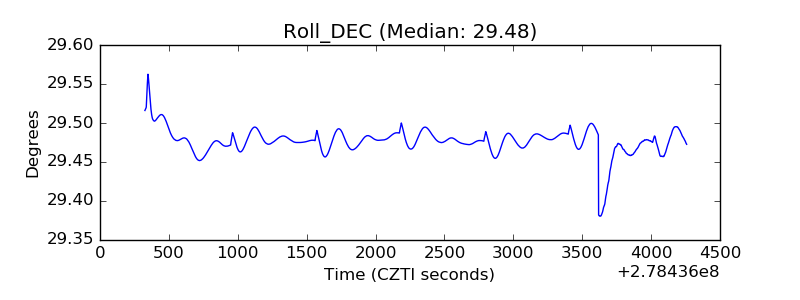 |
| _Roll_RA | 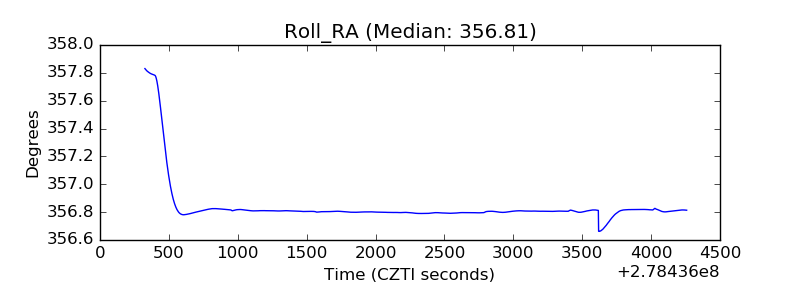 |
| Veto Counter | 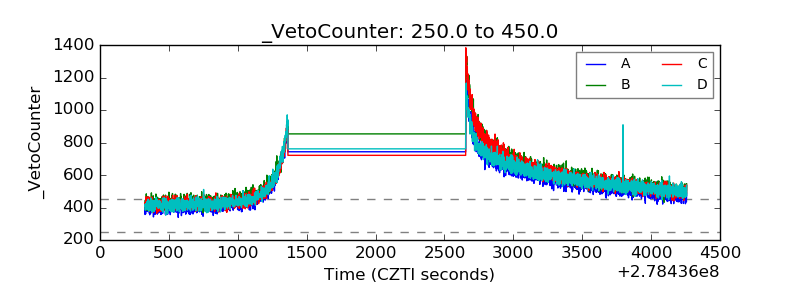 |