| Param | Original file | Final file |
|---|---|---|
| Filename | modeM0/AS1A05_104T04_9000002464_16675cztM0_level2.evt | modeM0/AS1A05_104T04_9000002464_16675cztM0_level2_quad_clean.evt |
| Size (bytes) | 566,265,600 | 110,139,840 |
| Size | 540.0 MB | 105.0 MB |
| Events in quadrant A | 3,414,397 | 754,903 |
| Events in quadrant B | 3,896,527 | 755,713 |
| Events in quadrant C | 3,431,563 | 718,149 |
| Events in quadrant D | 5,966,539 | 653,633 |
| Mode M9 | |||
|---|---|---|---|
| Quadrant | BADHDUFLAG | Total packets | Discarded packets |
| A | 0 | 17 | 0 |
| B | 0 | 17 | 0 |
| C | 0 | 17 | 0 |
| D | 0 | 18 | 0 |
| Mode M0 | |||
|---|---|---|---|
| Quadrant | BADHDUFLAG | Total packets | Discarded packets |
| A | 0 | 14207 | 3 |
| B | 0 | 15790 | 2 |
| C | 0 | 14096 | 2 |
| D | 0 | 22034 | 2 |
| Mode SS | |||
|---|---|---|---|
| Quadrant | BADHDUFLAG | Total packets | Discarded packets |
| A | 0 | 132 | 0 |
| B | 0 | 132 | 0 |
| C | 0 | 132 | 0 |
| D | 0 | 132 | 0 |
| Quadrant | Total seconds | Saturated seconds | Saturation percentage |
|---|---|---|---|
| A | 6494 | 155 | 2.386819% |
| B | 6494 | 171 | 2.633200% |
| C | 6494 | 181 | 2.787188% |
| D | 6494 | 978 | 15.060055% |
Noise dominated data is calculated using 1-second bins in cleaned event files. If a bin has >2000 counts, and if more than 50% of those come from <1% of pixels, then it is considered to be noise-dominated and hence unusable.
| Quadrant | # 1 sec bins | Bins with >0 counts | Bins with >2000 counts | High rate bins dominated by noise | Noise dominated (total time) | Noise dominated (detector-on time) | Marked lightcurve |
|---|---|---|---|---|---|---|---|
| A | 7785 | 6496 | 0 | 0 | 0.00% | 0.00% | 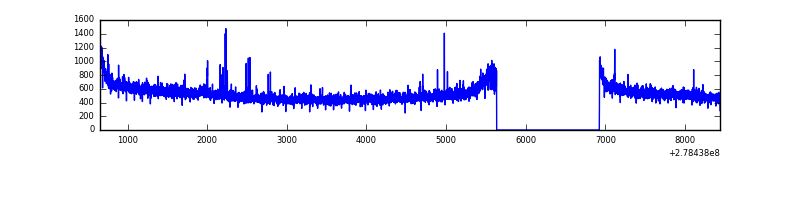 |
| B | 7785 | 6496 | 12 | 12 | 0.15% | 0.18% | 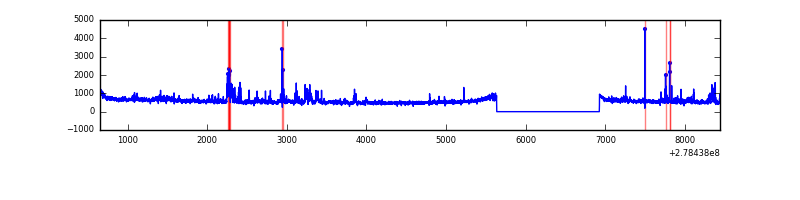 |
| C | 7785 | 6496 | 0 | 0 | 0.00% | 0.00% | 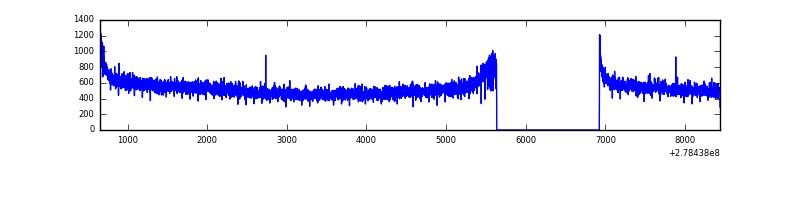 |
| D | 7785 | 6496 | 651 | 651 | 8.36% | 10.02% | 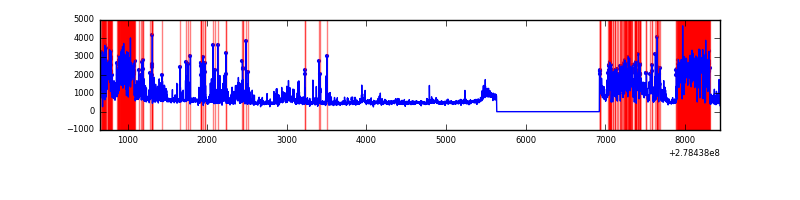 |
Top three noisy pixels from each quadrant. If the there are fewer than three noisy pixels in the level2.evt file, extra rows are filled as -1
| Pixel properties | Quadrant properties | ||||||
|---|---|---|---|---|---|---|---|
| Quadrant | DetID | PixID | Counts | Sigma | Mean | Median | Sigma |
| A | 3 | 1 | 24521 | 135.49 | 877 | 862 | 174.6 |
| A | 9 | 143 | 8862 | 45.82 | 877 | 862 | 174.6 |
| A | 0 | 226 | 8041 | 41.11 | 877 | 862 | 174.6 |
| B | 15 | 35 | 217453 | 1338.02 | 868 | 849 | 161.9 |
| B | 0 | 229 | 187860 | 1155.21 | 868 | 849 | 161.9 |
| B | 0 | 189 | 30252 | 181.63 | 868 | 849 | 161.9 |
| C | 14 | 238 | 130302 | 675.74 | 829 | 838 | 191.6 |
| C | 3 | 233 | 65733 | 338.72 | 829 | 838 | 191.6 |
| C | 13 | 61 | 5930 | 26.58 | 829 | 838 | 191.6 |
| D | 2 | 16 | 1981286 | 10070.96 | 815 | 794 | 196.7 |
| D | 1 | 52 | 606261 | 3078.85 | 815 | 794 | 196.7 |
| D | 10 | 70 | 180427 | 913.45 | 815 | 794 | 196.7 |
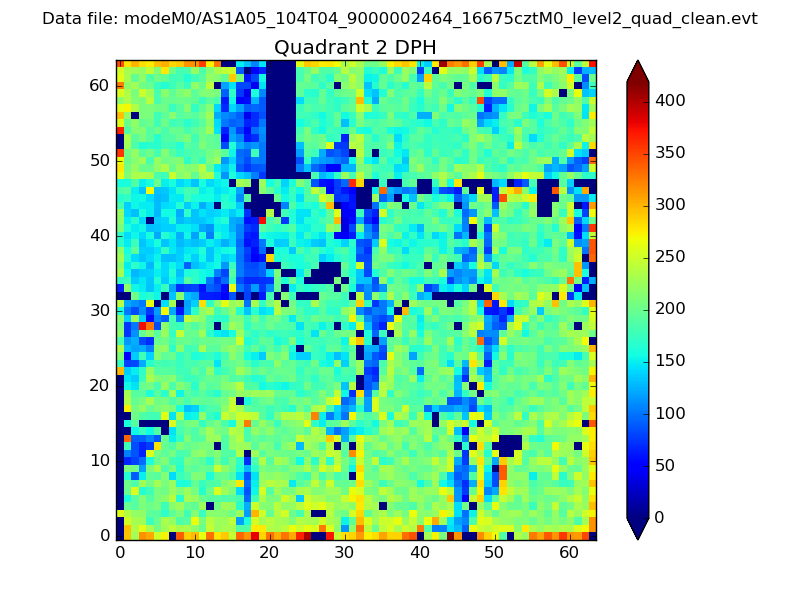
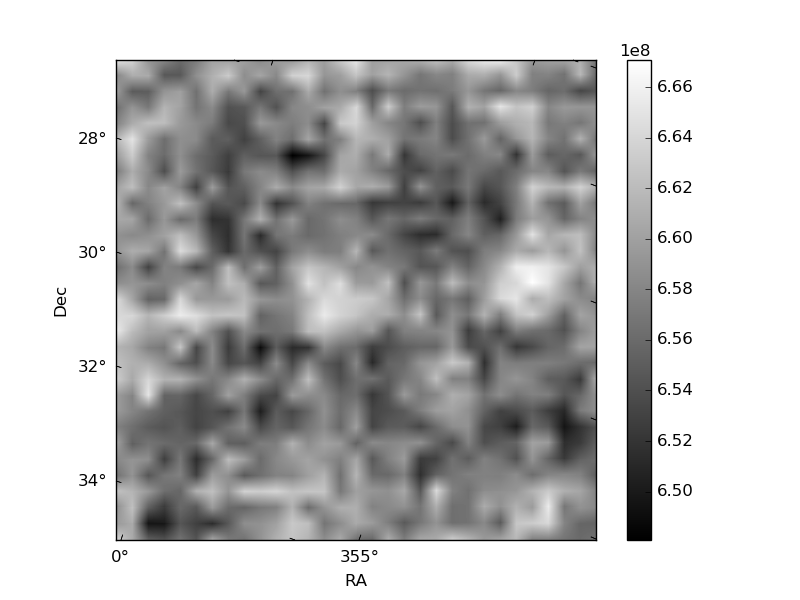
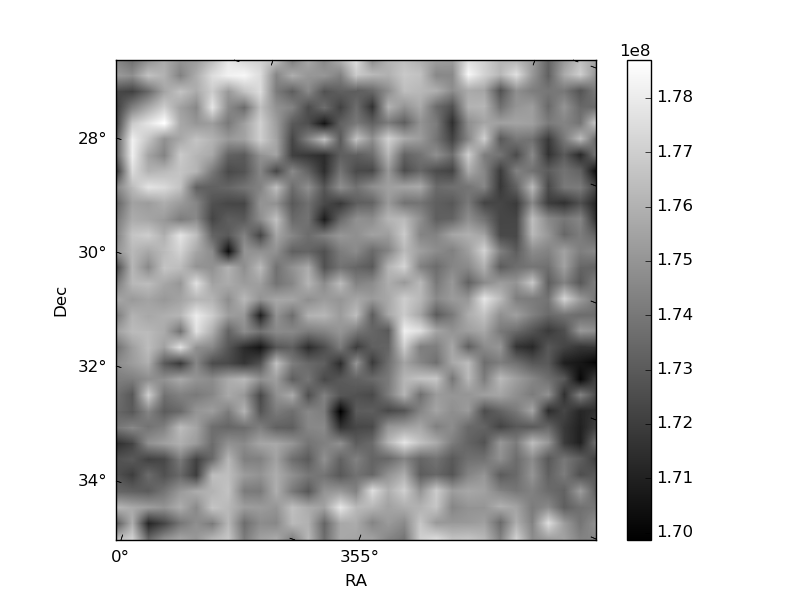
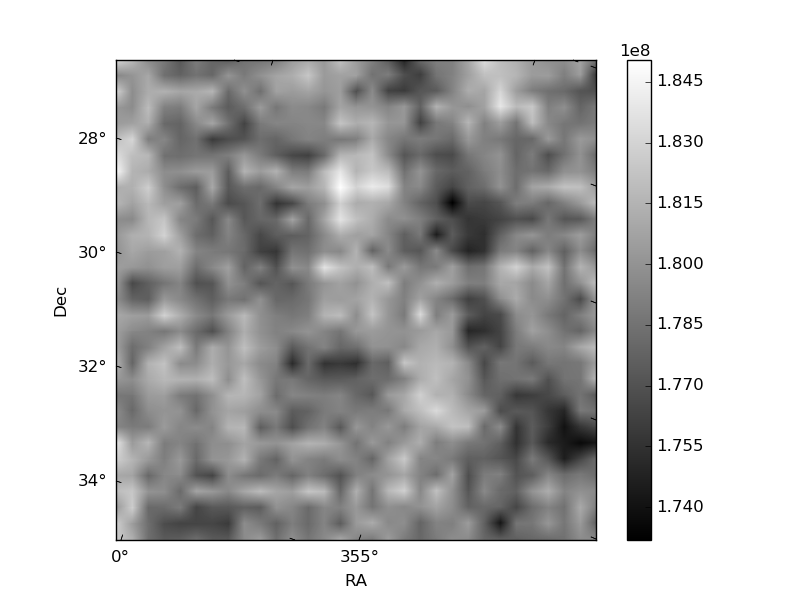
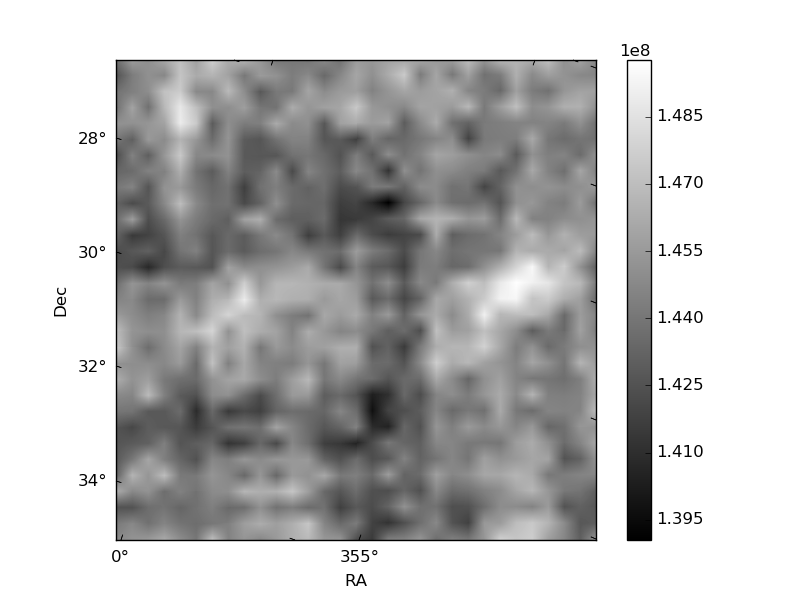
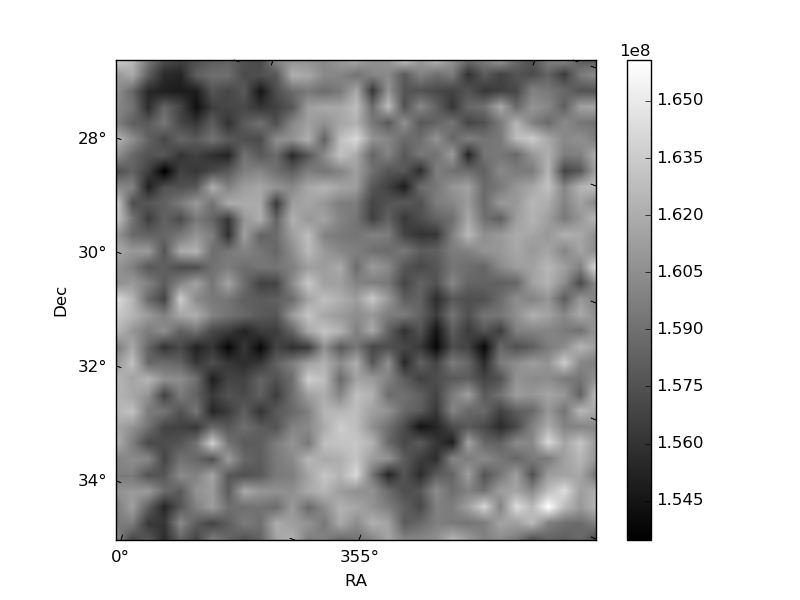
Histogram calculated using DETX and DETY for each event in the final _common_clean file
| Quadrant A | 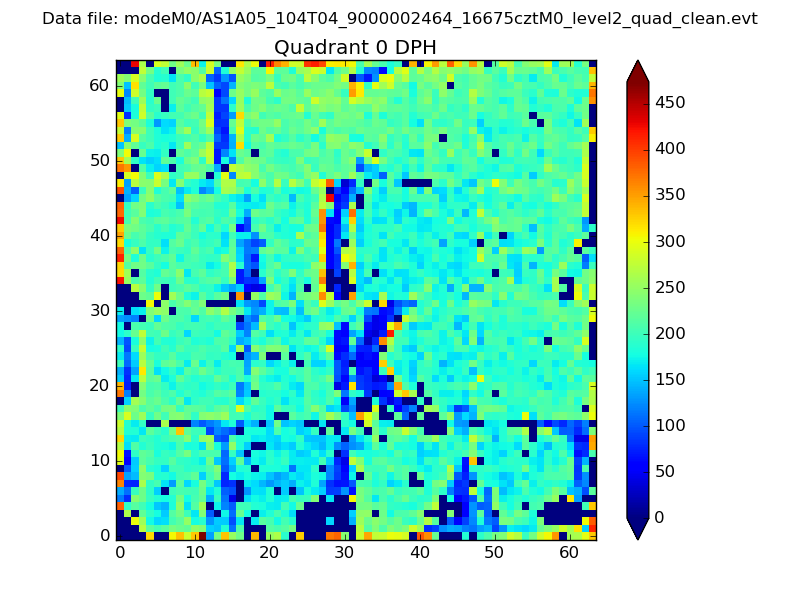 |
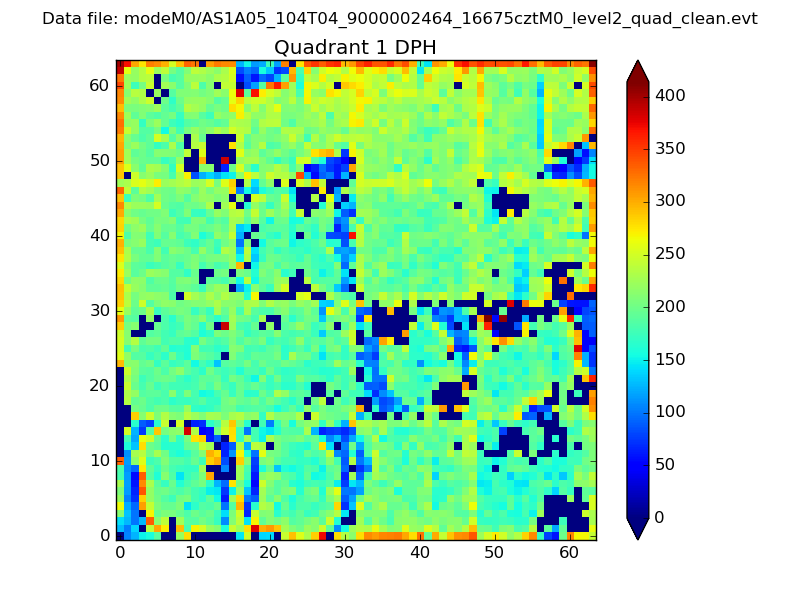 |
Quadrant B |
|---|---|---|---|
| Quadrant D | 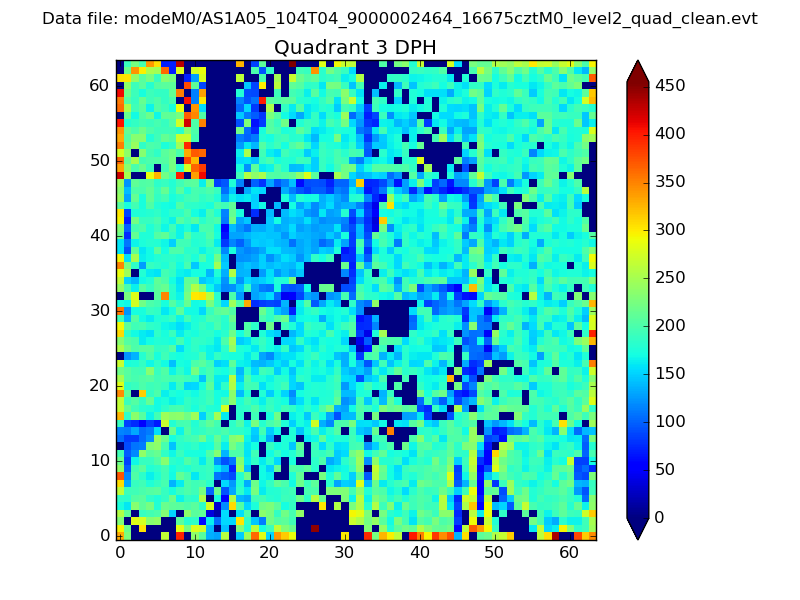 |
 |
Quadrant C |
| Plot type | Count rate plots | Images |
|---|---|---|
| Comparison with Poisson distribution Blue bars denote a histogram of data divided into 1 sec bins. Red curve is a Poisson curve with rate = median count rate of data. |
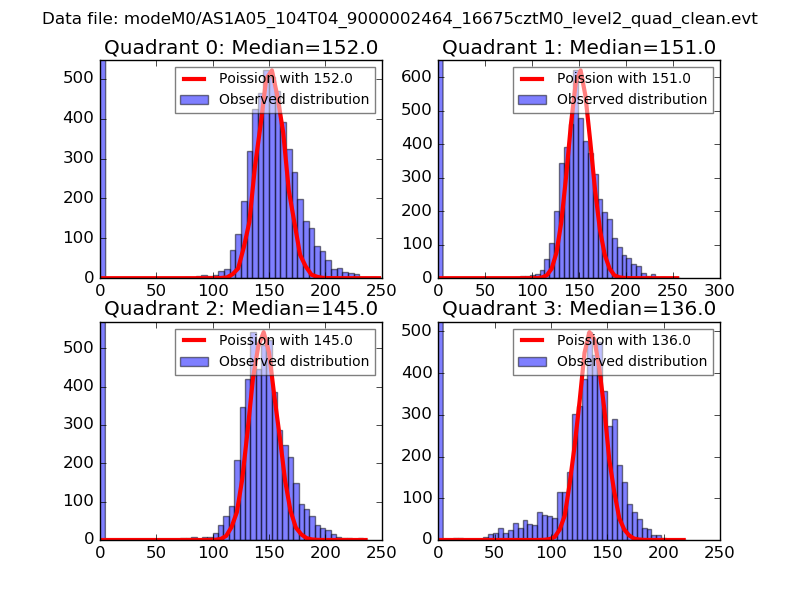 |
 |
| Quadrant-wise count rates Data is divided into 100 sec bins |
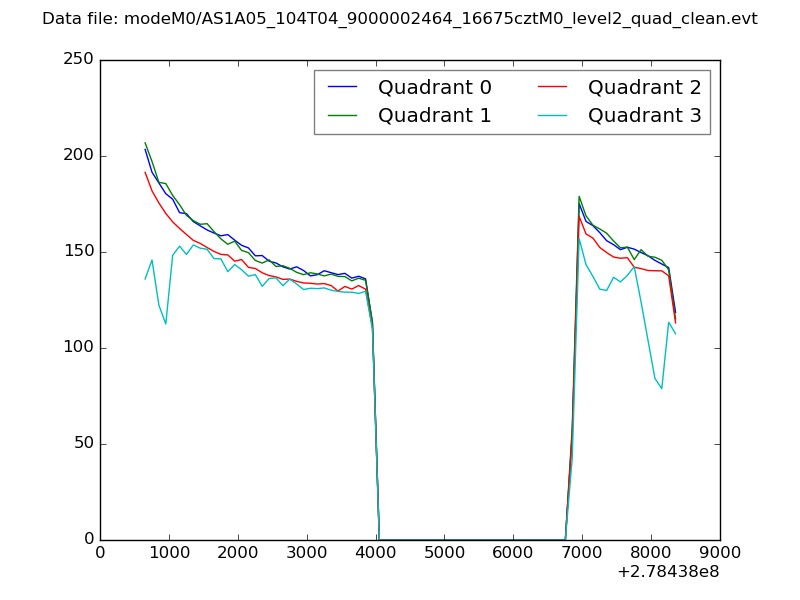 |
|
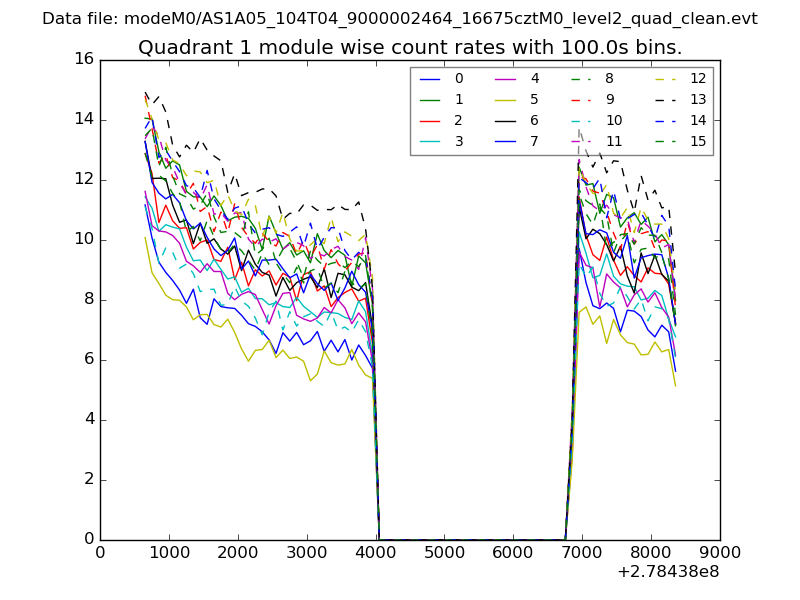
| Module-wise count rates for Quadrant A Data is divided into 100 sec bins |
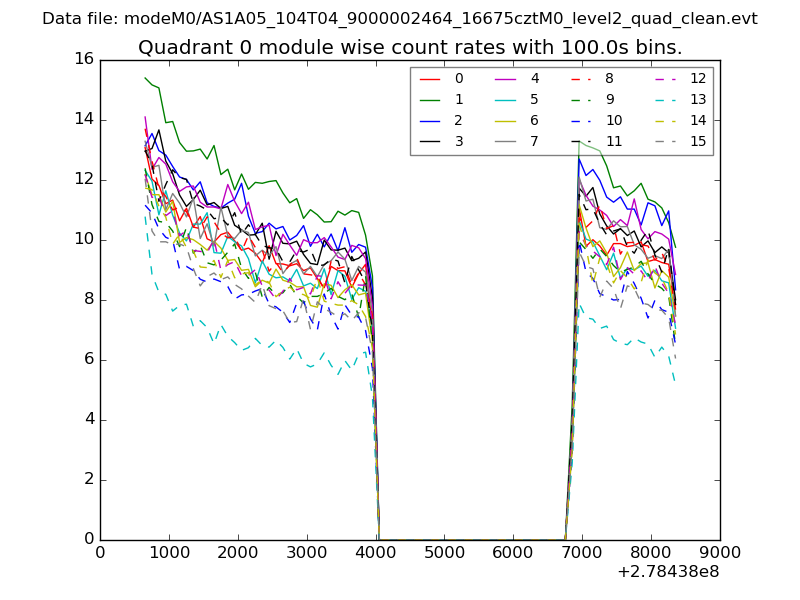 |
 |
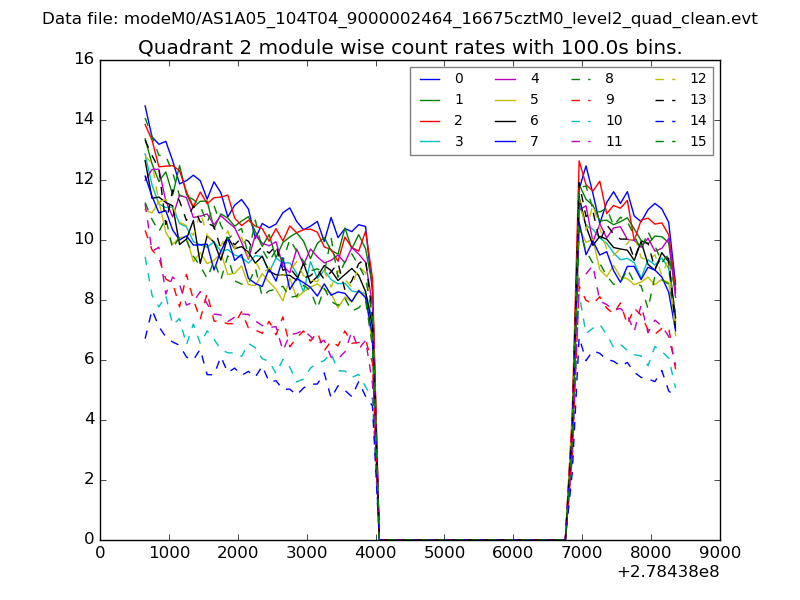
| Module-wise count rates for Quadrant B Data is divided into 100 sec bins |
 |
 |
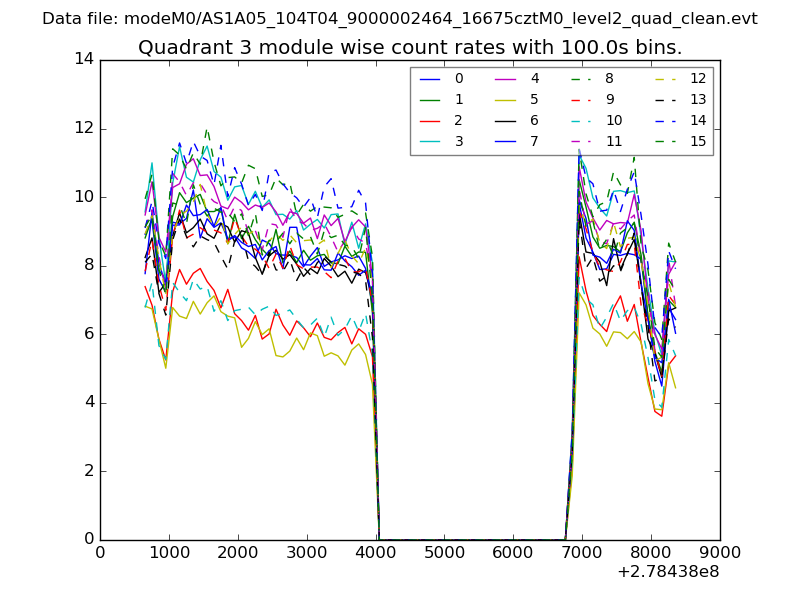
| Module-wise count rates for Quadrant C Data is divided into 100 sec bins |
 |
 |
| Module-wise count rates for Quadrant D Data is divided into 100 sec bins |
 |
 |
| Parameter | Plot |
|---|---|
| CZT HV Monitor | 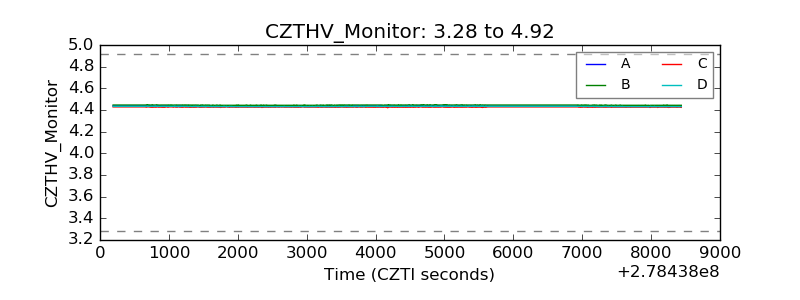 |
| D_VDD | 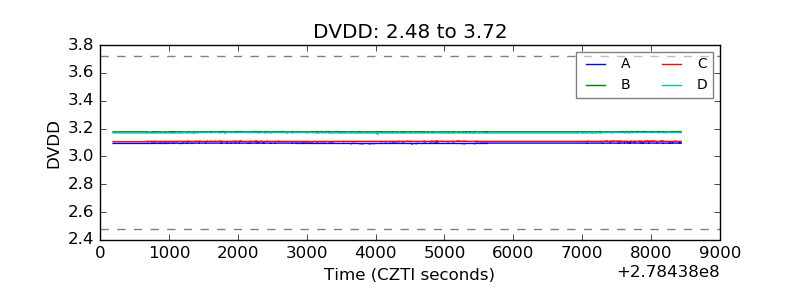 |
| Temperature 1 | 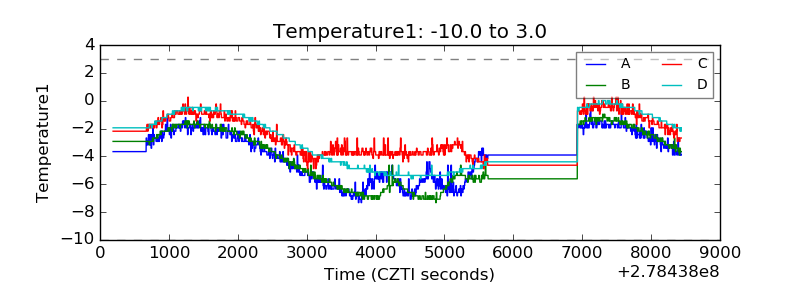 |
| Veto HV Monitor | 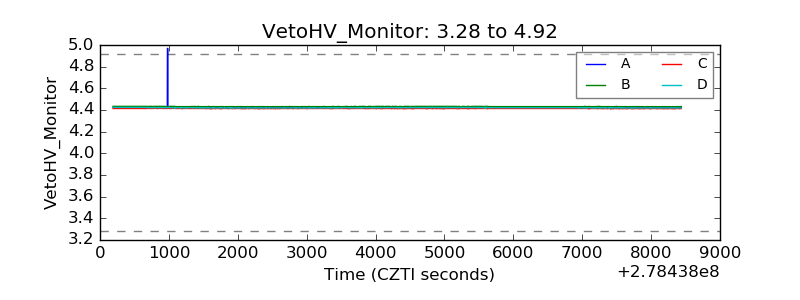 |
| Veto LLD | 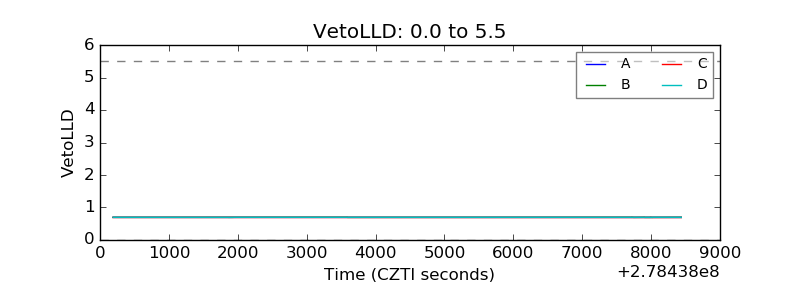 |
| Alpha Counter | 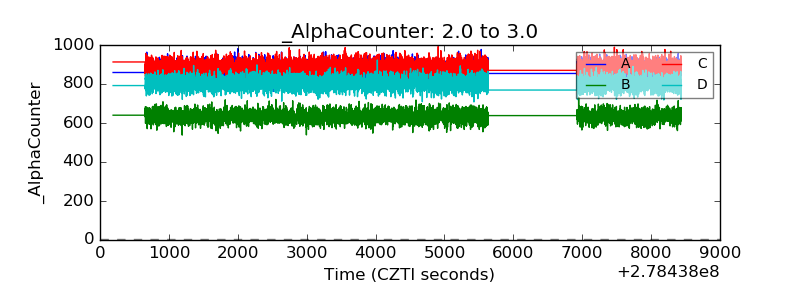 |
| _CPM_Rate | 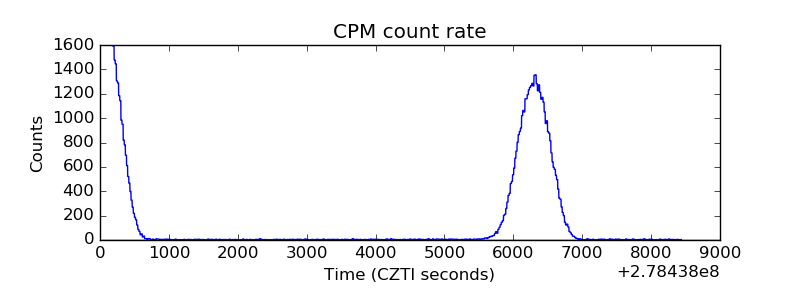 |
| CZT Counter | 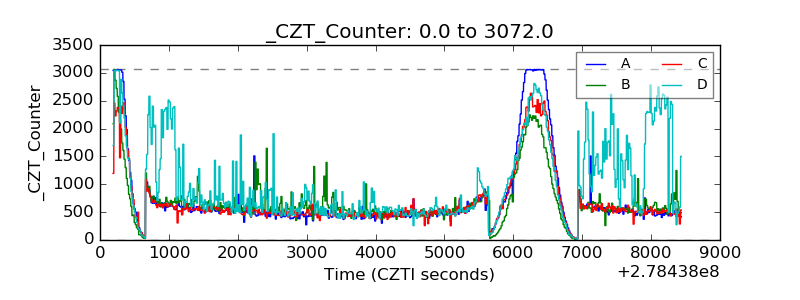 |
| +2.5 Volts monitor | 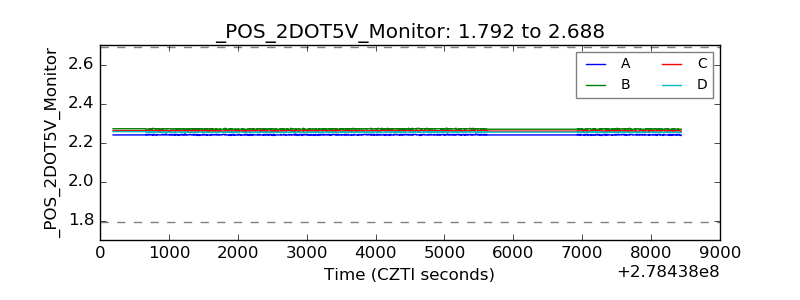 |
| +5 Volts monitor | 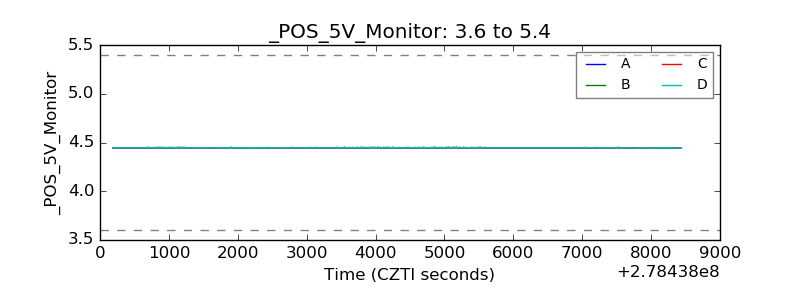 |
| _ROLL_ROT | 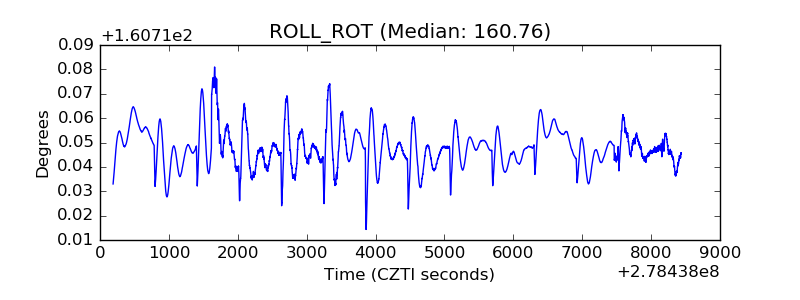 |
| _Roll_DEC | 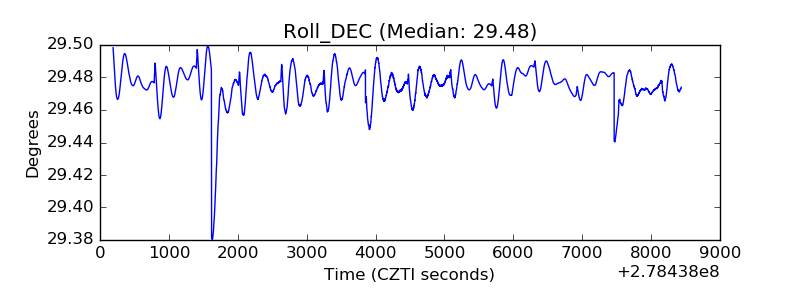 |
| _Roll_RA |  |
| Veto Counter | 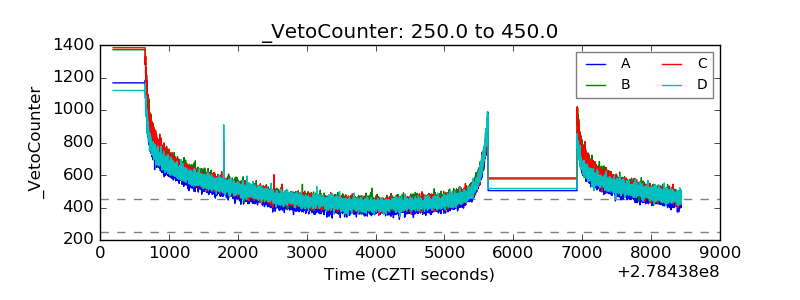 |