| Param | Original file | Final file |
|---|---|---|
| Filename | modeM0/AS1A05_012T02_9000002468cztM0_level2.fits | modeM0/AS1A05_012T02_9000002468cztM0_level2_quad_clean.evt |
| Size (bytes) | 426,360,960 | 341,737,920 |
| Size | 406.6 MB | 325.9 MB |
| Events in quadrant A | 2,581,124 | 1,841,400 |
| Events in quadrant B | 2,553,718 | 1,968,390 |
| Events in quadrant C | 2,628,284 | 1,903,425 |
| Events in quadrant D | 2,125,550 | 1,615,241 |
| Mode M0 | |||
|---|---|---|---|
| Quadrant | BADHDUFLAG | Total packets | Discarded packets |
| A | 0 | 125326 | 0 |
| B | 0 | 97609 | 0 |
| C | 0 | 91518 | 0 |
| D | 0 | 188171 | 0 |
| Mode M9 | |||
|---|---|---|---|
| Quadrant | BADHDUFLAG | Total packets | Discarded packets |
| A | 0 | 83 | 0 |
| B | 0 | 83 | 0 |
| C | 0 | 83 | 0 |
| D | 0 | 83 | 0 |
| Mode SS | |||
|---|---|---|---|
| Quadrant | BADHDUFLAG | Total packets | Discarded packets |
| A | 0 | 892 | 0 |
| B | 0 | 892 | 0 |
| C | 0 | 892 | 0 |
| D | 0 | 892 | 0 |
| Quadrant | Total seconds | Saturated seconds | Saturation percentage |
|---|---|---|---|
| A | 43997 | 3733 | 8.484669% |
| B | 43997 | 569 | 1.293270% |
| C | 43997 | 544 | 1.236448% |
| D | 43997 | 7087 | 16.107916% |
Noise dominated data is calculated using 1-second bins in cleaned event files. If a bin has >2000 counts, and if more than 50% of those come from <1% of pixels, then it is considered to be noise-dominated and hence unusable.
| Quadrant | # 1 sec bins | Bins with >0 counts | Bins with >2000 counts | High rate bins dominated by noise | Noise dominated (total time) | Noise dominated (detector-on time) | Marked lightcurve |
|---|---|---|---|---|---|---|---|
| A | 52132 | 43963 | 0 | 0 | 0.00% | 0.00% |  |
| B | 52132 | 43996 | 0 | 0 | 0.00% | 0.00% |  |
| C | 52132 | 43997 | 0 | 0 | 0.00% | 0.00% |  |
| D | 52132 | 43956 | 0 | 0 | 0.00% | 0.00% |  |
Top three noisy pixels from each quadrant. If the there are fewer than three noisy pixels in the level2.evt file, extra rows are filled as -1
| Pixel properties | Quadrant properties | ||||||
|---|---|---|---|---|---|---|---|
| Quadrant | DetID | PixID | Counts | Sigma | Mean | Median | Sigma |
| A | 0 | 29 | 2486 | 11.21 | 672 | 633 | 165.4 |
| A | 7 | 110 | 2087 | 8.79 | 672 | 633 | 165.4 |
| A | 0 | 30 | 1992 | 8.22 | 672 | 633 | 165.4 |
| B | 2 | 9 | 2147 | 11.24 | 676 | 648 | 133.4 |
| B | 2 | 8 | 1784 | 8.52 | 676 | 648 | 133.4 |
| B | 3 | 17 | 1669 | 7.66 | 676 | 648 | 133.4 |
| C | 2 | 191 | 1805 | 6.52 | 694 | 651 | 177.0 |
| C | 3 | 126 | 1749 | 6.2 | 694 | 651 | 177.0 |
| C | 3 | 158 | 1740 | 6.15 | 694 | 651 | 177.0 |
| D | 3 | 14 | 1507 | 5.99 | 606 | 553 | 159.2 |
| D | 6 | 231 | 1498 | 5.94 | 606 | 553 | 159.2 |
| D | 6 | 67 | 1496 | 5.92 | 606 | 553 | 159.2 |
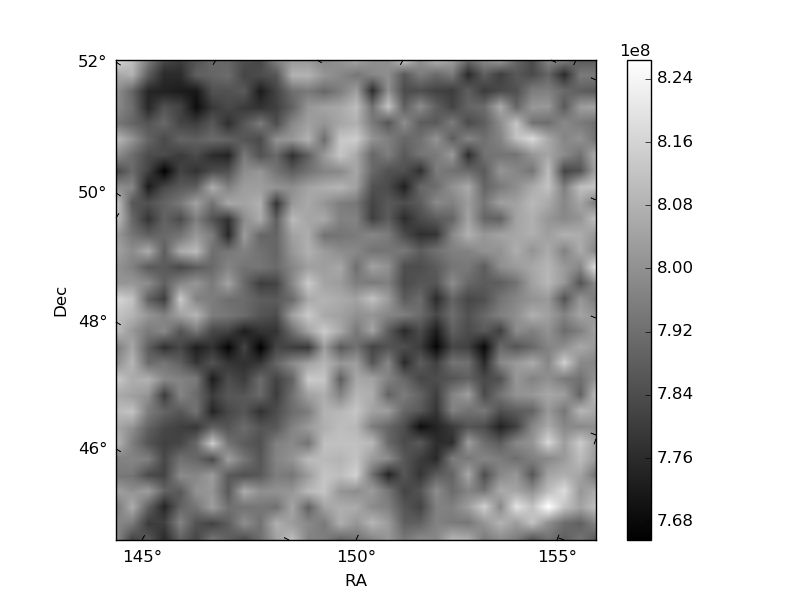
Histogram calculated using DETX and DETY for each event in the final _common_clean file
| Quadrant A | 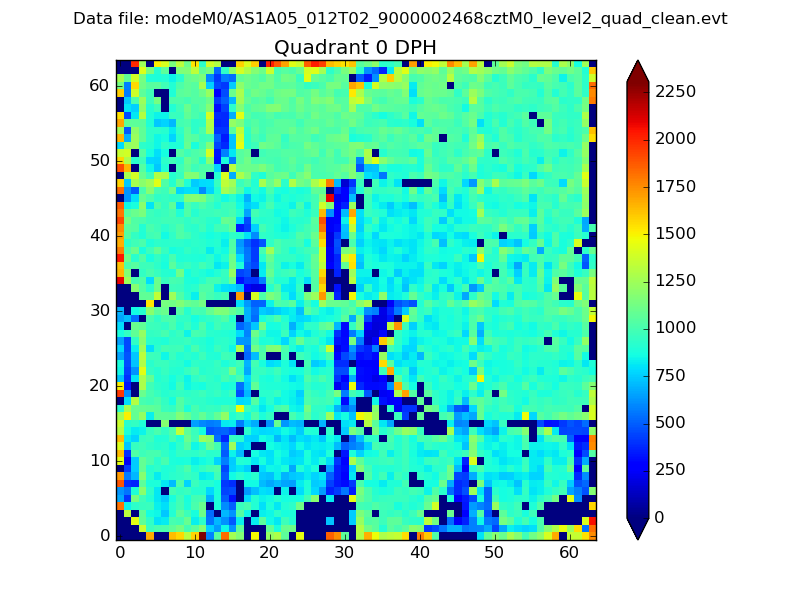 |
 |
Quadrant B |
|---|---|---|---|
| Quadrant D | 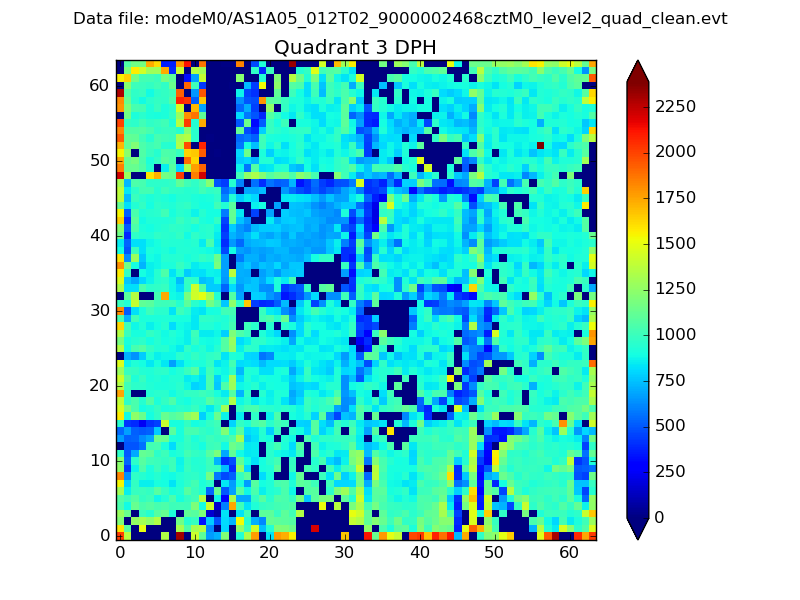 |
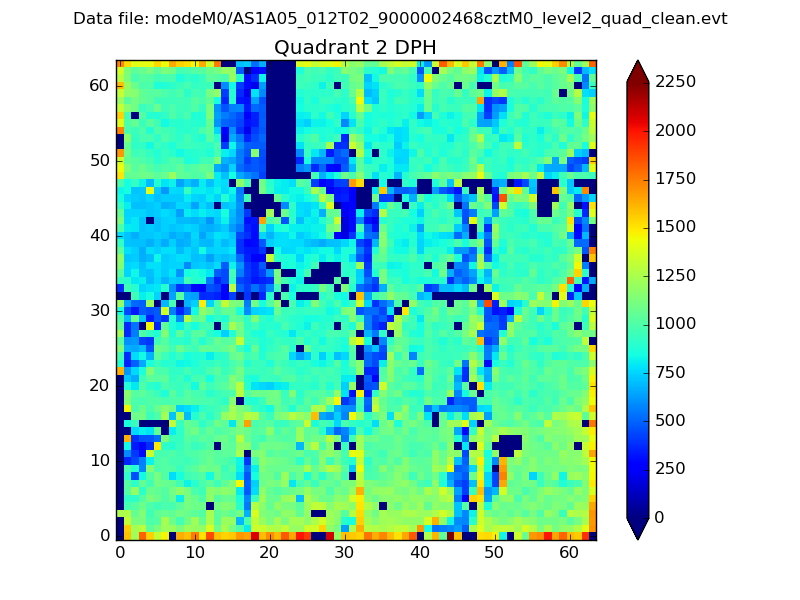 |
Quadrant C |
| Plot type | Count rate plots | Images |
|---|---|---|
| Comparison with Poisson distribution Blue bars denote a histogram of data divided into 1 sec bins. Red curve is a Poisson curve with rate = median count rate of data. |
 |
 |
| Quadrant-wise count rates Data is divided into 100 sec bins |
 |
|
| Module-wise count rates for Quadrant A Data is divided into 100 sec bins |
 |
 |
| Module-wise count rates for Quadrant B Data is divided into 100 sec bins |
 |
 |
| Module-wise count rates for Quadrant C Data is divided into 100 sec bins |
 |
 |
| Module-wise count rates for Quadrant D Data is divided into 100 sec bins |
 |
 |
| Parameter | Plot |
|---|---|
| CZT HV Monitor |  |
| D_VDD | 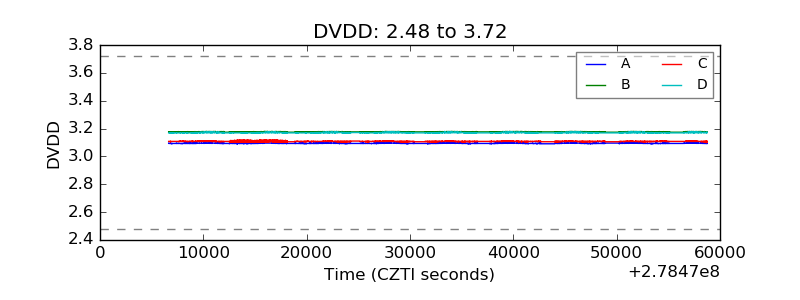 |
| Temperature 1 |  |
| Veto HV Monitor |  |
| Veto LLD |  |
| Alpha Counter |  |
| _CPM_Rate |  |
| CZT Counter |  |
| +2.5 Volts monitor |  |
| +5 Volts monitor |  |
| _ROLL_ROT |  |
| _Roll_DEC |  |
| _Roll_RA |  |
| Veto Counter |  |