| Param | Original file | Final file |
|---|---|---|
| Filename | modeM0/AS1A05_012T02_9000002468_16680cztM0_level2.evt | modeM0/AS1A05_012T02_9000002468_16680cztM0_level2_quad_clean.evt |
| Size (bytes) | 91,805,760 | 20,142,720 |
| Size | 87.6 MB | 19.2 MB |
| Events in quadrant A | 712,956 | 129,844 |
| Events in quadrant B | 515,099 | 134,591 |
| Events in quadrant C | 476,953 | 131,565 |
| Events in quadrant D | 995,004 | 127,086 |
| Mode M0 | |||
|---|---|---|---|
| Quadrant | BADHDUFLAG | Total packets | Discarded packets |
| A | 0 | 2984 | 1 |
| B | 0 | 2298 | 0 |
| C | 0 | 2279 | 0 |
| D | 0 | 3771 | 0 |
| Mode SS | |||
|---|---|---|---|
| Quadrant | BADHDUFLAG | Total packets | Discarded packets |
| A | 0 | 22 | 0 |
| B | 0 | 22 | 0 |
| C | 0 | 22 | 0 |
| D | 0 | 22 | 0 |
| Quadrant | Total seconds | Saturated seconds | Saturation percentage |
|---|---|---|---|
| A | 1138 | 91 | 7.996485% |
| B | 1138 | 1 | 0.087873% |
| C | 1138 | 2 | 0.175747% |
| D | 1138 | 13 | 1.142355% |
Noise dominated data is calculated using 1-second bins in cleaned event files. If a bin has >2000 counts, and if more than 50% of those come from <1% of pixels, then it is considered to be noise-dominated and hence unusable.
| Quadrant | # 1 sec bins | Bins with >0 counts | Bins with >2000 counts | High rate bins dominated by noise | Noise dominated (total time) | Noise dominated (detector-on time) | Marked lightcurve |
|---|---|---|---|---|---|---|---|
| A | 1139 | 1139 | 85 | 85 | 7.46% | 7.46% | 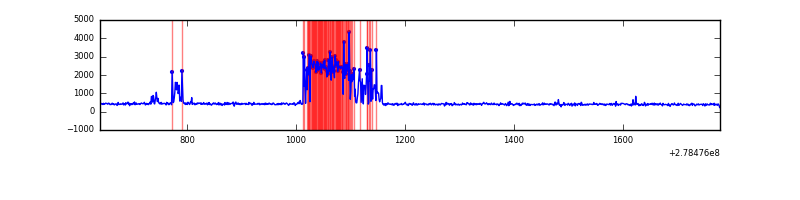 |
| B | 1139 | 1139 | 0 | 0 | 0.00% | 0.00% | 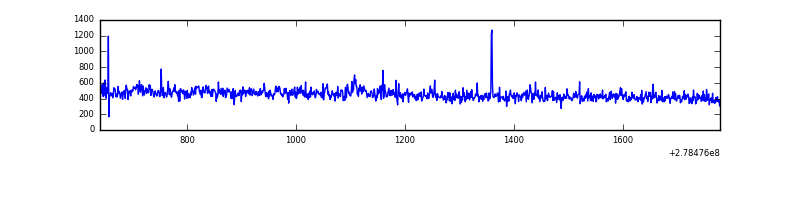 |
| C | 1139 | 1139 | 0 | 0 | 0.00% | 0.00% | 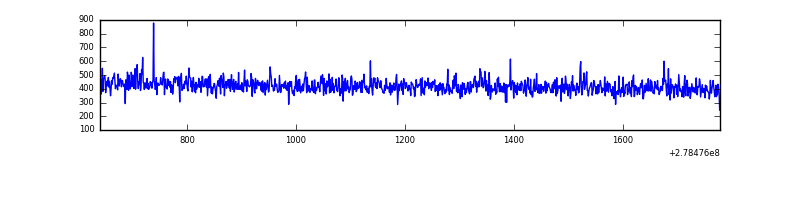 |
| D | 1139 | 1139 | 12 | 12 | 1.05% | 1.05% | 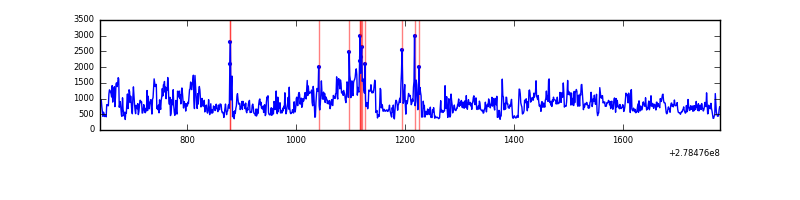 |
Top three noisy pixels from each quadrant. If the there are fewer than three noisy pixels in the level2.evt file, extra rows are filled as -1
| Pixel properties | Quadrant properties | ||||||
|---|---|---|---|---|---|---|---|
| Quadrant | DetID | PixID | Counts | Sigma | Mean | Median | Sigma |
| A | 15 | 174 | 261447 | 10100.66 | 117 | 114 | 25.9 |
| A | 12 | 96 | 1265 | 44.49 | 117 | 114 | 25.9 |
| A | 0 | 226 | 981 | 33.51 | 117 | 114 | 25.9 |
| B | 0 | 229 | 21469 | 828.14 | 123 | 120 | 25.8 |
| B | 15 | 35 | 5251 | 199.03 | 123 | 120 | 25.8 |
| B | 0 | 189 | 4534 | 171.22 | 123 | 120 | 25.8 |
| C | 14 | 238 | 17834 | 617.43 | 116 | 116 | 28.7 |
| C | 7 | 247 | 3591 | 121.1 | 116 | 116 | 28.7 |
| C | 3 | 233 | 1349 | 42.97 | 116 | 116 | 28.7 |
| D | 2 | 16 | 508374 | 17318.78 | 114 | 110 | 29.3 |
| D | 1 | 52 | 43554 | 1480.33 | 114 | 110 | 29.3 |
| D | 2 | 234 | 4498 | 149.52 | 114 | 110 | 29.3 |
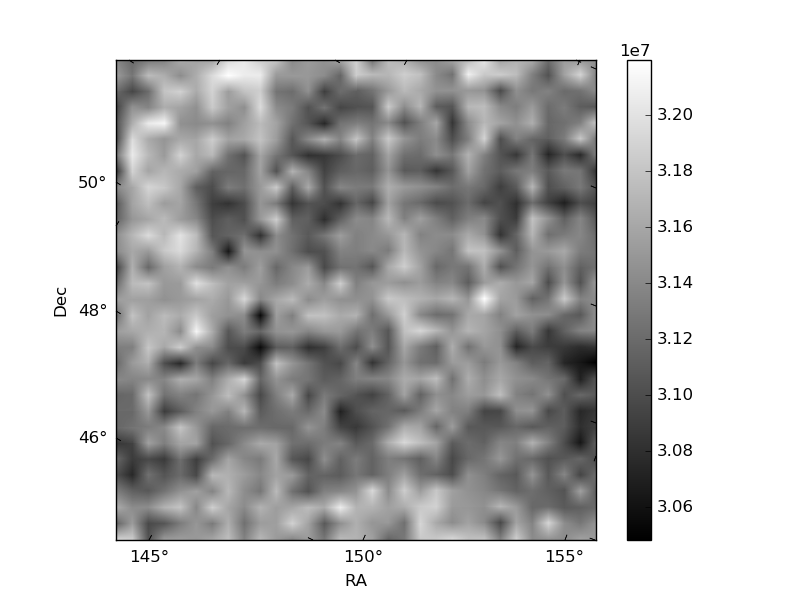
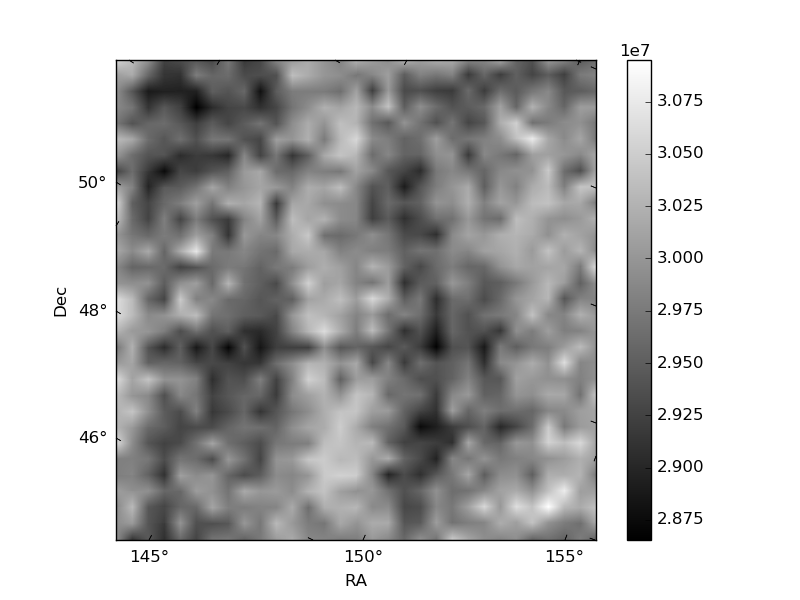
Histogram calculated using DETX and DETY for each event in the final _common_clean file
| Quadrant A | 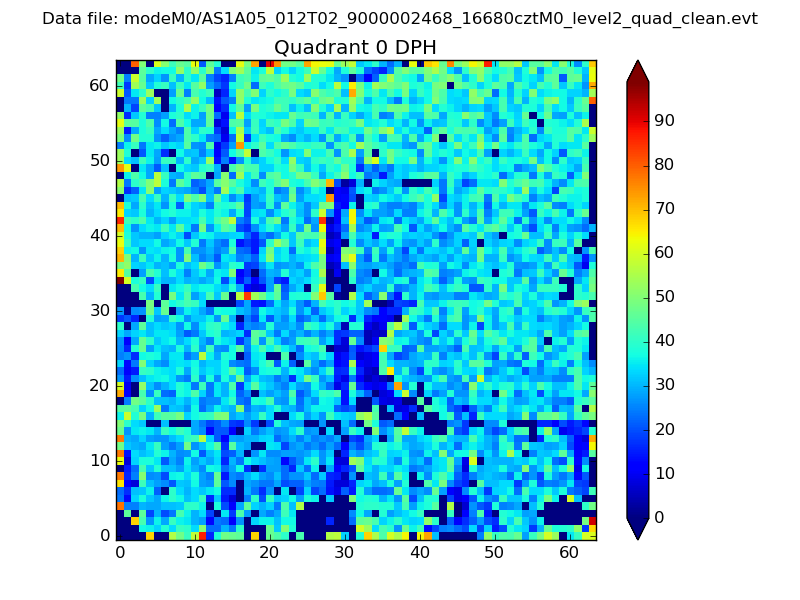 |
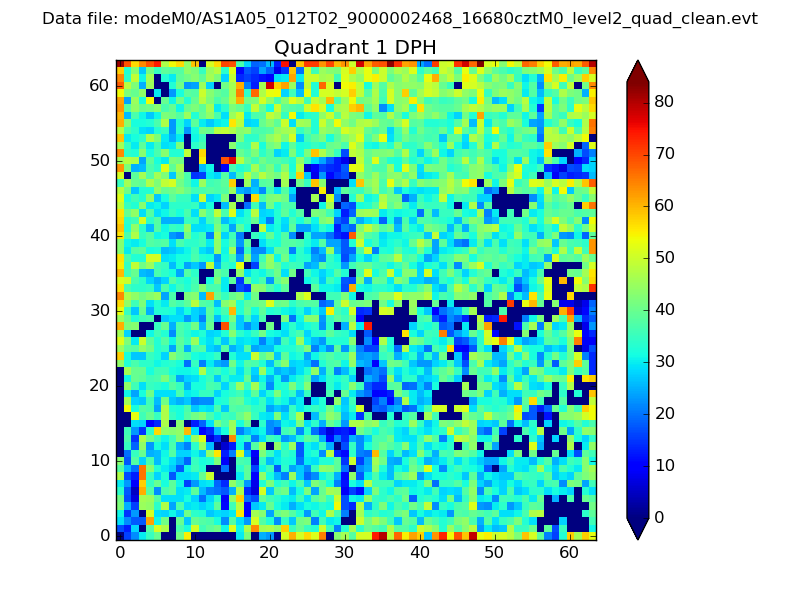 |
Quadrant B |
|---|---|---|---|
| Quadrant D | 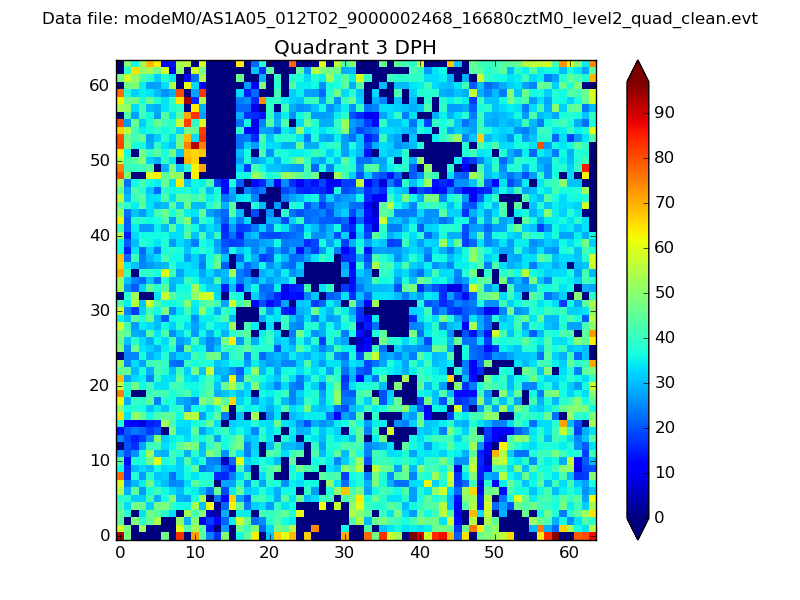 |
 |
Quadrant C |
| Plot type | Count rate plots | Images |
|---|---|---|
| Comparison with Poisson distribution Blue bars denote a histogram of data divided into 1 sec bins. Red curve is a Poisson curve with rate = median count rate of data. |
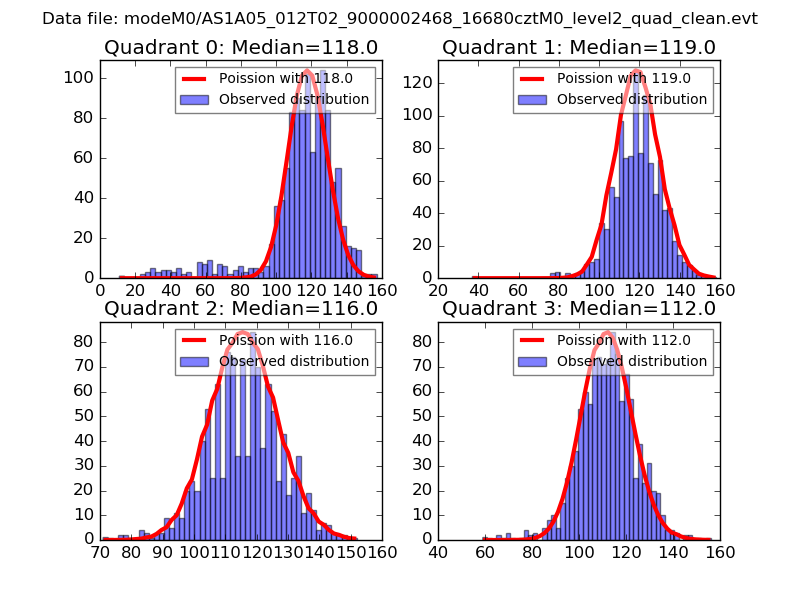 |
 |
| Quadrant-wise count rates Data is divided into 100 sec bins |
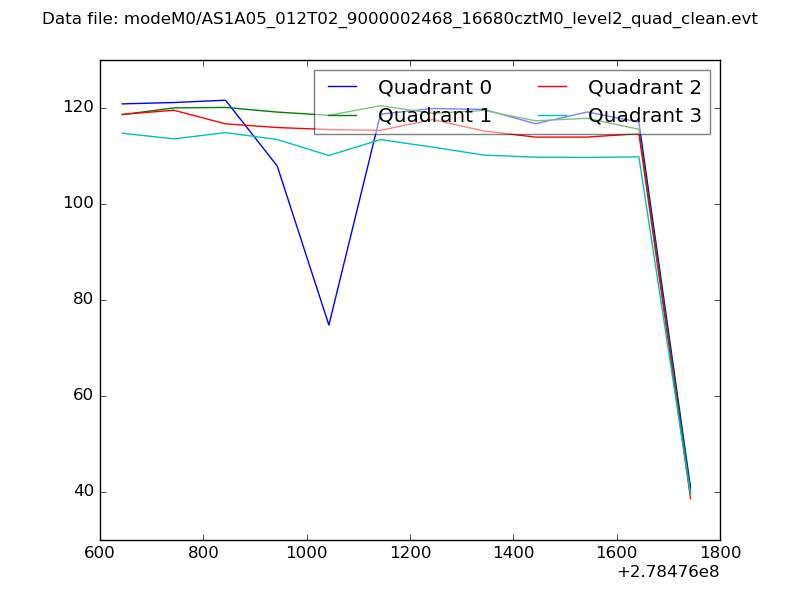 |
|
| Module-wise count rates for Quadrant A Data is divided into 100 sec bins |
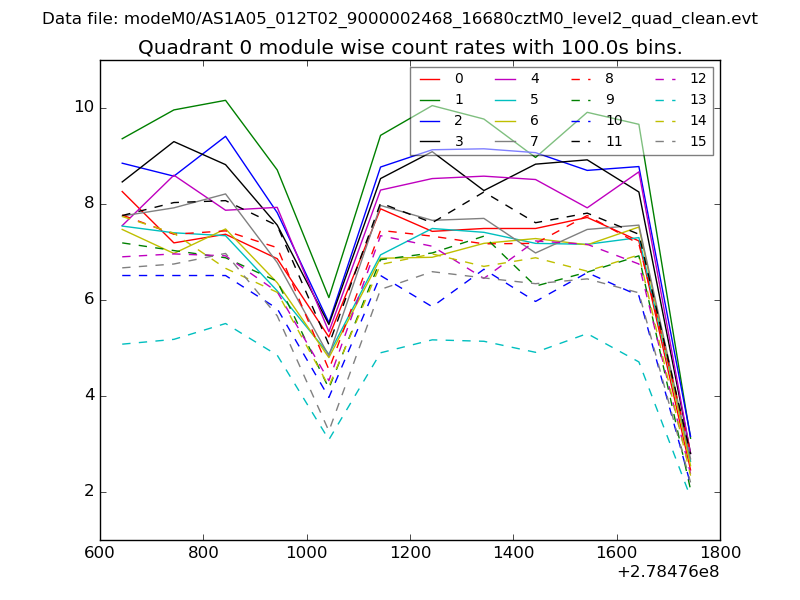 |
 |
| Module-wise count rates for Quadrant B Data is divided into 100 sec bins |
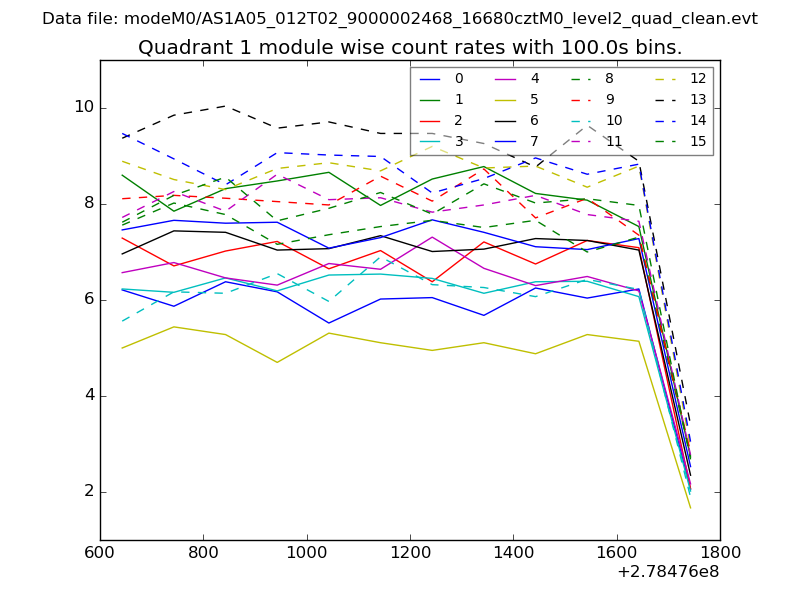 |
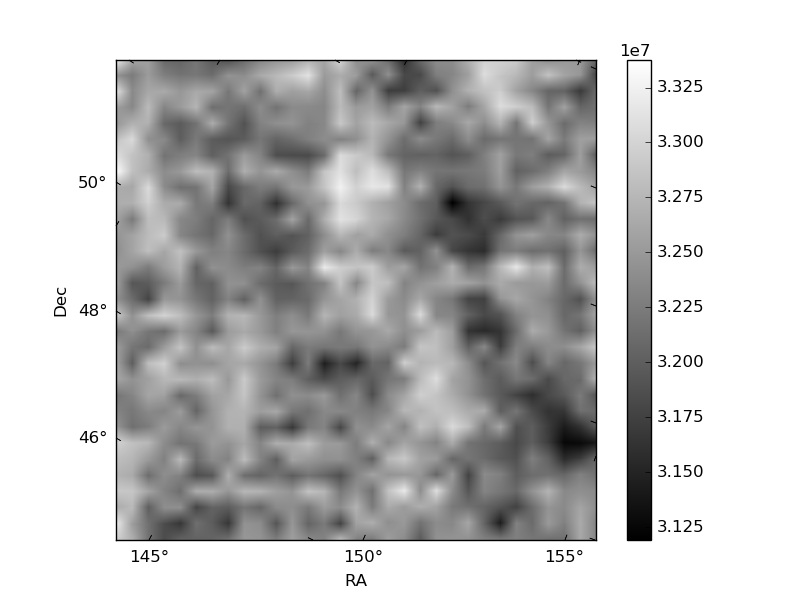 |
| Module-wise count rates for Quadrant C Data is divided into 100 sec bins |
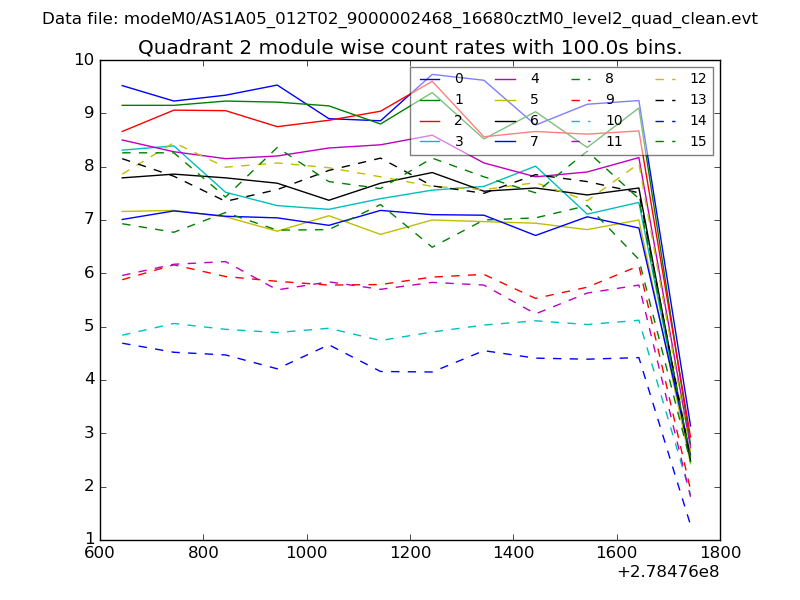 |
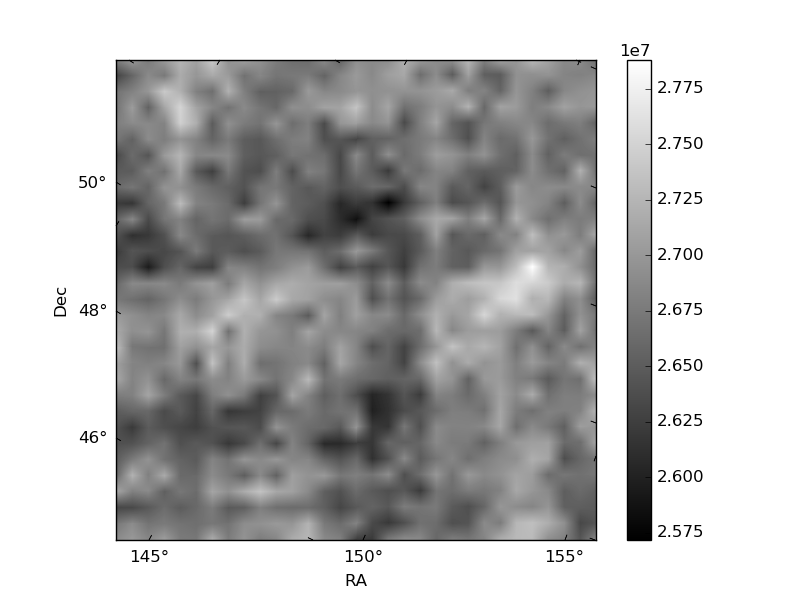 |
| Module-wise count rates for Quadrant D Data is divided into 100 sec bins |
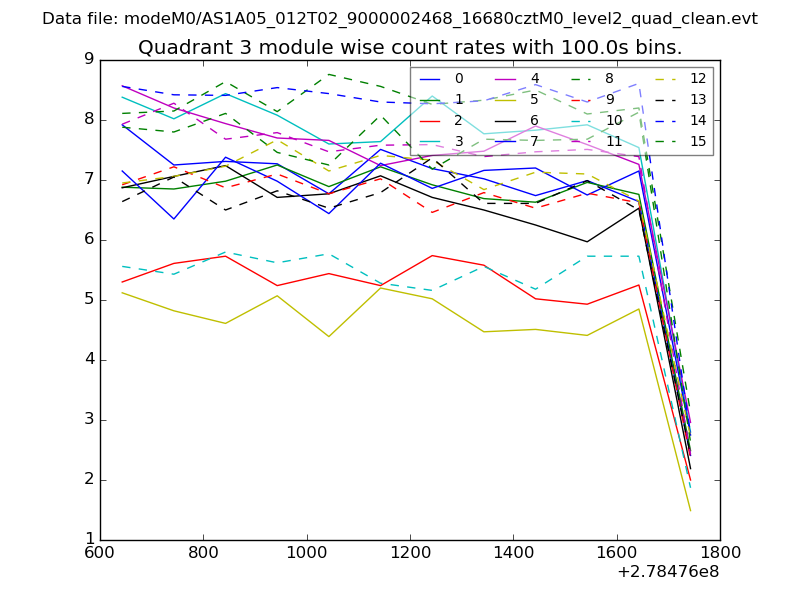 |
 |
| Parameter | Plot |
|---|---|
| CZT HV Monitor | 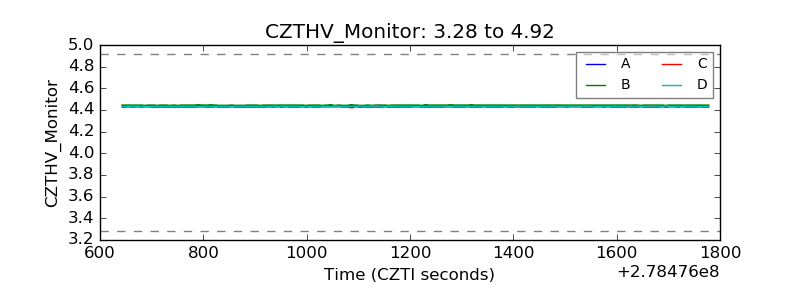 |
| D_VDD | 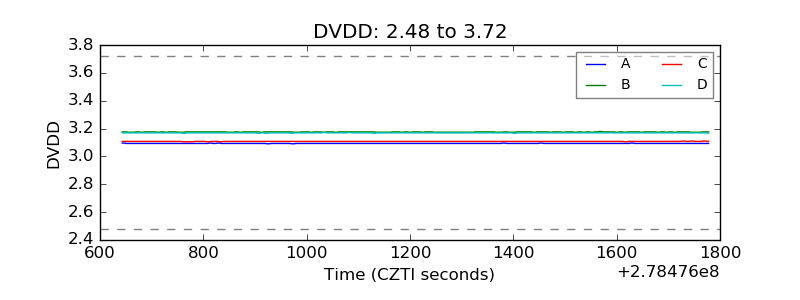 |
| Temperature 1 | 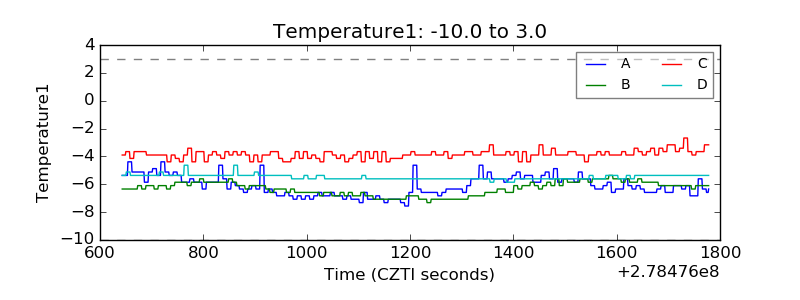 |
| Veto HV Monitor | 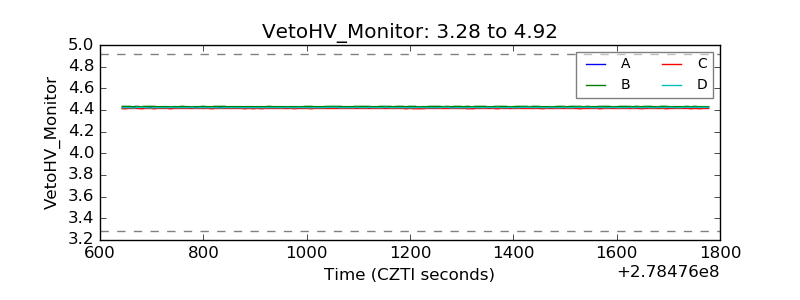 |
| Veto LLD | 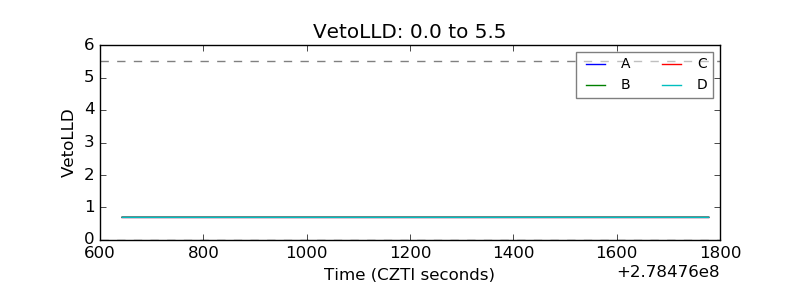 |
| Alpha Counter | 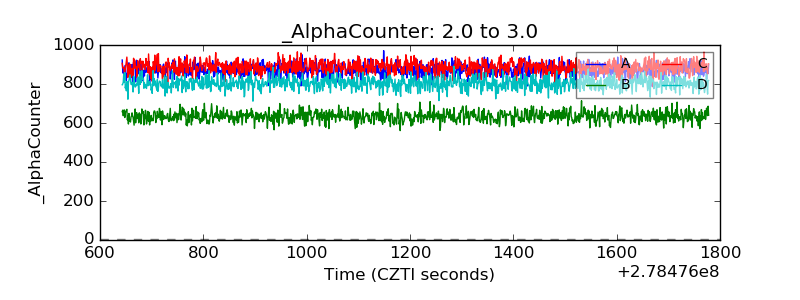 |
| _CPM_Rate | 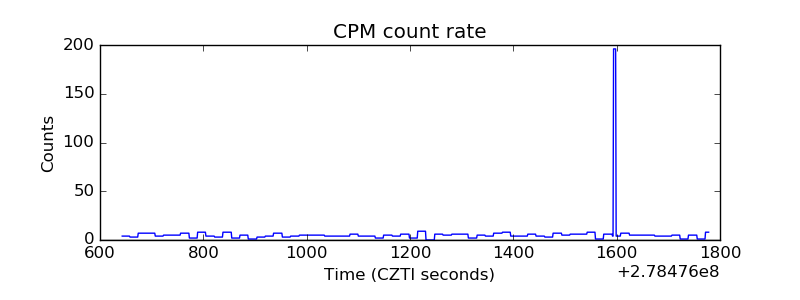 |
| CZT Counter |  |
| +2.5 Volts monitor |  |
| +5 Volts monitor |  |
| _ROLL_ROT | 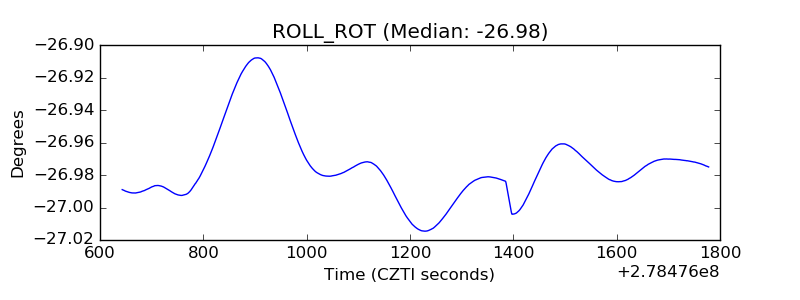 |
| _Roll_DEC | 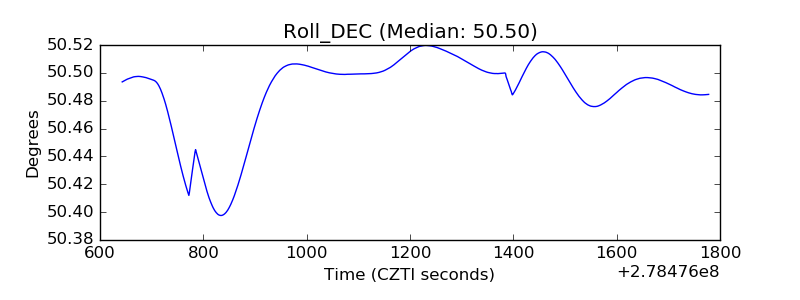 |
| _Roll_RA |  |
| Veto Counter | 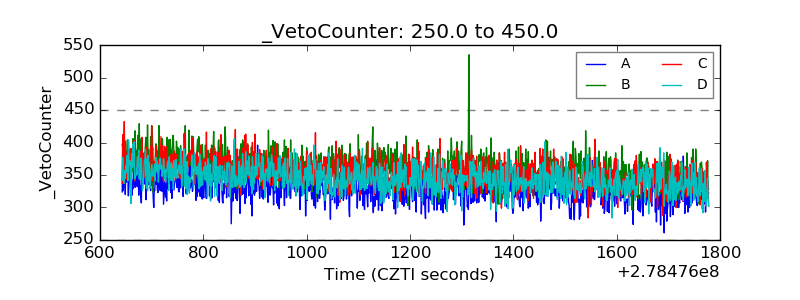 |