| Param | Original file | Final file |
|---|---|---|
| Filename | modeM0/AS1A05_012T02_9000002468_16682cztM0_level2.evt | modeM0/AS1A05_012T02_9000002468_16682cztM0_level2_quad_clean.evt |
| Size (bytes) | 1,003,452,480 | 161,602,560 |
| Size | 957.0 MB | 154.1 MB |
| Events in quadrant A | 7,431,832 | 1,019,718 |
| Events in quadrant B | 5,975,877 | 1,046,370 |
| Events in quadrant C | 5,522,486 | 1,011,662 |
| Events in quadrant D | 10,635,187 | 972,685 |
| Mode M0 | |||
|---|---|---|---|
| Quadrant | BADHDUFLAG | Total packets | Discarded packets |
| A | 0 | 30550 | 3 |
| B | 0 | 25796 | 2 |
| C | 0 | 24858 | 2 |
| D | 0 | 40373 | 2 |
| Mode M9 | |||
|---|---|---|---|
| Quadrant | BADHDUFLAG | Total packets | Discarded packets |
| A | 0 | 12 | 0 |
| B | 0 | 12 | 0 |
| C | 0 | 12 | 0 |
| D | 0 | 12 | 0 |
| Mode SS | |||
|---|---|---|---|
| Quadrant | BADHDUFLAG | Total packets | Discarded packets |
| A | 0 | 248 | 0 |
| B | 0 | 248 | 0 |
| C | 0 | 248 | 0 |
| D | 0 | 248 | 0 |
| Quadrant | Total seconds | Saturated seconds | Saturation percentage |
|---|---|---|---|
| A | 12204 | 549 | 4.498525% |
| B | 12204 | 111 | 0.909538% |
| C | 12204 | 90 | 0.737463% |
| D | 12204 | 650 | 5.326123% |
Noise dominated data is calculated using 1-second bins in cleaned event files. If a bin has >2000 counts, and if more than 50% of those come from <1% of pixels, then it is considered to be noise-dominated and hence unusable.
| Quadrant | # 1 sec bins | Bins with >0 counts | Bins with >2000 counts | High rate bins dominated by noise | Noise dominated (total time) | Noise dominated (detector-on time) | Marked lightcurve |
|---|---|---|---|---|---|---|---|
| A | 13385 | 12207 | 345 | 345 | 2.58% | 2.83% | 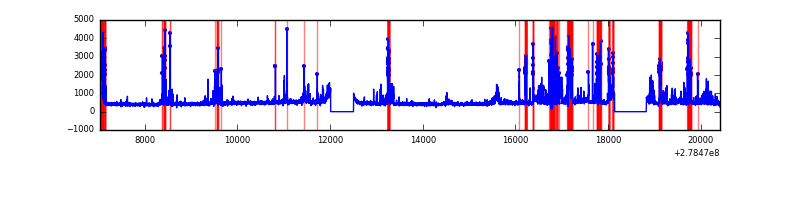 |
| B | 13385 | 12207 | 6 | 6 | 0.04% | 0.05% |  |
| C | 13385 | 12207 | 0 | 0 | 0.00% | 0.00% | 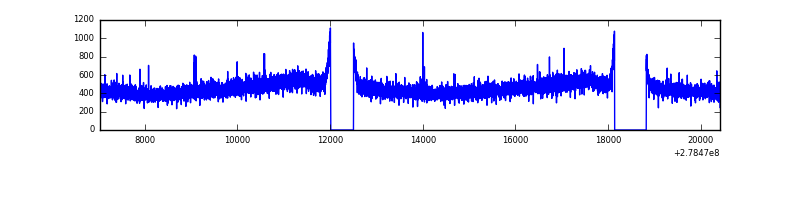 |
| D | 13385 | 12207 | 463 | 463 | 3.46% | 3.79% | 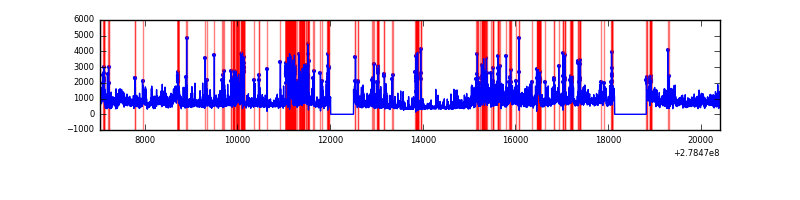 |
Top three noisy pixels from each quadrant. If the there are fewer than three noisy pixels in the level2.evt file, extra rows are filled as -1
| Pixel properties | Quadrant properties | ||||||
|---|---|---|---|---|---|---|---|
| Quadrant | DetID | PixID | Counts | Sigma | Mean | Median | Sigma |
| A | 15 | 174 | 1496633 | 5334.99 | 1393 | 1364 | 280.3 |
| A | 12 | 96 | 310055 | 1101.38 | 1393 | 1364 | 280.3 |
| A | 9 | 143 | 257448 | 913.68 | 1393 | 1364 | 280.3 |
| B | 15 | 35 | 196700 | 723.33 | 1413 | 1375 | 270.0 |
| B | 0 | 229 | 120921 | 442.71 | 1413 | 1375 | 270.0 |
| B | 0 | 189 | 65252 | 236.55 | 1413 | 1375 | 270.0 |
| C | 14 | 238 | 206646 | 654.13 | 1349 | 1358 | 313.8 |
| C | 7 | 247 | 31946 | 97.47 | 1349 | 1358 | 313.8 |
| C | 8 | 128 | 12265 | 34.75 | 1349 | 1358 | 313.8 |
| D | 1 | 52 | 2748003 | 8446.57 | 1336 | 1298 | 325.2 |
| D | 2 | 16 | 1720044 | 5285.43 | 1336 | 1298 | 325.2 |
| D | 15 | 0 | 564771 | 1732.77 | 1336 | 1298 | 325.2 |
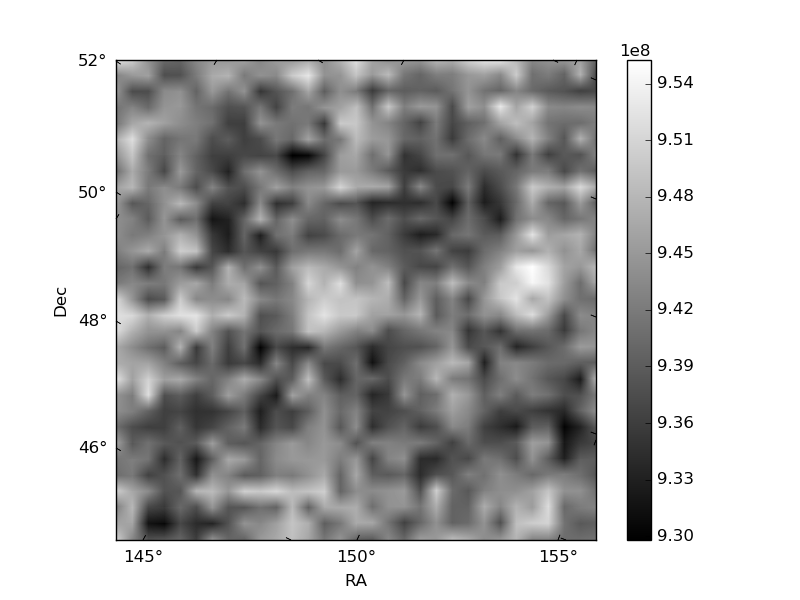
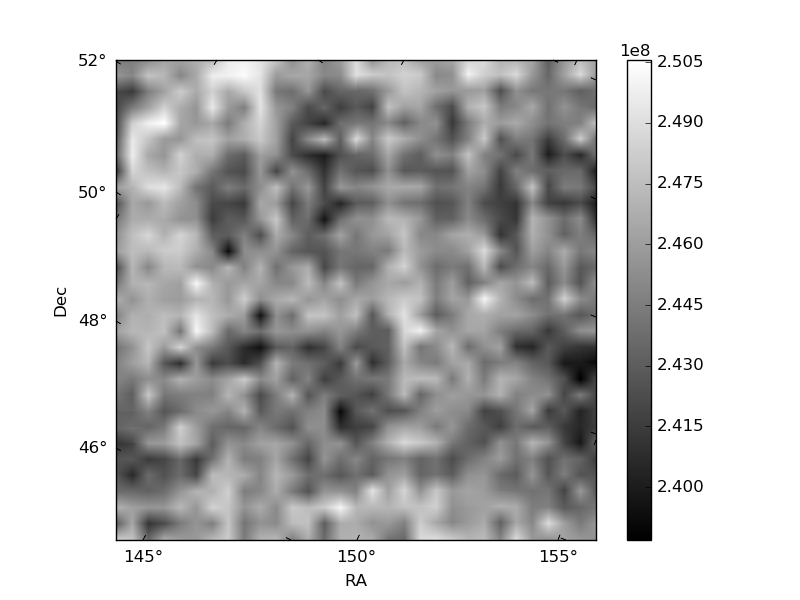
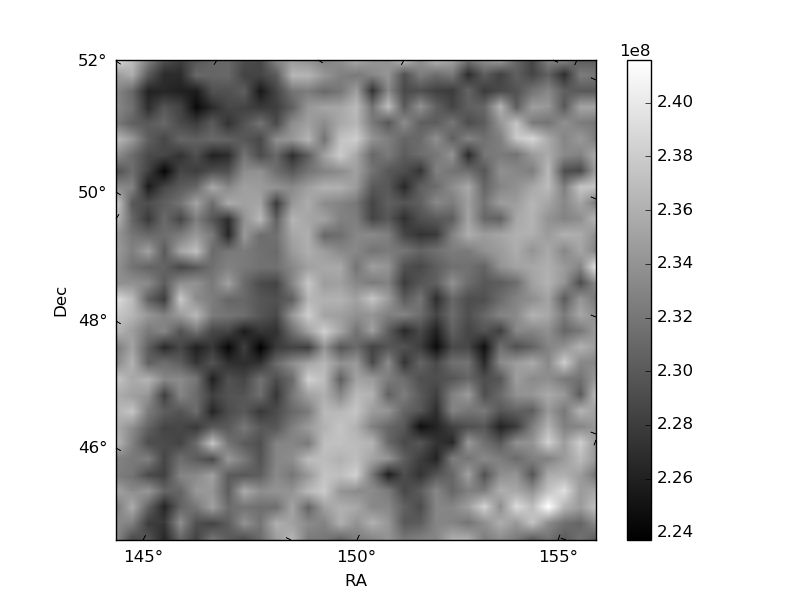
Histogram calculated using DETX and DETY for each event in the final _common_clean file
| Quadrant A |  |
 |
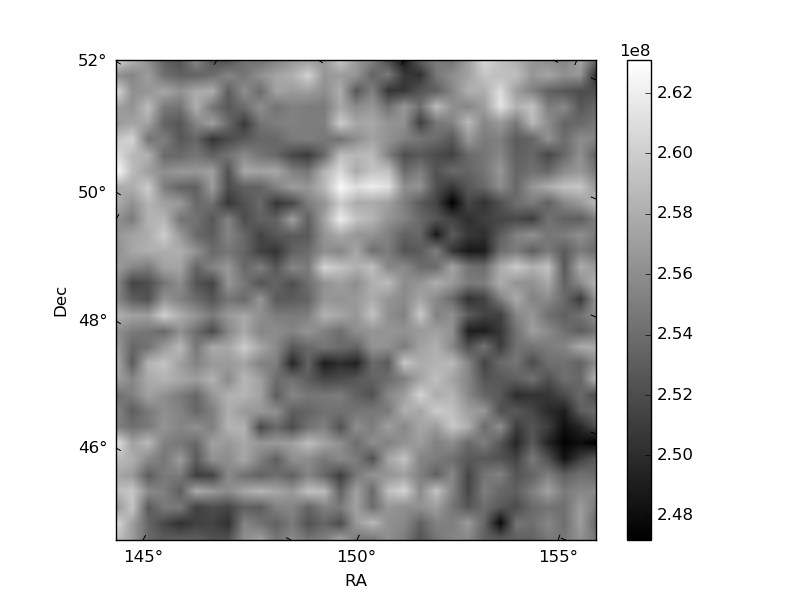
Quadrant B |
|---|---|---|---|
| Quadrant D |  |
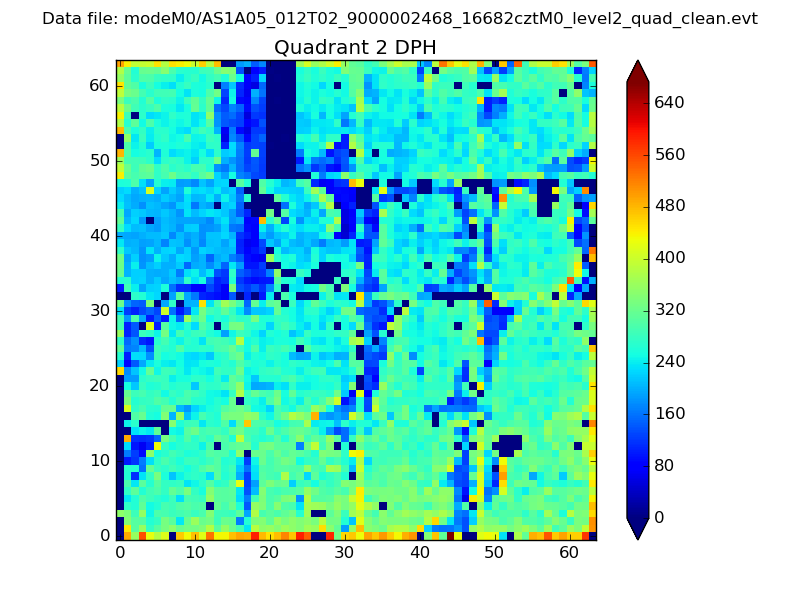 |
Quadrant C |
| Plot type | Count rate plots | Images |
|---|---|---|
| Comparison with Poisson distribution Blue bars denote a histogram of data divided into 1 sec bins. Red curve is a Poisson curve with rate = median count rate of data. |
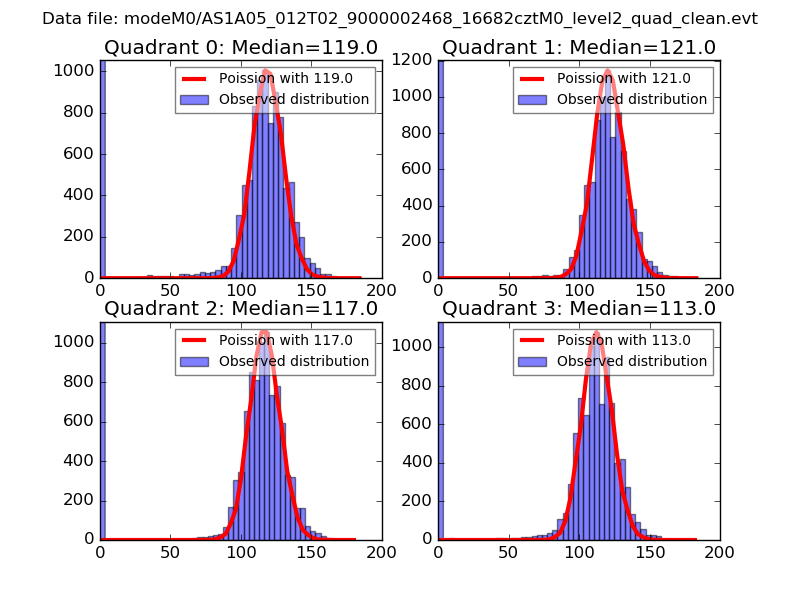 |
 |
| Quadrant-wise count rates Data is divided into 100 sec bins |
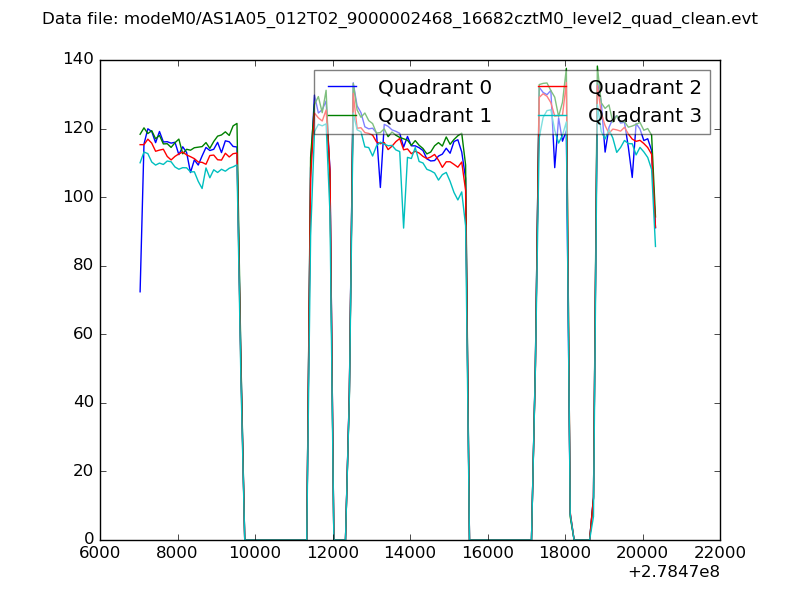 |
|
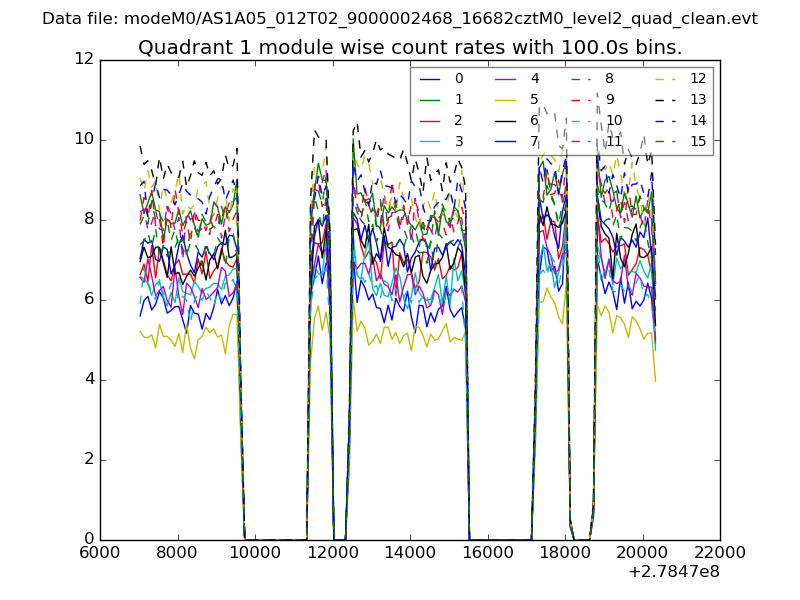
| Module-wise count rates for Quadrant A Data is divided into 100 sec bins |
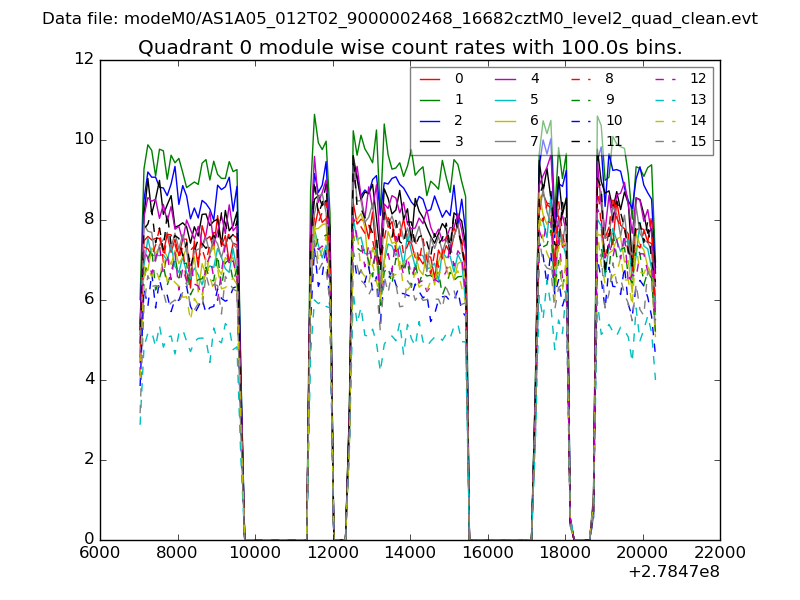 |
 |
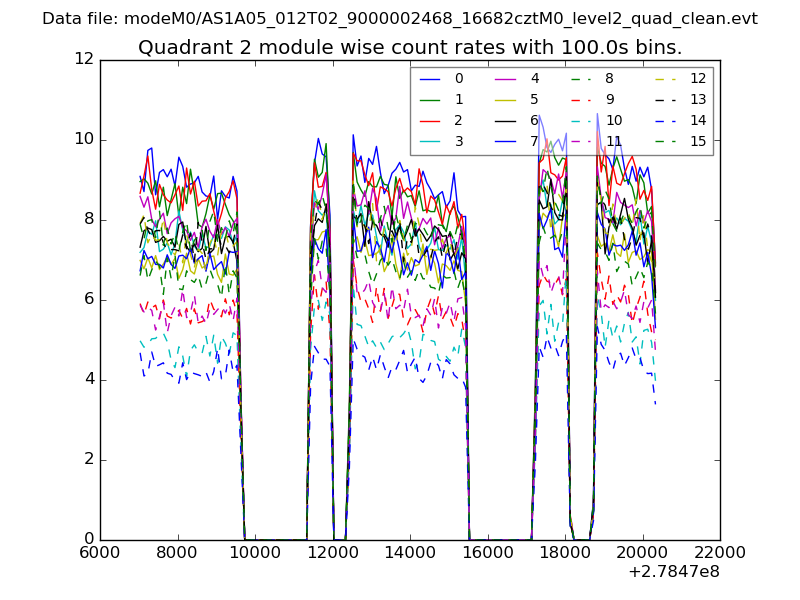
| Module-wise count rates for Quadrant B Data is divided into 100 sec bins |
 |
 |
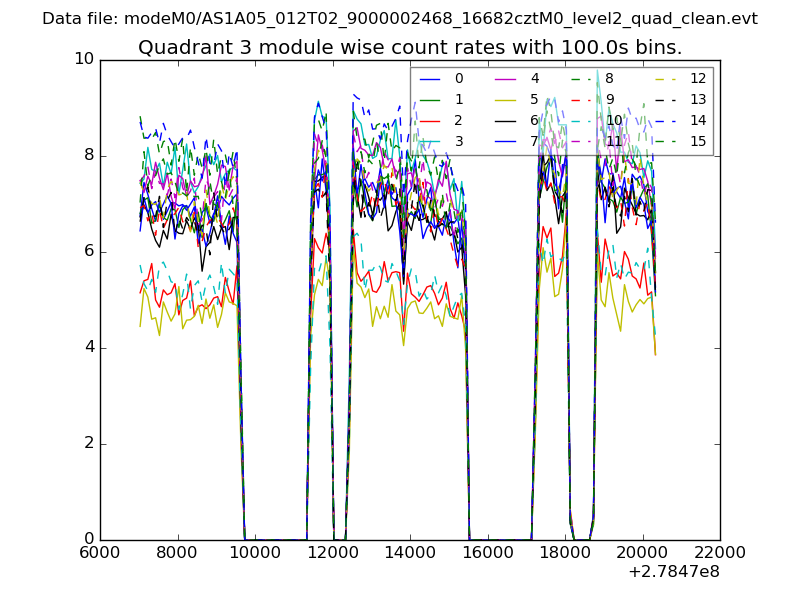
| Module-wise count rates for Quadrant C Data is divided into 100 sec bins |
 |
 |
| Module-wise count rates for Quadrant D Data is divided into 100 sec bins |
 |
 |
| Parameter | Plot |
|---|---|
| CZT HV Monitor | 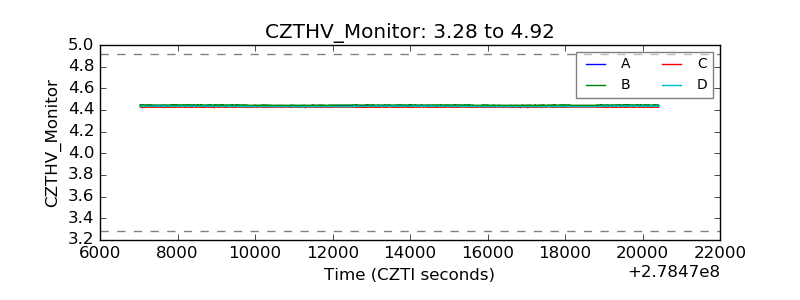 |
| D_VDD | 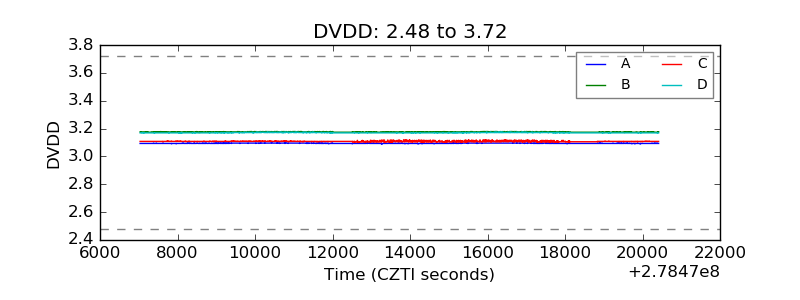 |
| Temperature 1 | 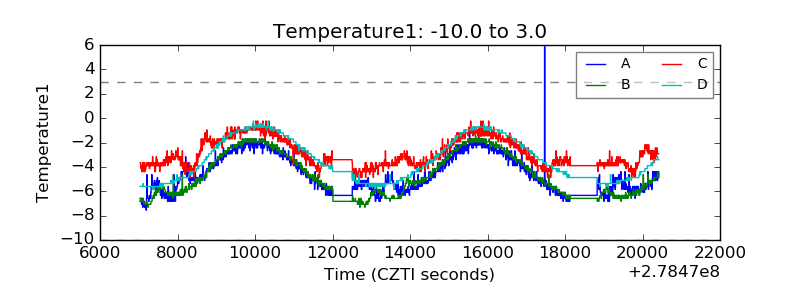 |
| Veto HV Monitor | 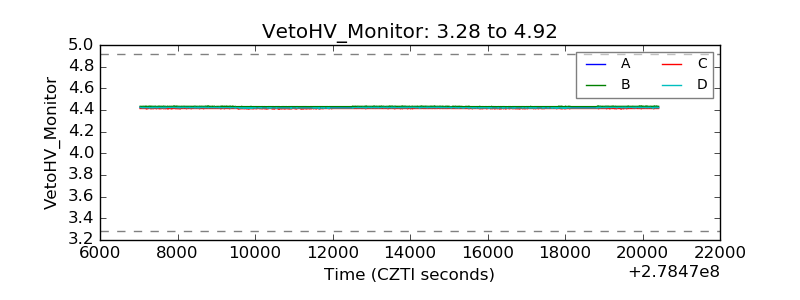 |
| Veto LLD |  |
| Alpha Counter | 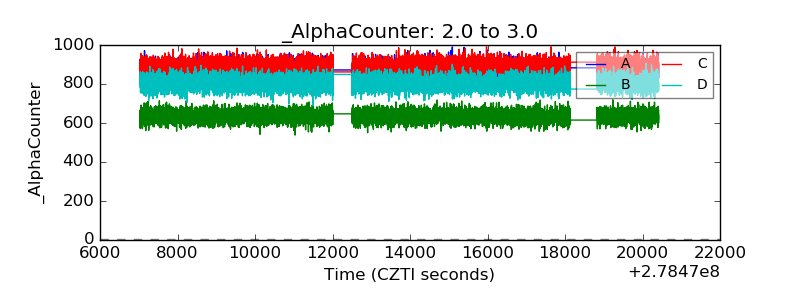 |
| _CPM_Rate | 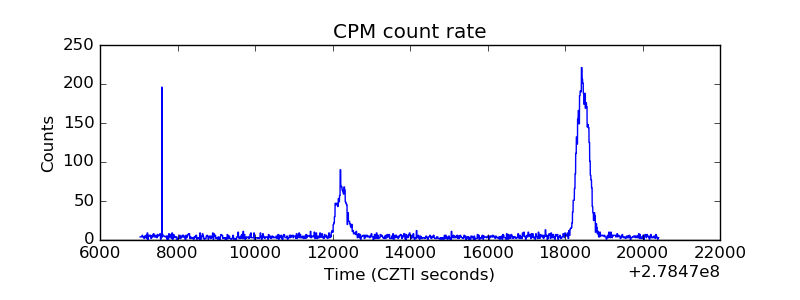 |
| CZT Counter | 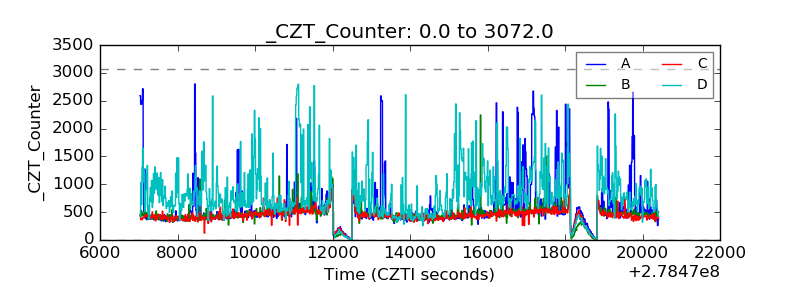 |
| +2.5 Volts monitor |  |
| +5 Volts monitor | 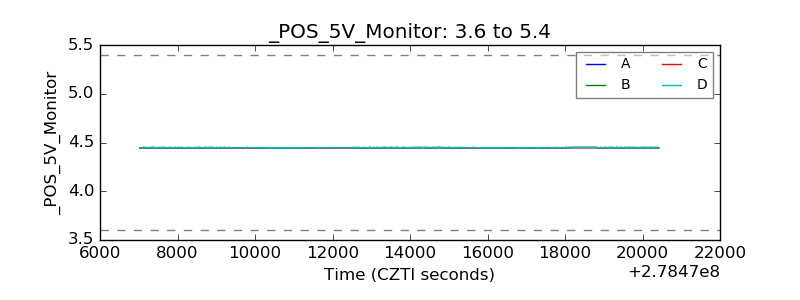 |
| _ROLL_ROT | 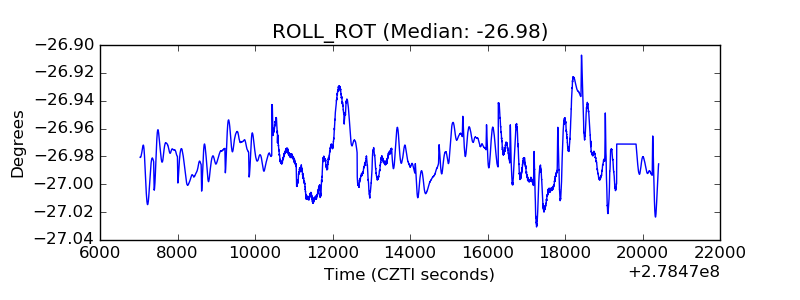 |
| _Roll_DEC | 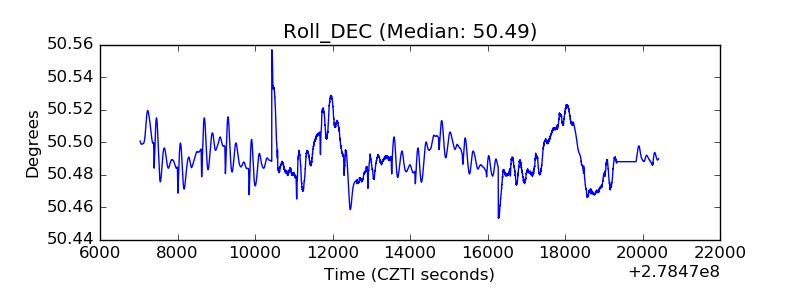 |
| _Roll_RA | 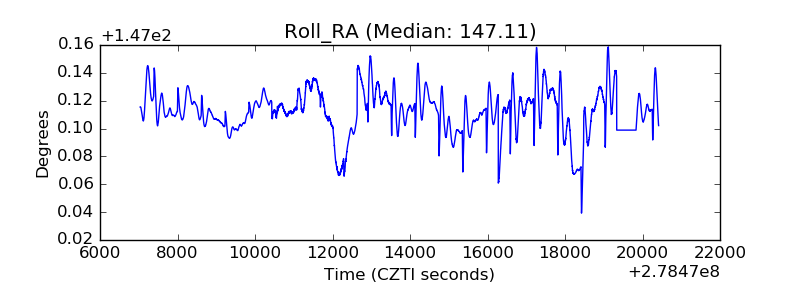 |
| Veto Counter | 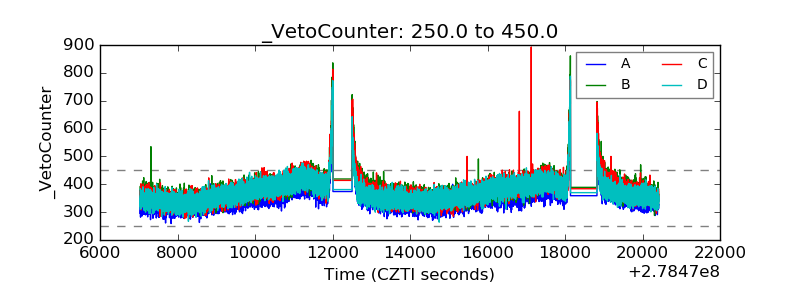 |